
















Copyright: ©Author(s) 2026.
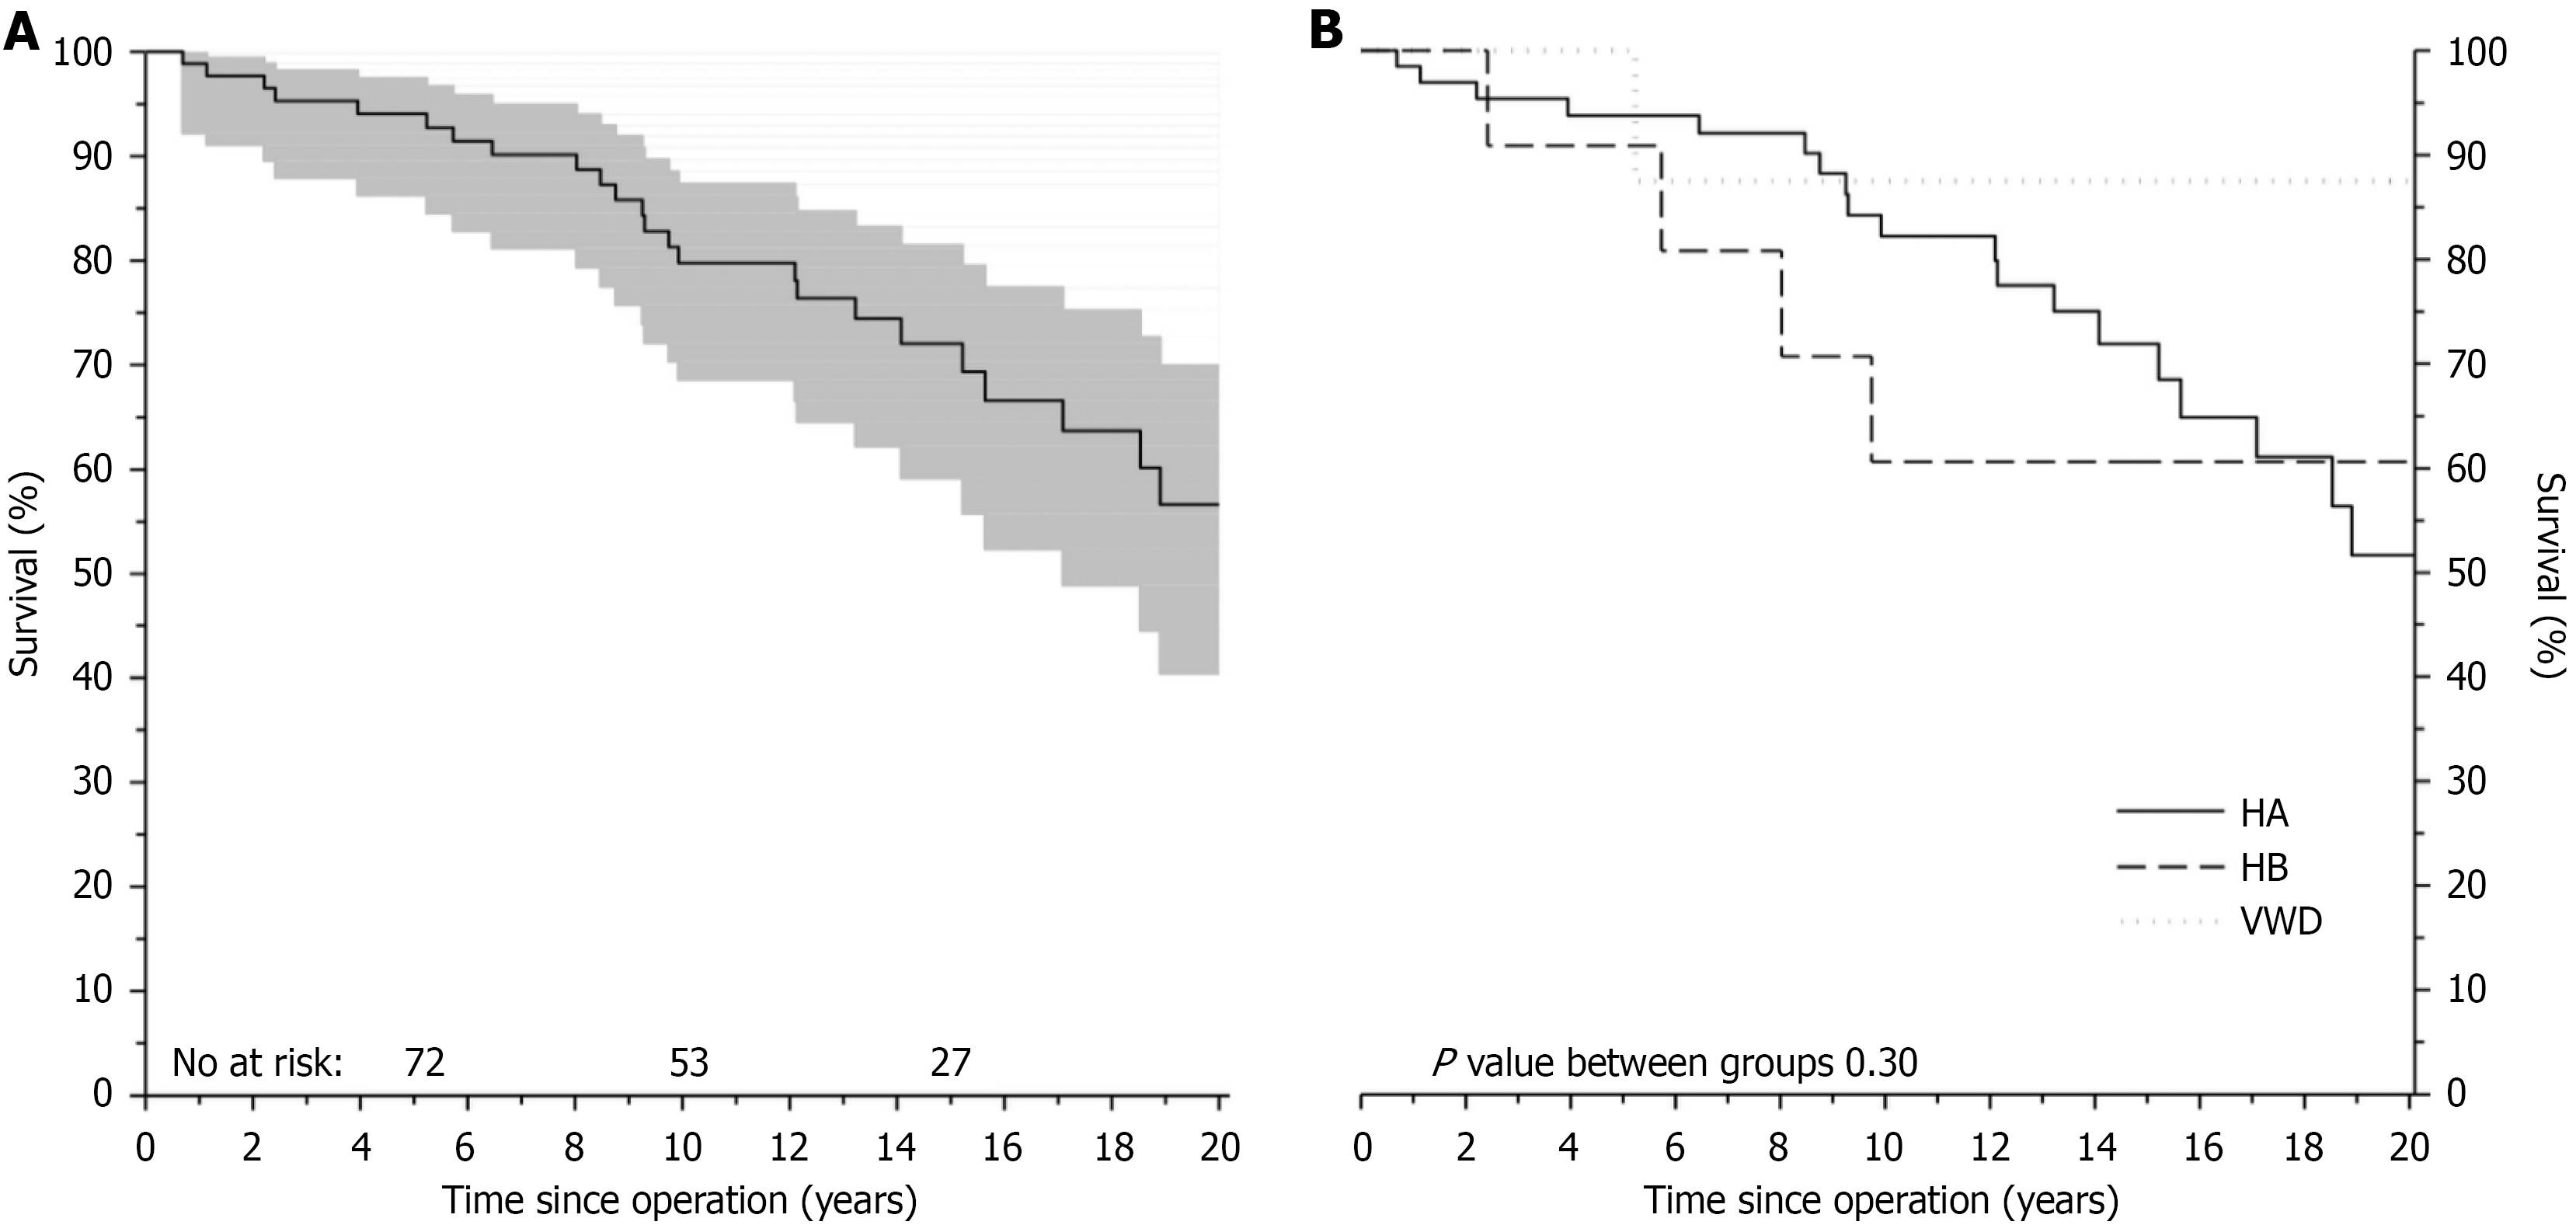
Figure 1 Kaplan-Meier analysis of implant survival.
A: Kaplan-Meier analysis of implant survival of all 90 knee replacements in bleeding disorder patients. The gray area shows 95% confidence limits. No at risk: Number at risk; B: Implant survival according to subgroups of patients: HA: Hemophilia A; HB: Hemophilia B; VWD: Von Willebrand disease.
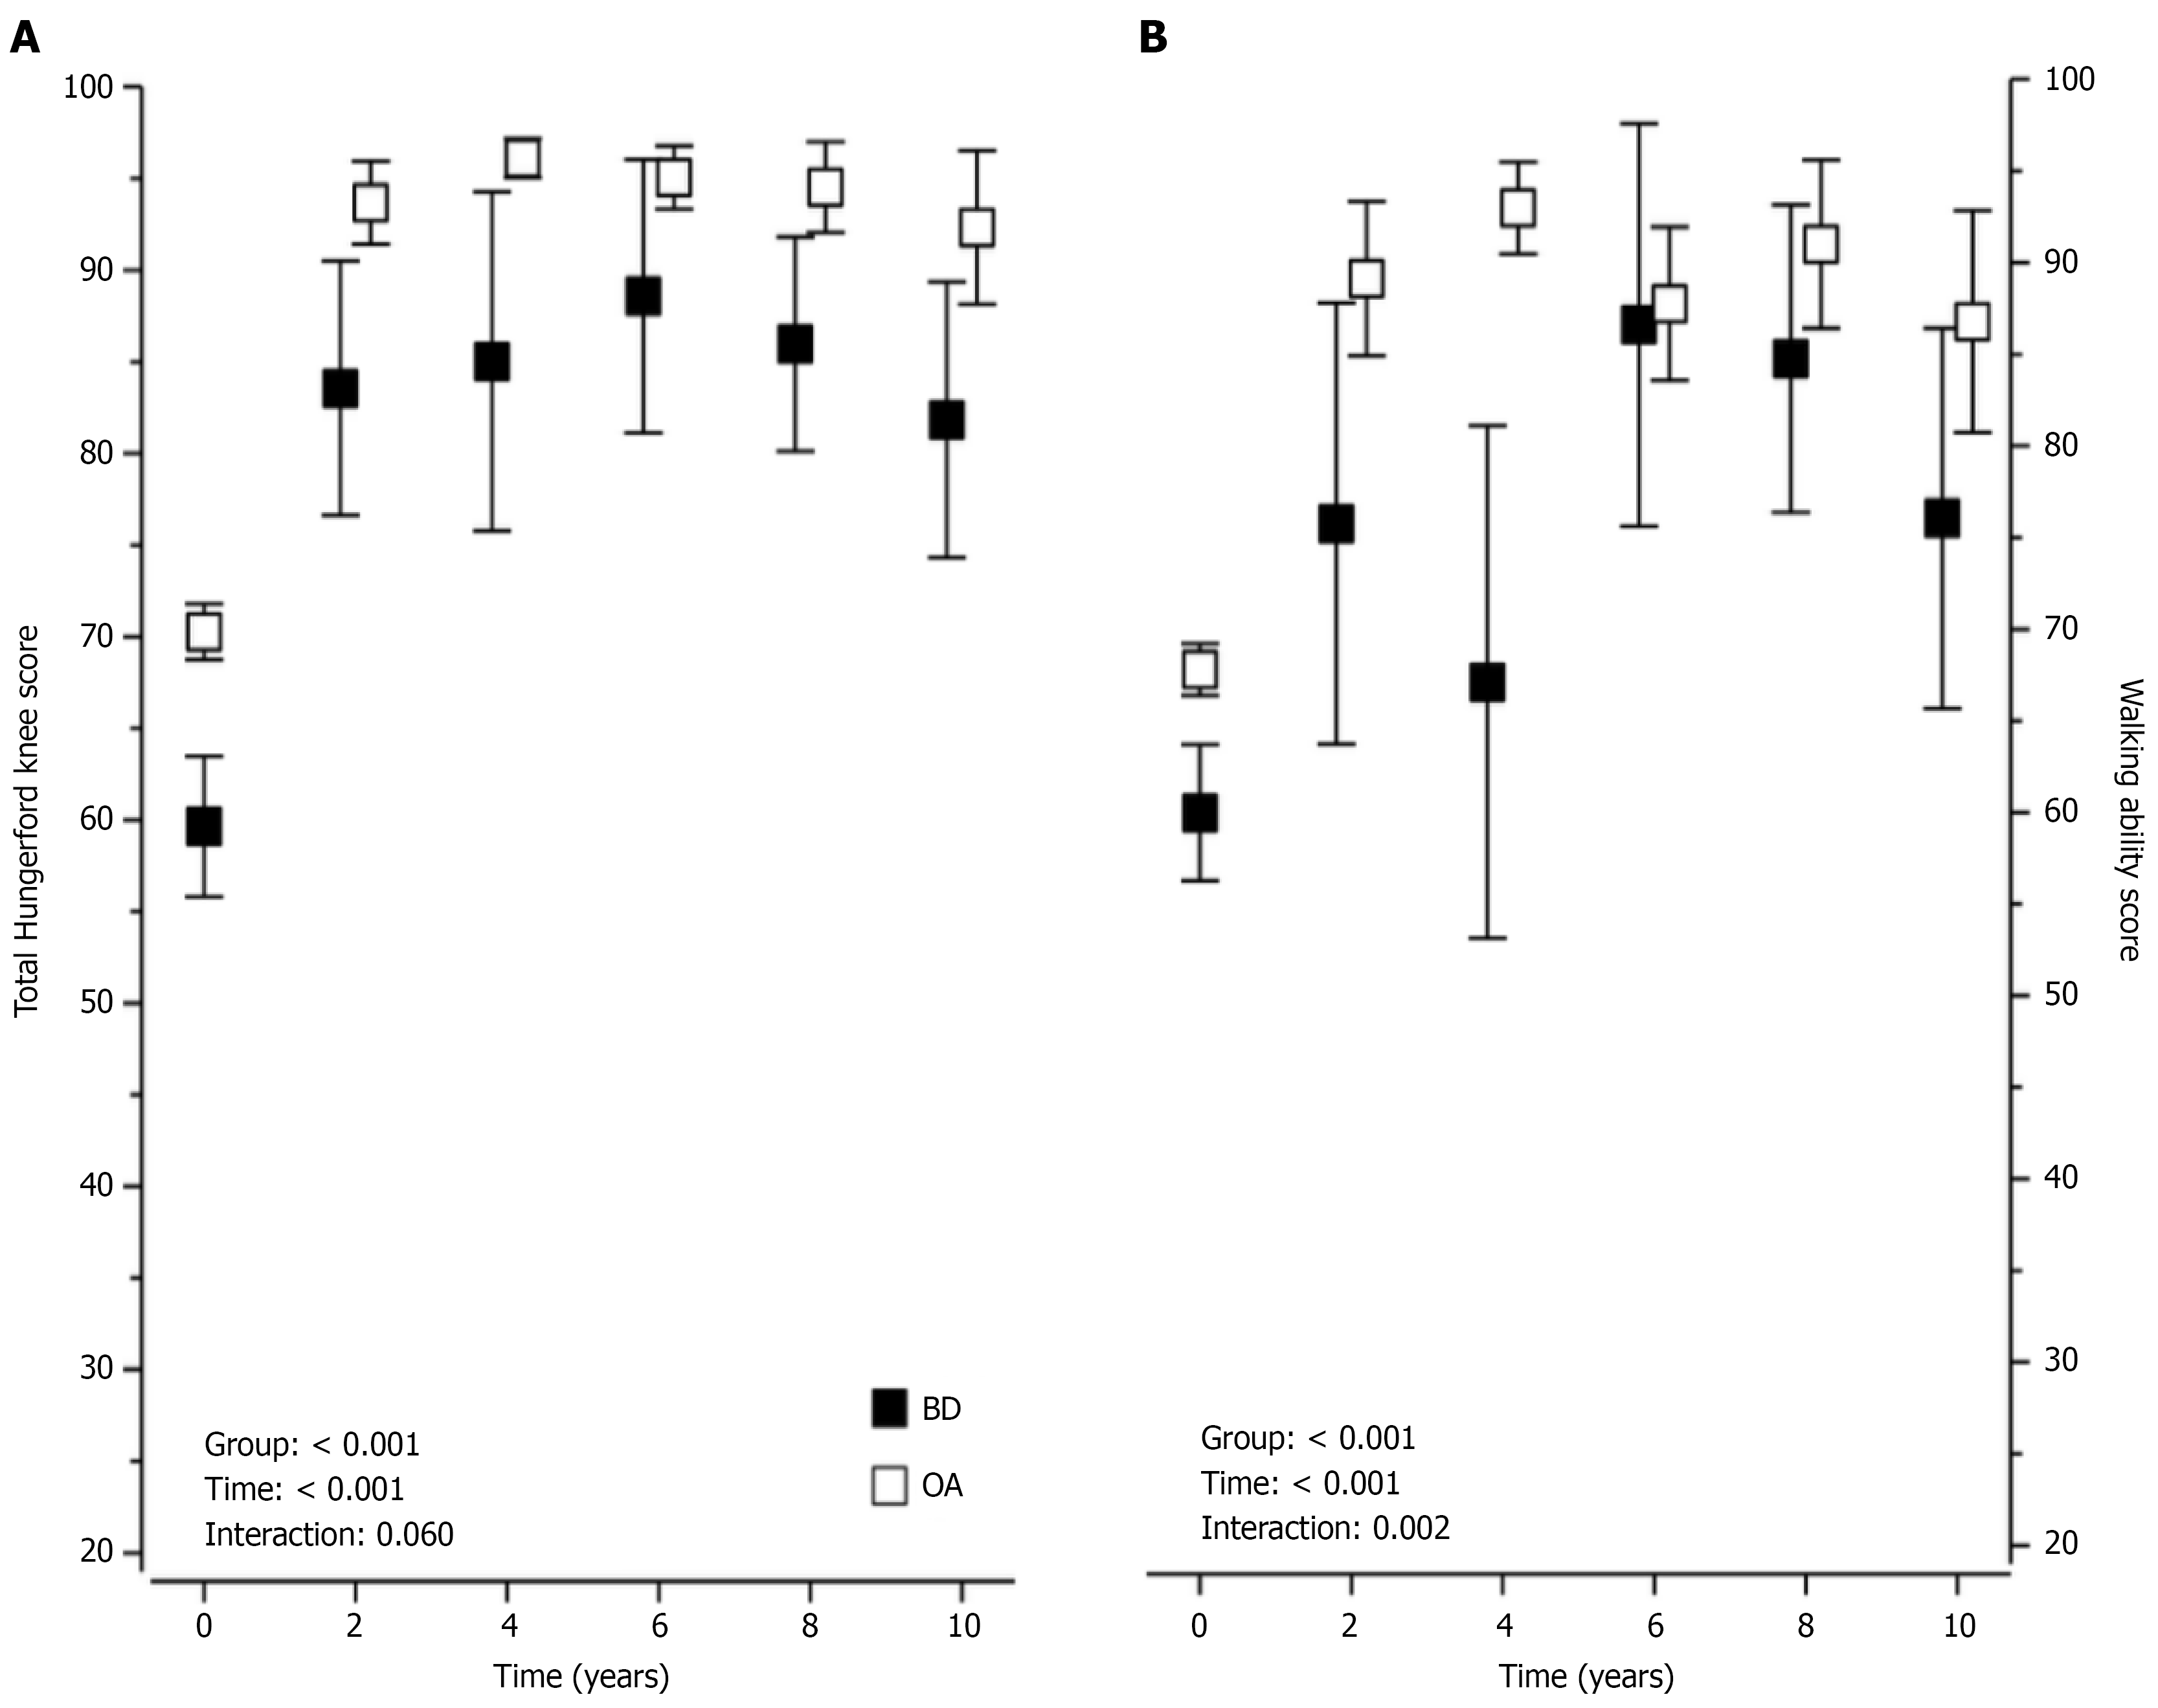
Figure 2 Functional outcomes following knee replacement.
A: Total Hungerford knee score between inherited bleeding disorder (BD) and osteoarthritis (OA) patients; B: Comparison of walking ability score between BD and OA patients. BD: Bleeding disorder; OA: Osteoarthritis.
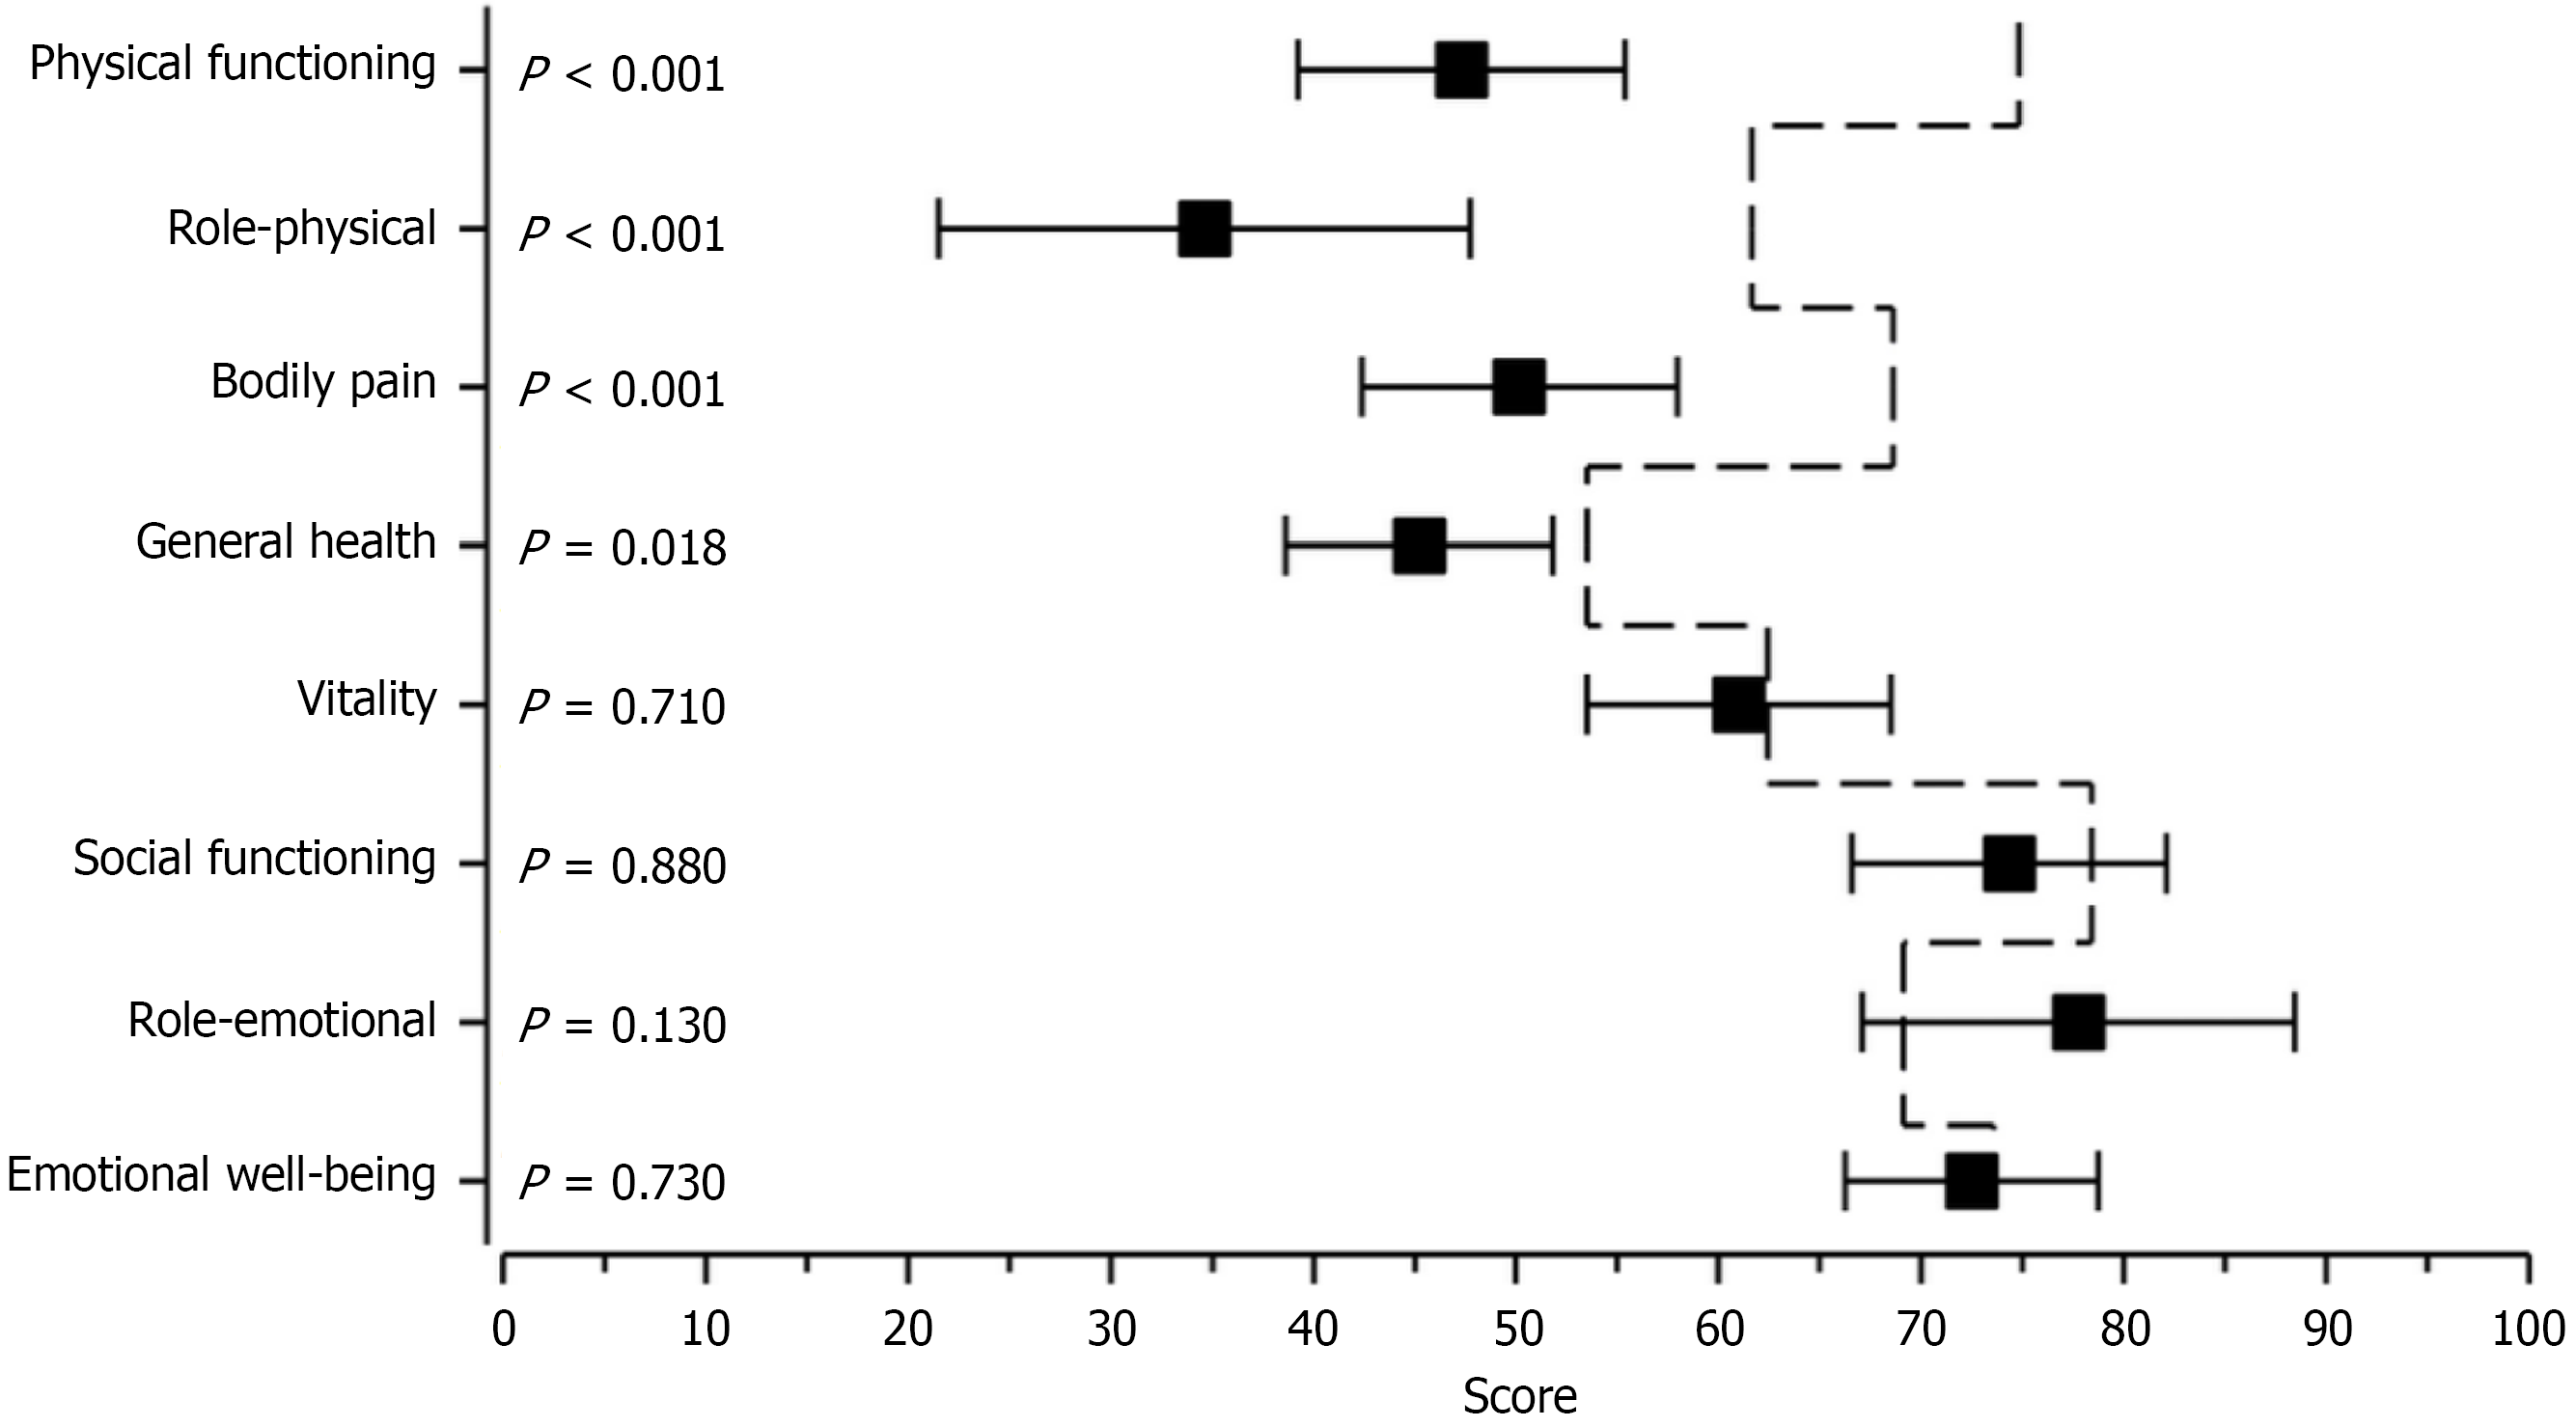
Figure 3 Health-related quality of life according to the Medical Outcomes Study 36-Item Short Form Health Survey-dimensions health survey in 39 bleeding disorder patients.
Age- and gender-matched healthy controls from the study by Aalto et al[21] are shown by the dotted line. Whiskers show 95% confidence intervals.
- Citation: Danielson H, Ylinen P, Lassila R, Ristolainen L, Lohikoski J, Kautiainen H, Yrjönen T. Long-term functional and quality-of-life outcomes after knee replacement in patients with inherited bleeding disorders: A 15-year follow-up study. World J Orthop 2026; 17(8): 123952
- URL: https://www.wjgnet.com/2218-5836/full/v17/i8/123952.htm
- DOI: https://dx.doi.org/10.5312/wjo.123952