
















Copyright: ©Author(s) 2026.
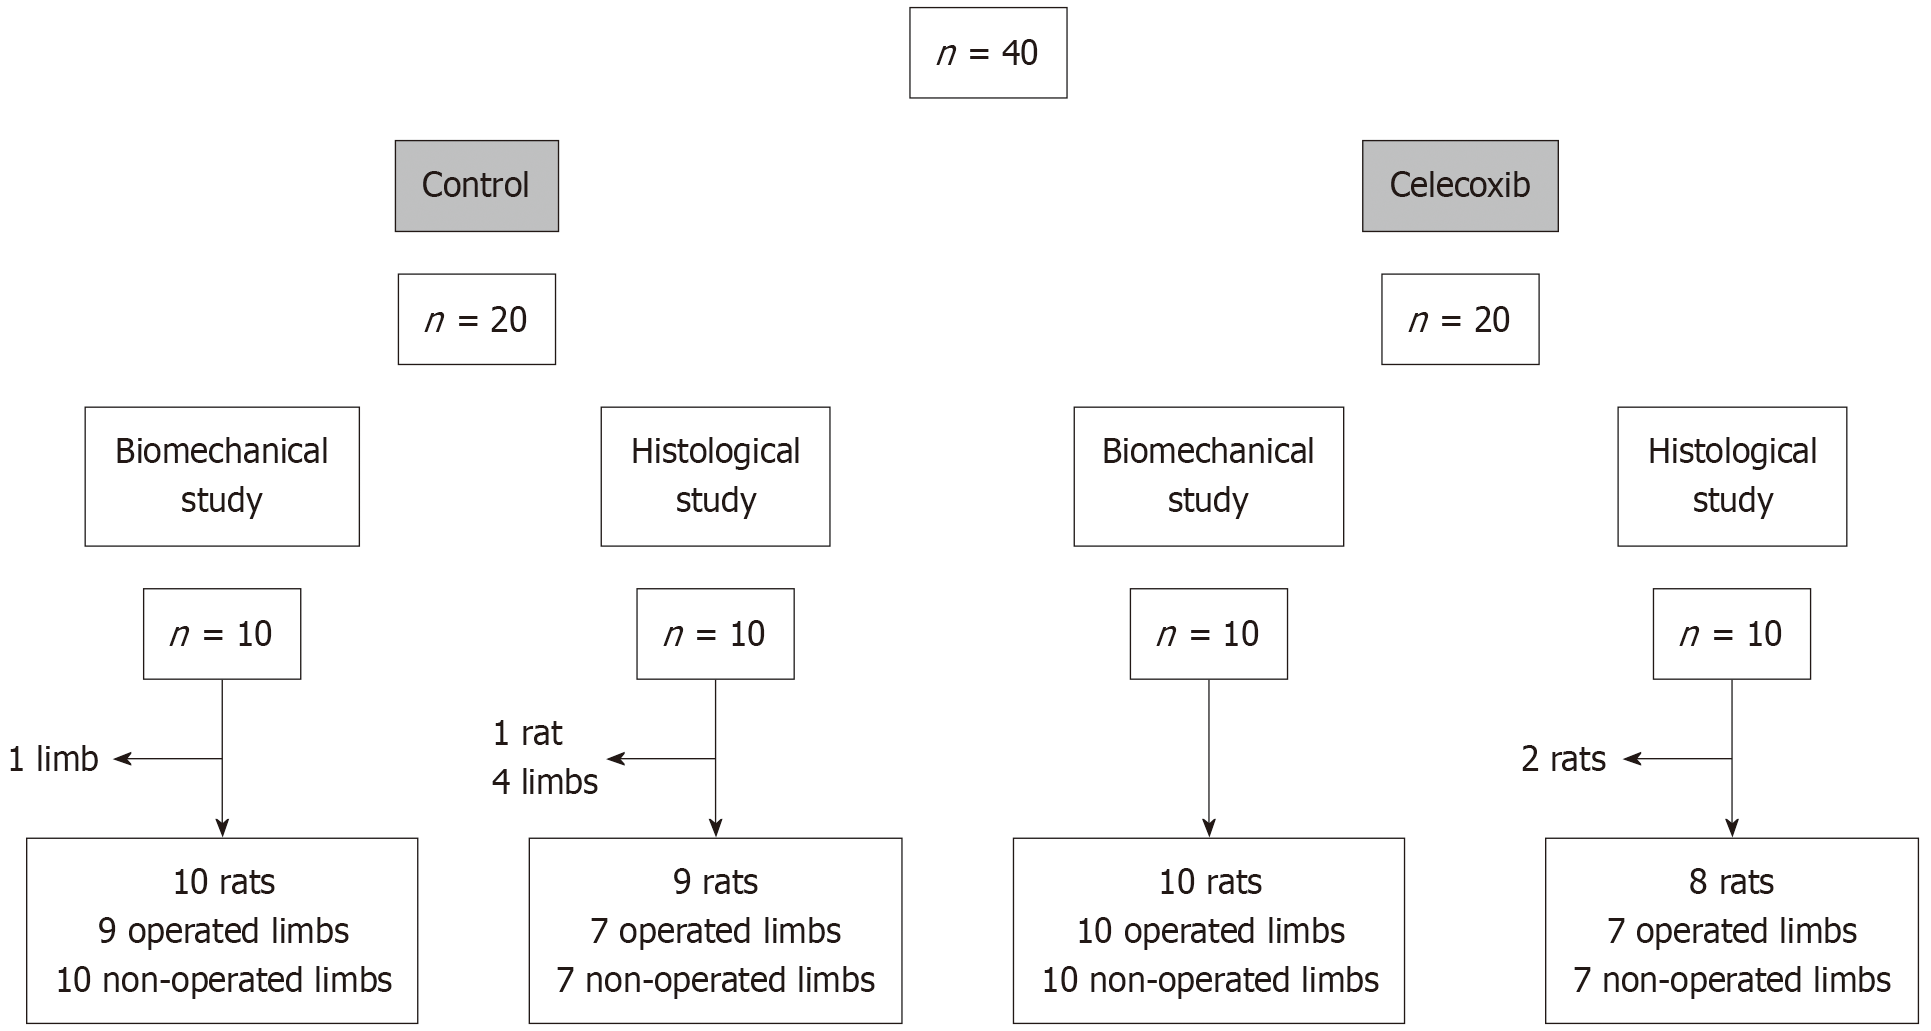
Figure 1 Flowchart showing the distribution of the initial sample, losses during follow-up and final sample by groups.
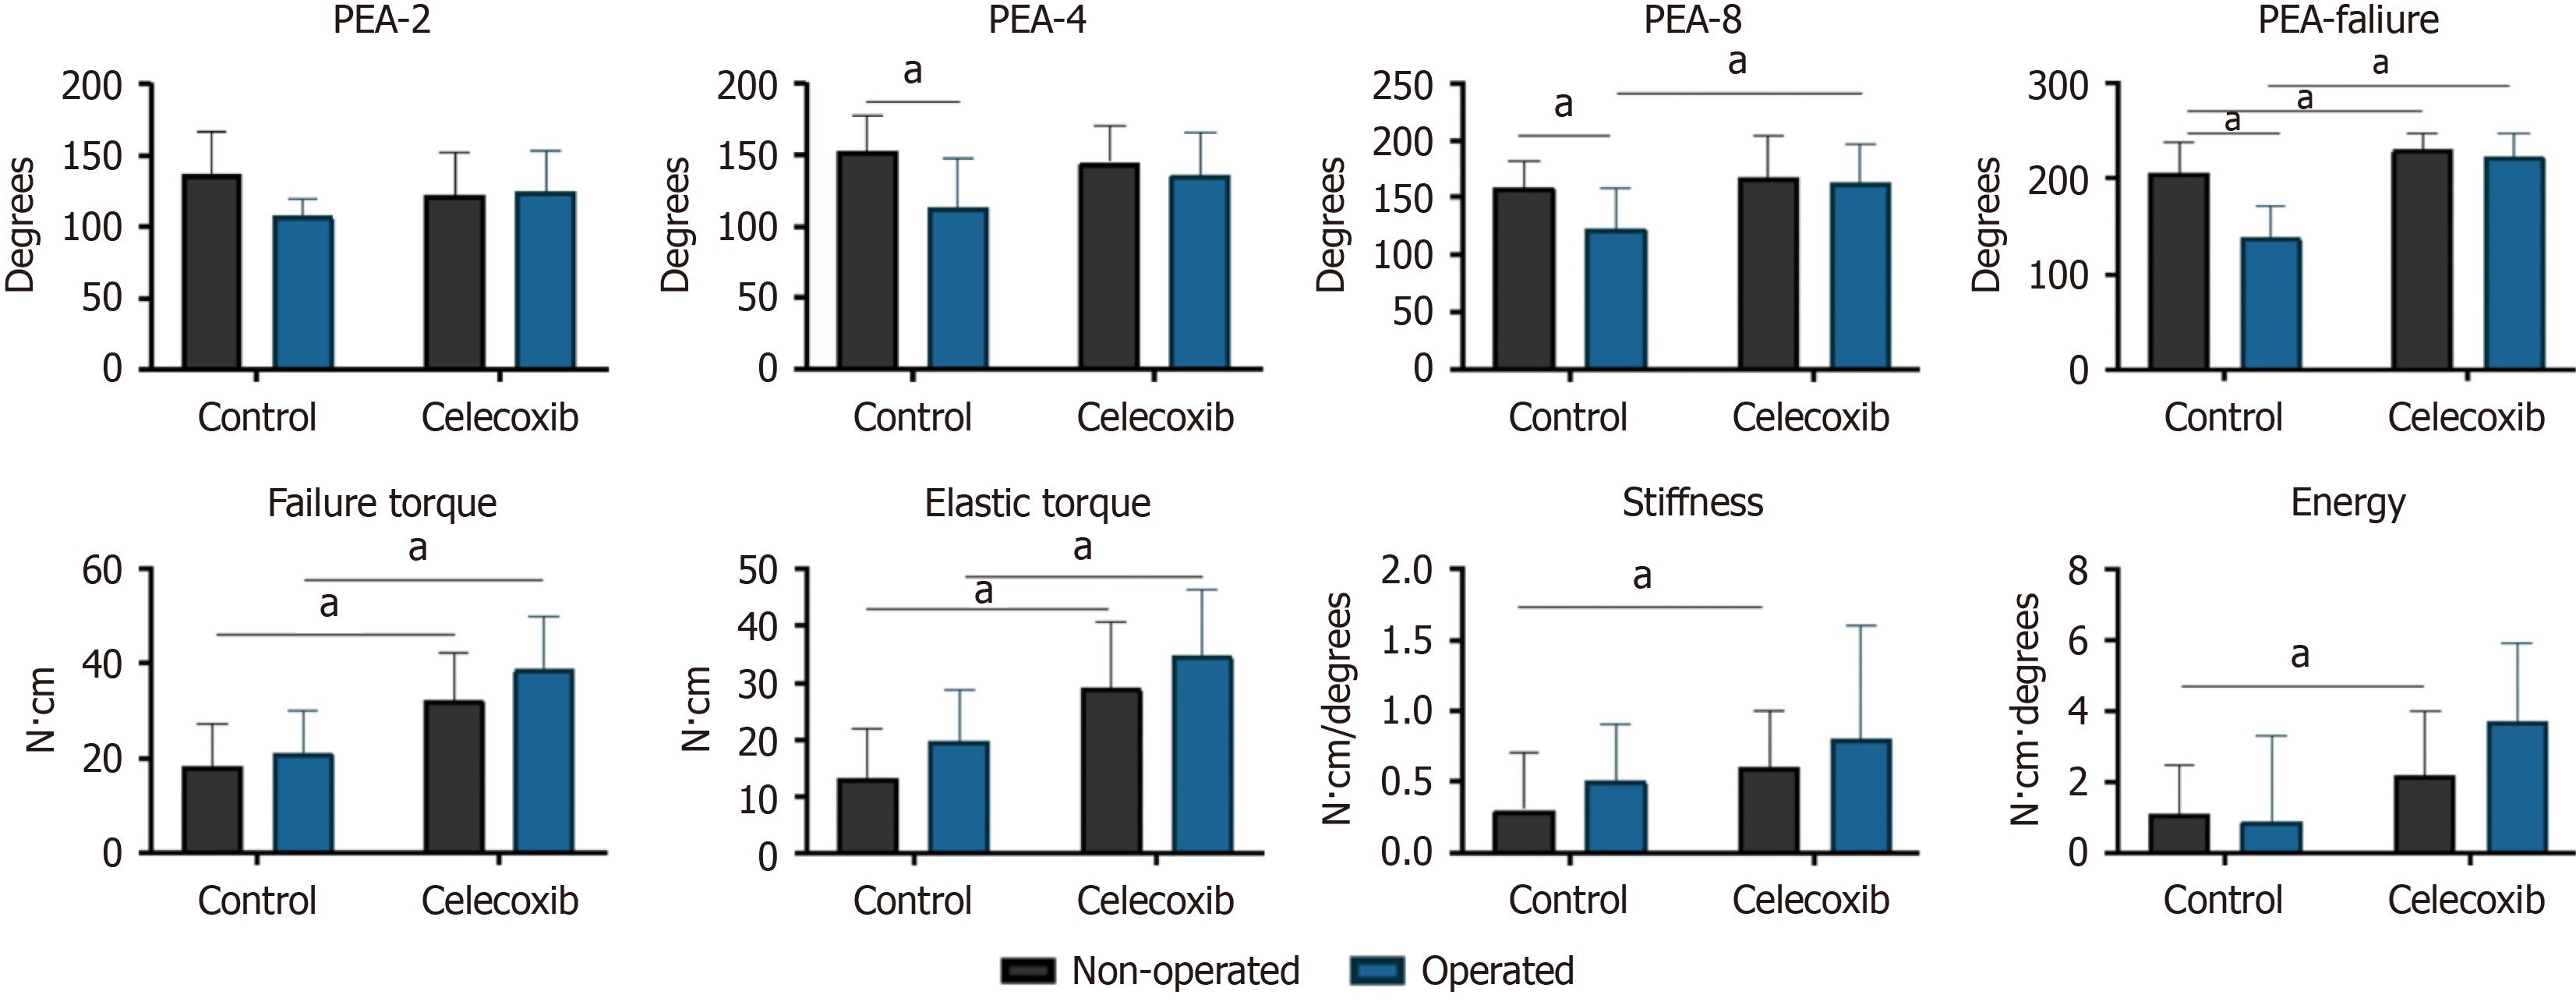
Figure 2 Grouped bar chart of biomechanical outcomes by groups.
aP < 0.05. PEA: Passive extension angle.
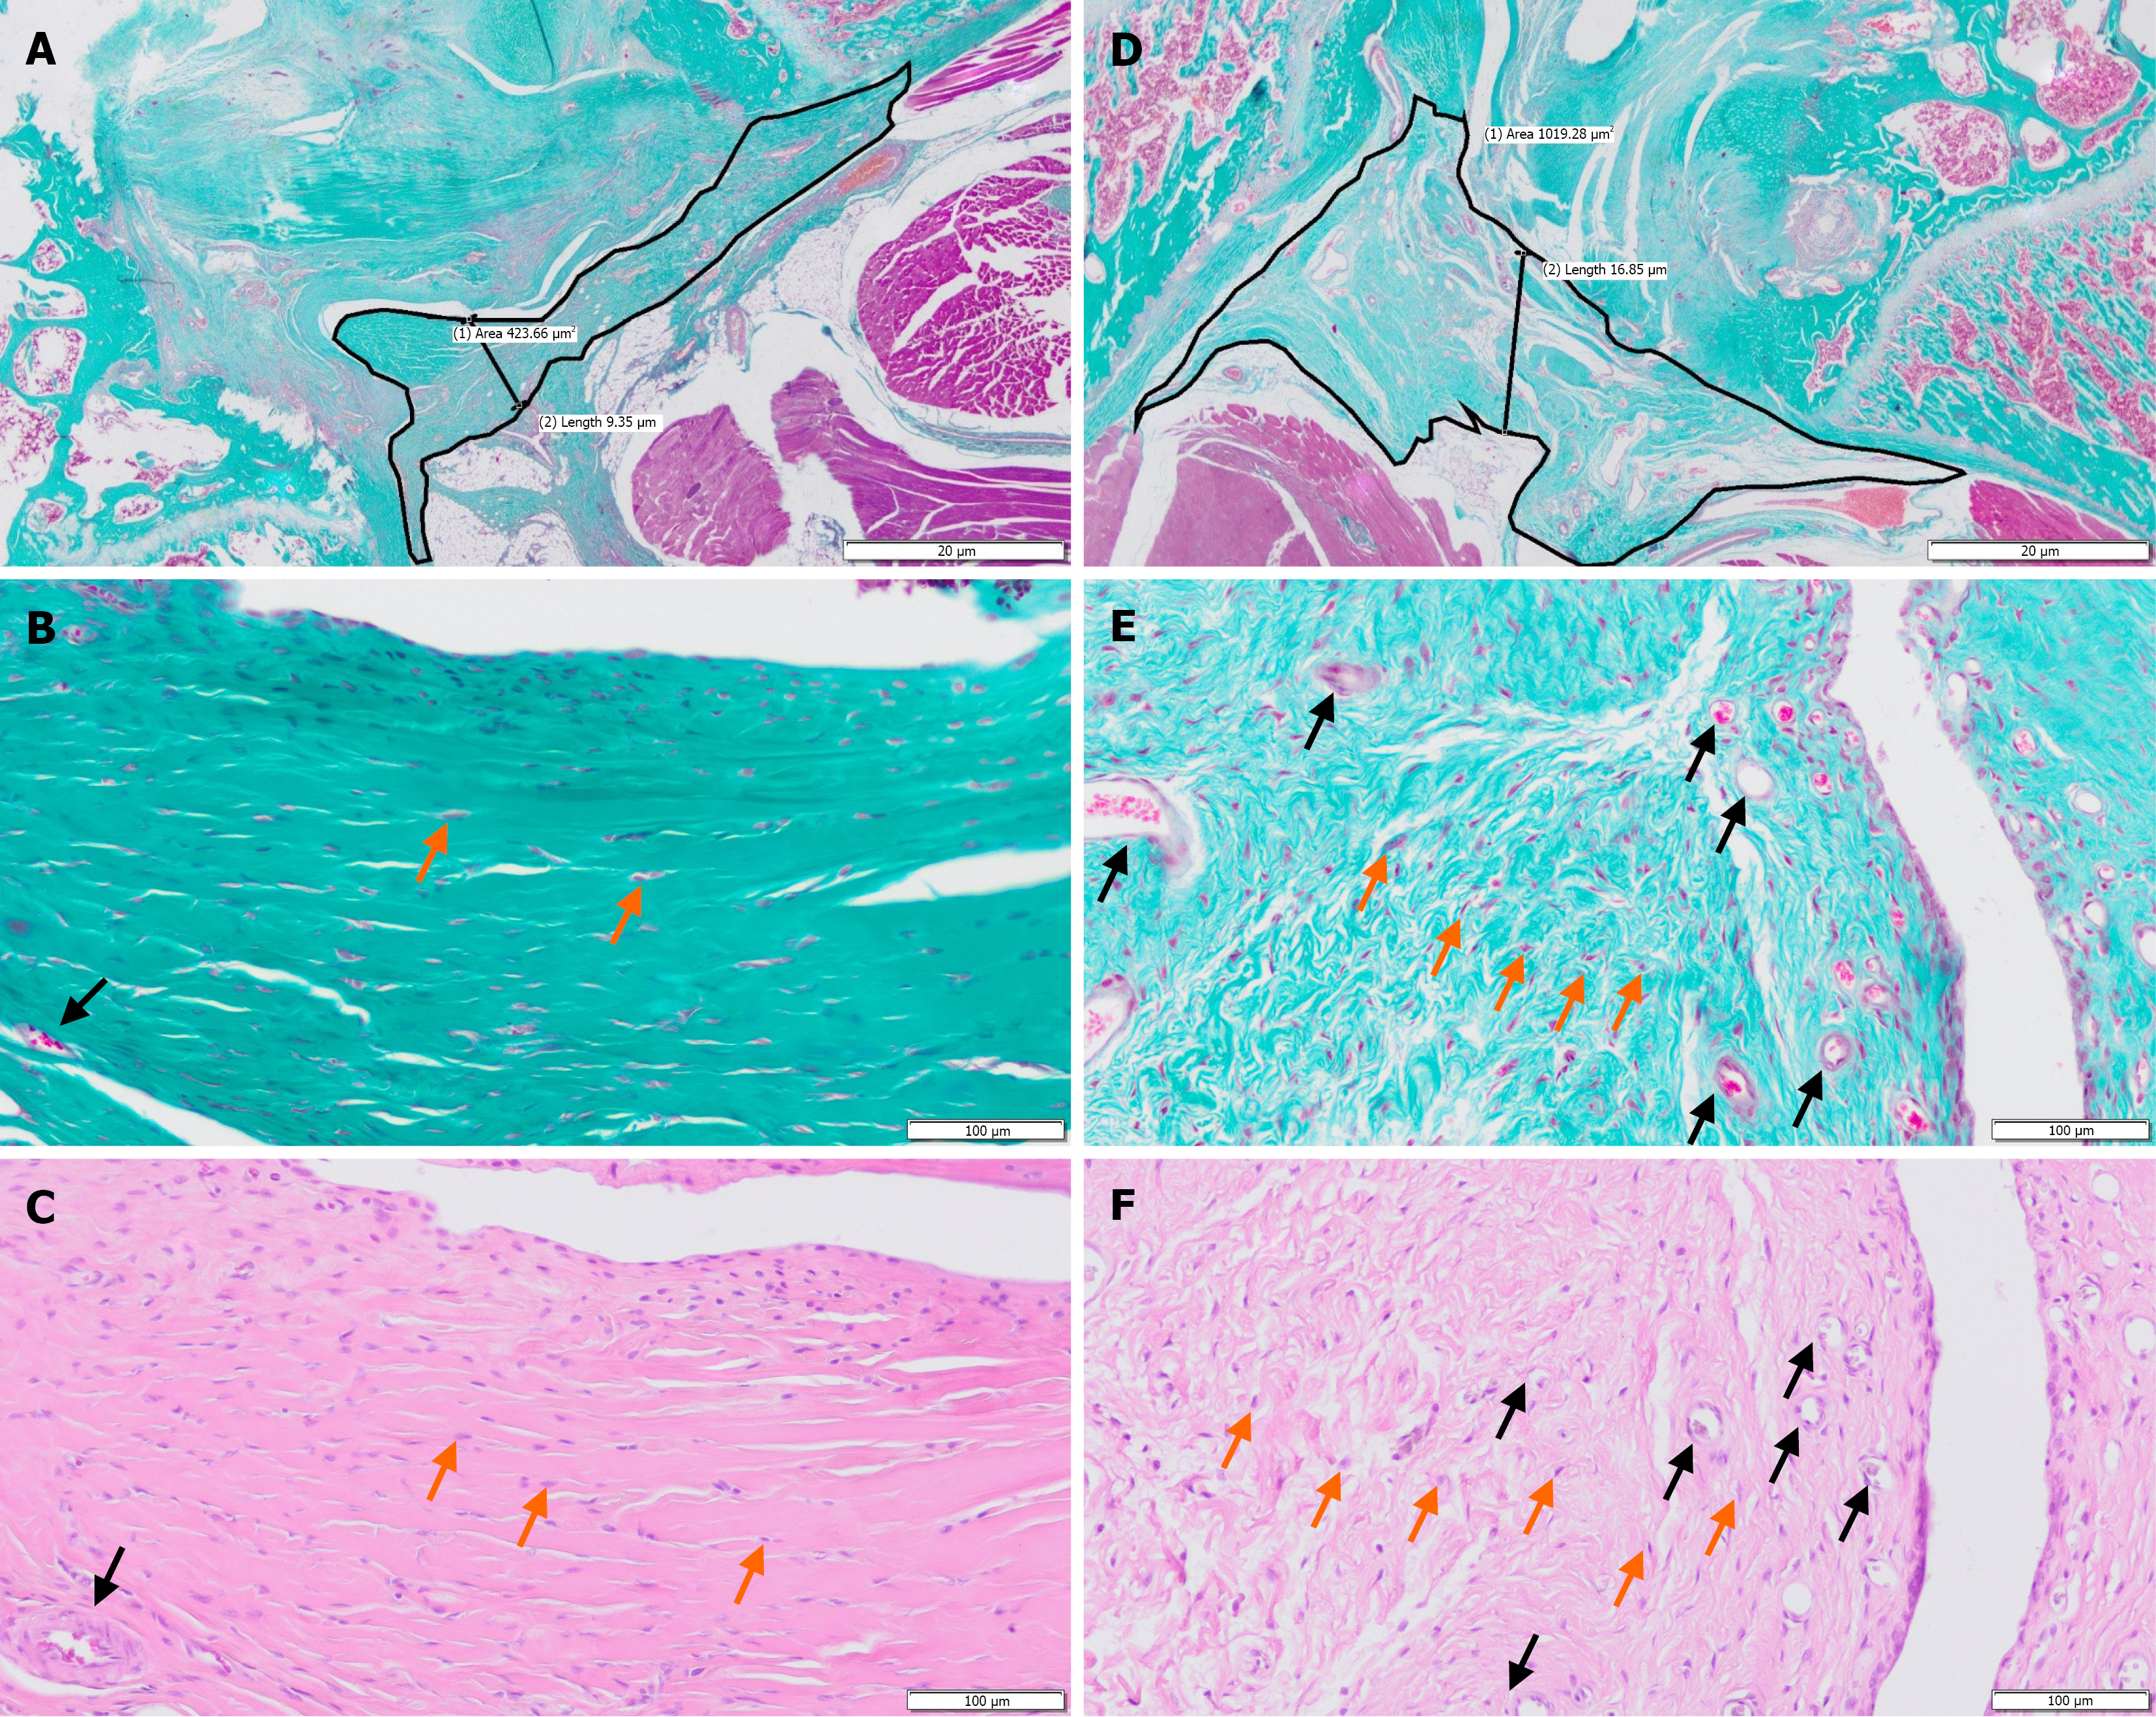
Figure 3 Histological evaluation of celecoxib efficacy in central sections of operated knees.
A-C: Control; D-F: Celecoxib-treated specimens. Panels are arranged by staining and magnification to facilitate direct comparison between control (A-C) and celecoxib-treated specimens (D-F). Masson’s trichrome-stained sections at 2× magnification (A and D) were used for quantitative assessment of posterior capsule area and thickness. Higher magnification images at 20× (B and E: Masson’s trichrome; C and F: Hematoxylin-eosin) illustrate representative fibrotic tissue. Asterisks indicate collagen-rich fibrotic areas. Orange arrows indicate fibroblast nuclei (elongated cells) and black arrows indicate blood vessels or capillaries. Celecoxib-treated posterior capsules exhibited a greater overall extent of fibrotic tissue (i.e., larger area of connective tissue involvement), along with increased cellular density and vascularity. In contrast, control specimens demonstrated a more limited fibrotic area, but with relatively denser collagen organization and lower cellular and vascular components. These findings were consistent with semiquantitative analyses (P < 0.05).
- Citation: Palacios-Díaz L, Diez Sánchez B, González-García Á, Pena-Burgos EM, Pozo-Kreilinger JJ, Carrascal-Morillo MT, Bustos A, Sanchez-Urgelles P, Antuña S, Barco R. Early oral celecoxib prevents contracture and modulates capsular fibrosis in a validated model of post-traumatic arthrofibrosis. World J Orthop 2026; 17(7): 121157
- URL: https://www.wjgnet.com/2218-5836/full/v17/i7/121157.htm
- DOI: https://dx.doi.org/10.5312/wjo.121157