
















Copyright: ©Author(s) 2026.
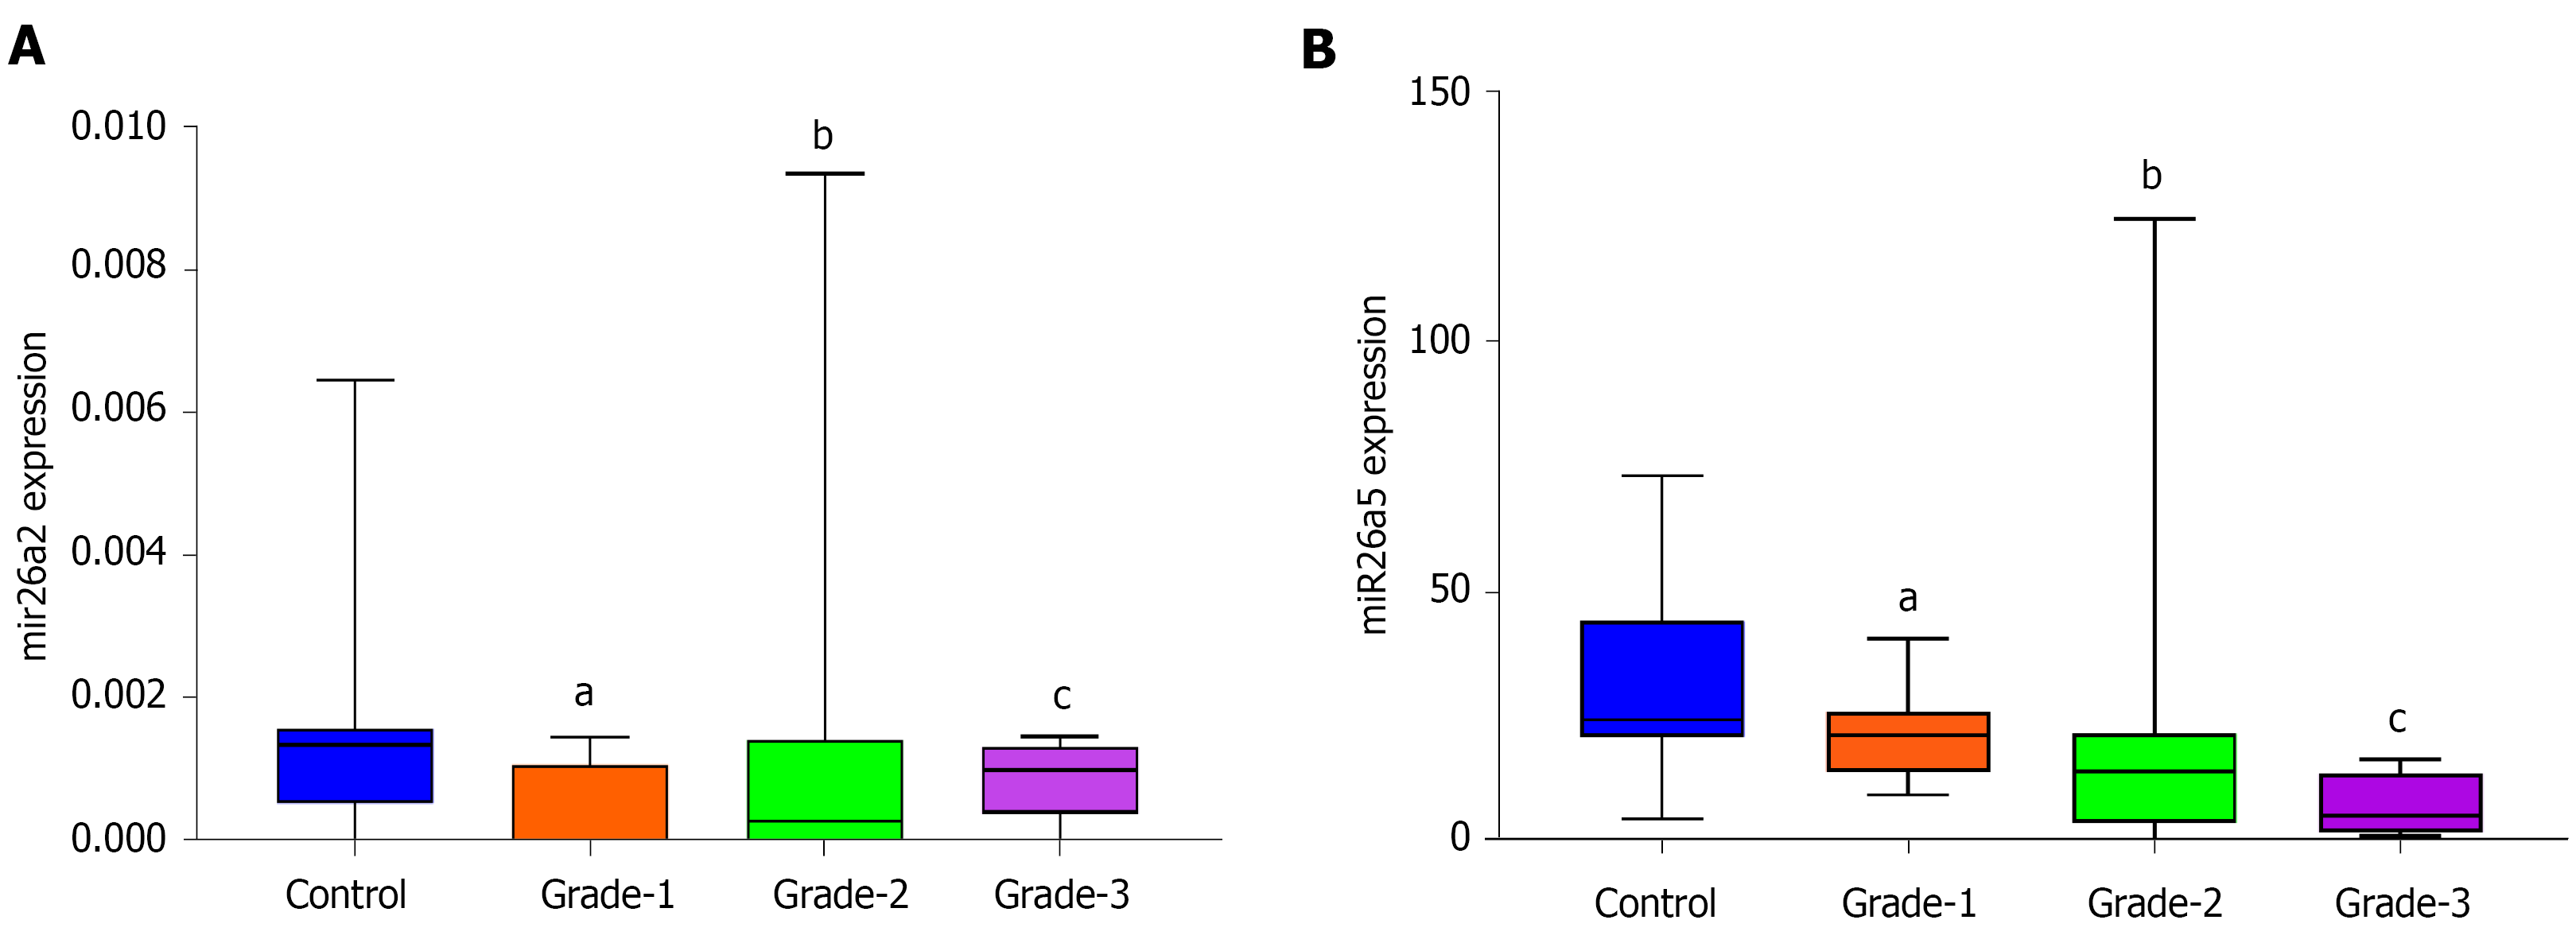
Figure 1 Comparison of serum between study groups.
A: Comparison of serum miRNA-26a-2-3p fold change levels between study groups. Control (n = 50); grade 1 (n = 16); grade 2 (n = 22); and grade 3 (n = 12) (t test was insignificant at P > 0.05); B: Comparison of serum miRNA-26a5 fold change levels between study groups. Control (n = 50); grade 1 (n = 16); grade 2 (n = 22) and grade 3 (n = 12). t test was significant at aP ≤ 0.05, bP < 0.01 and cP < 0.001.
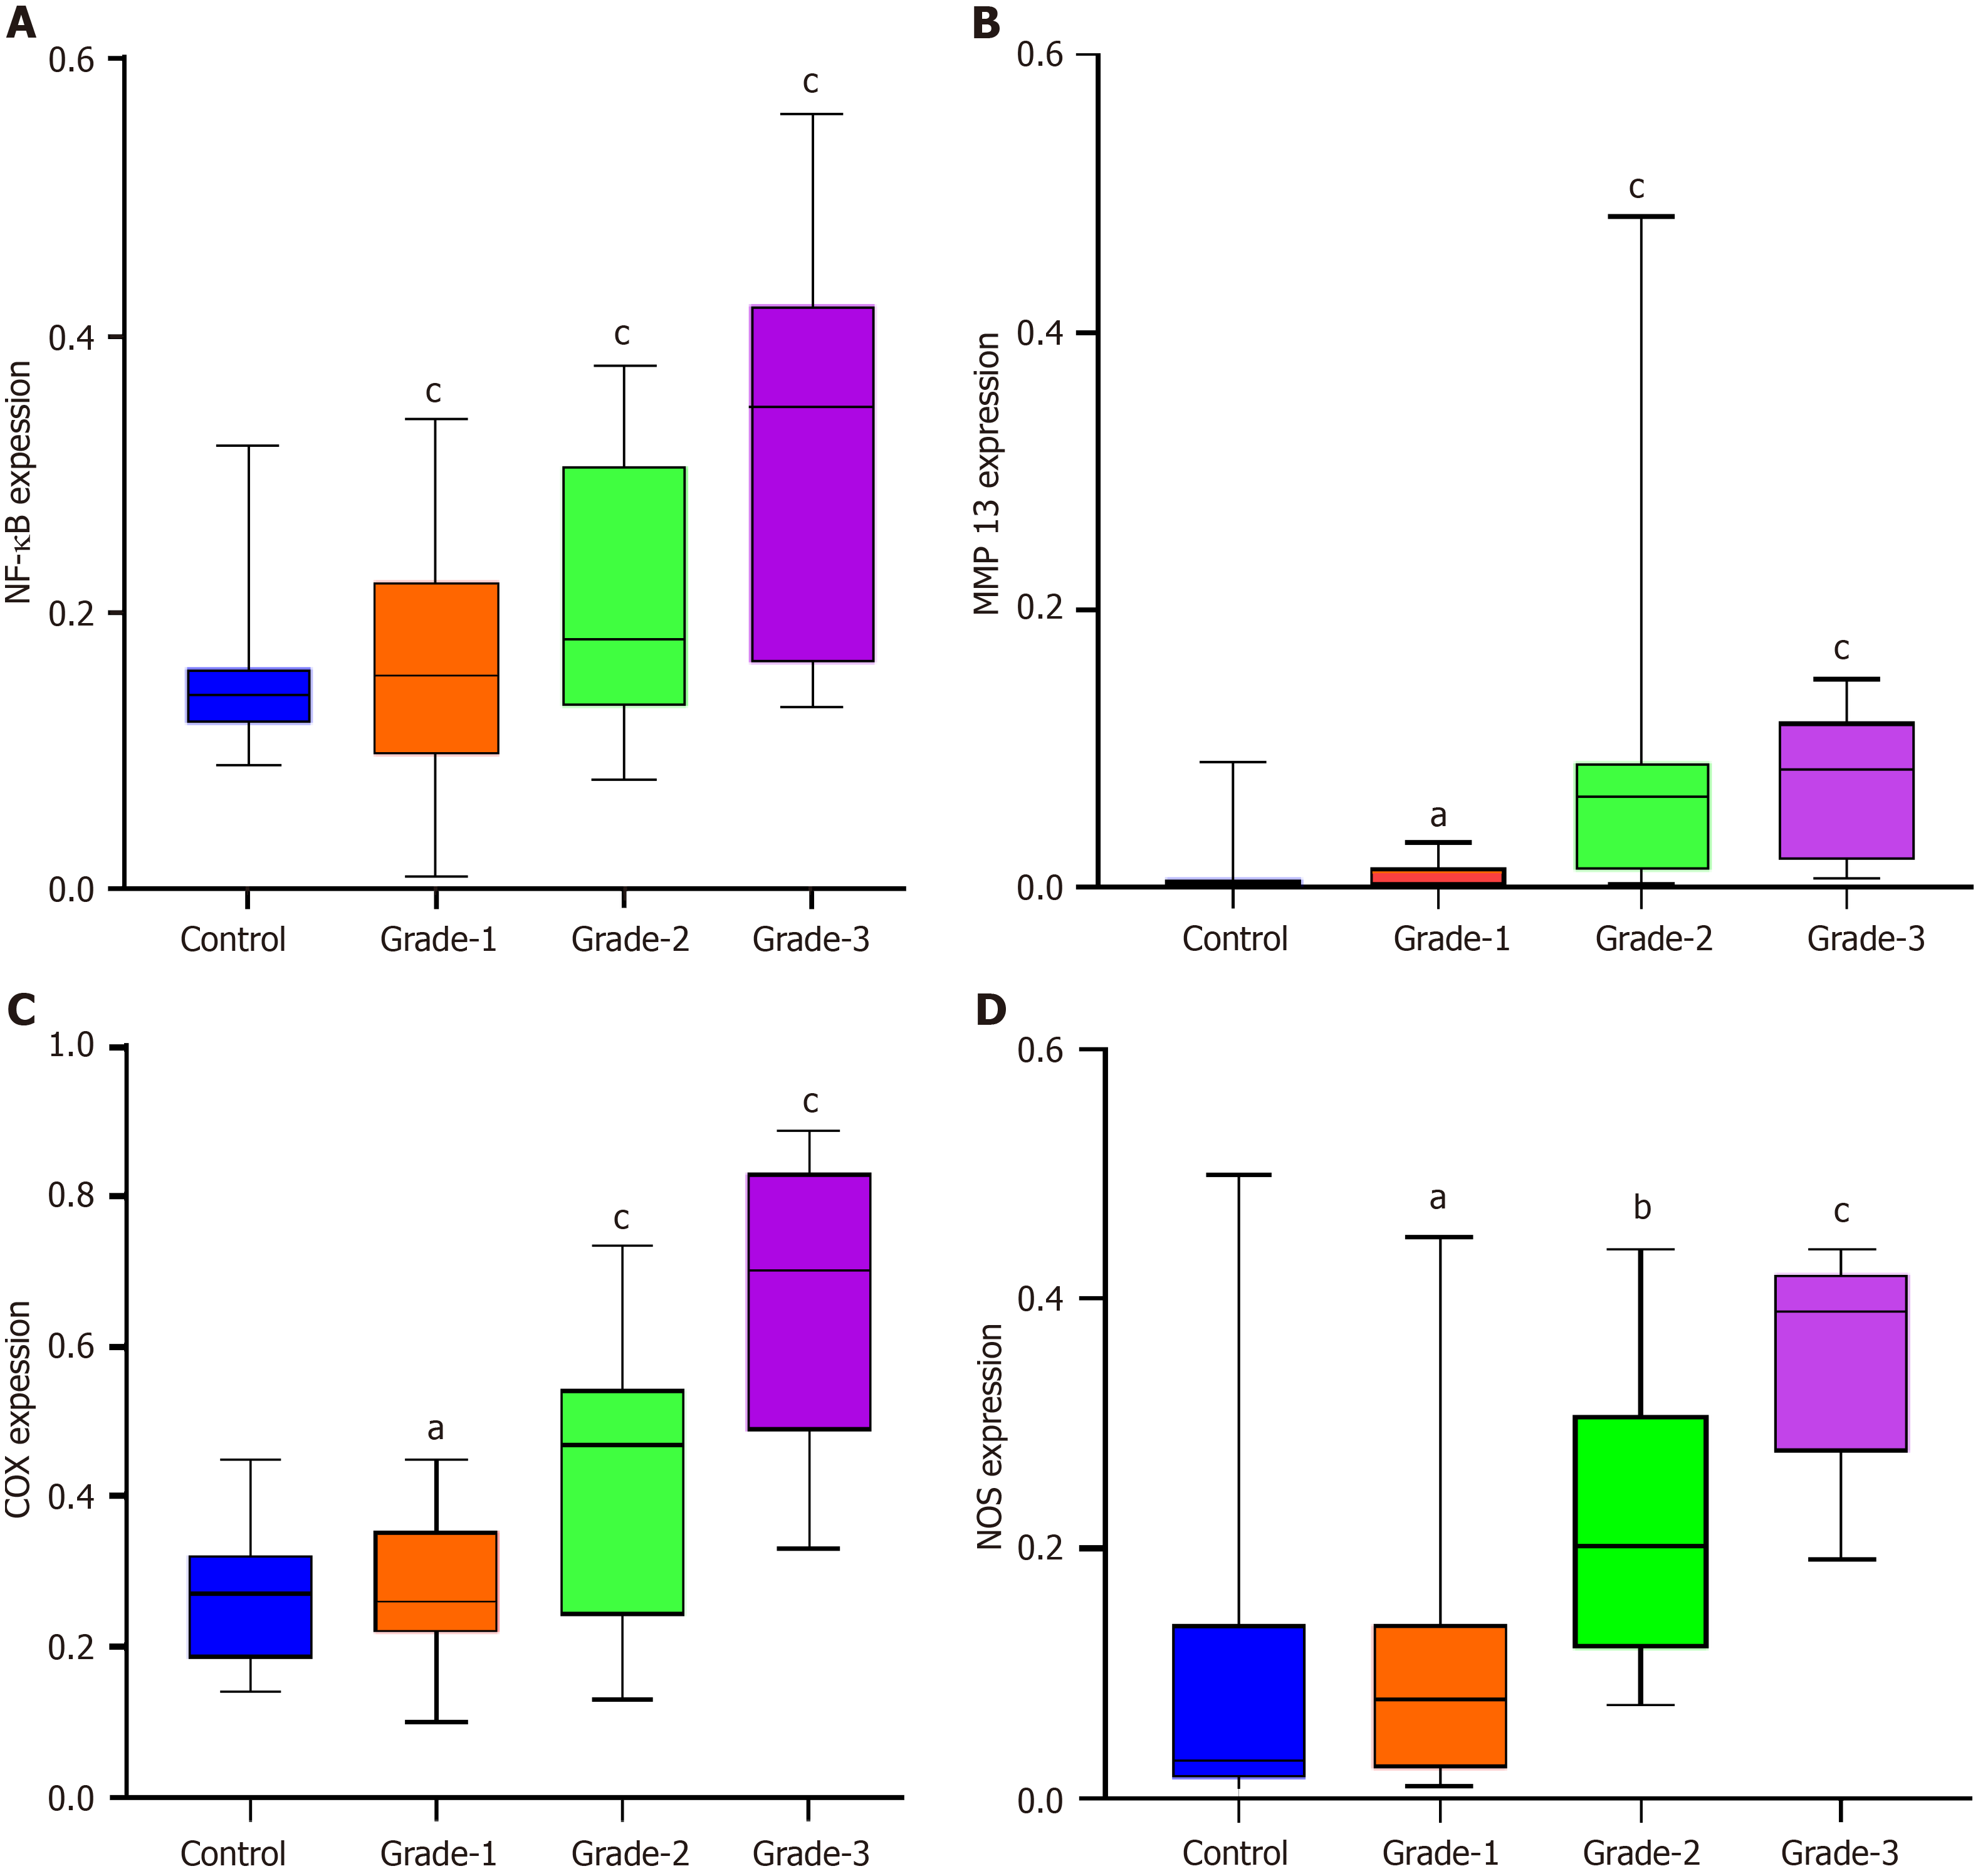
Figure 2 MiRNA-26a2 and 26a5 influencing the osteoarthritis genes in study groups.
A: NF-κB expression; B: MMP 13 expression; C: COX expression; D: NOS expression. Control (n = 50); grade 1 (n = 16); grade 2 (n = 22); and grade 3 (n = 12) t test was significant at aP ≤ 0.05, bP < 0.01 and cP < 0.001.
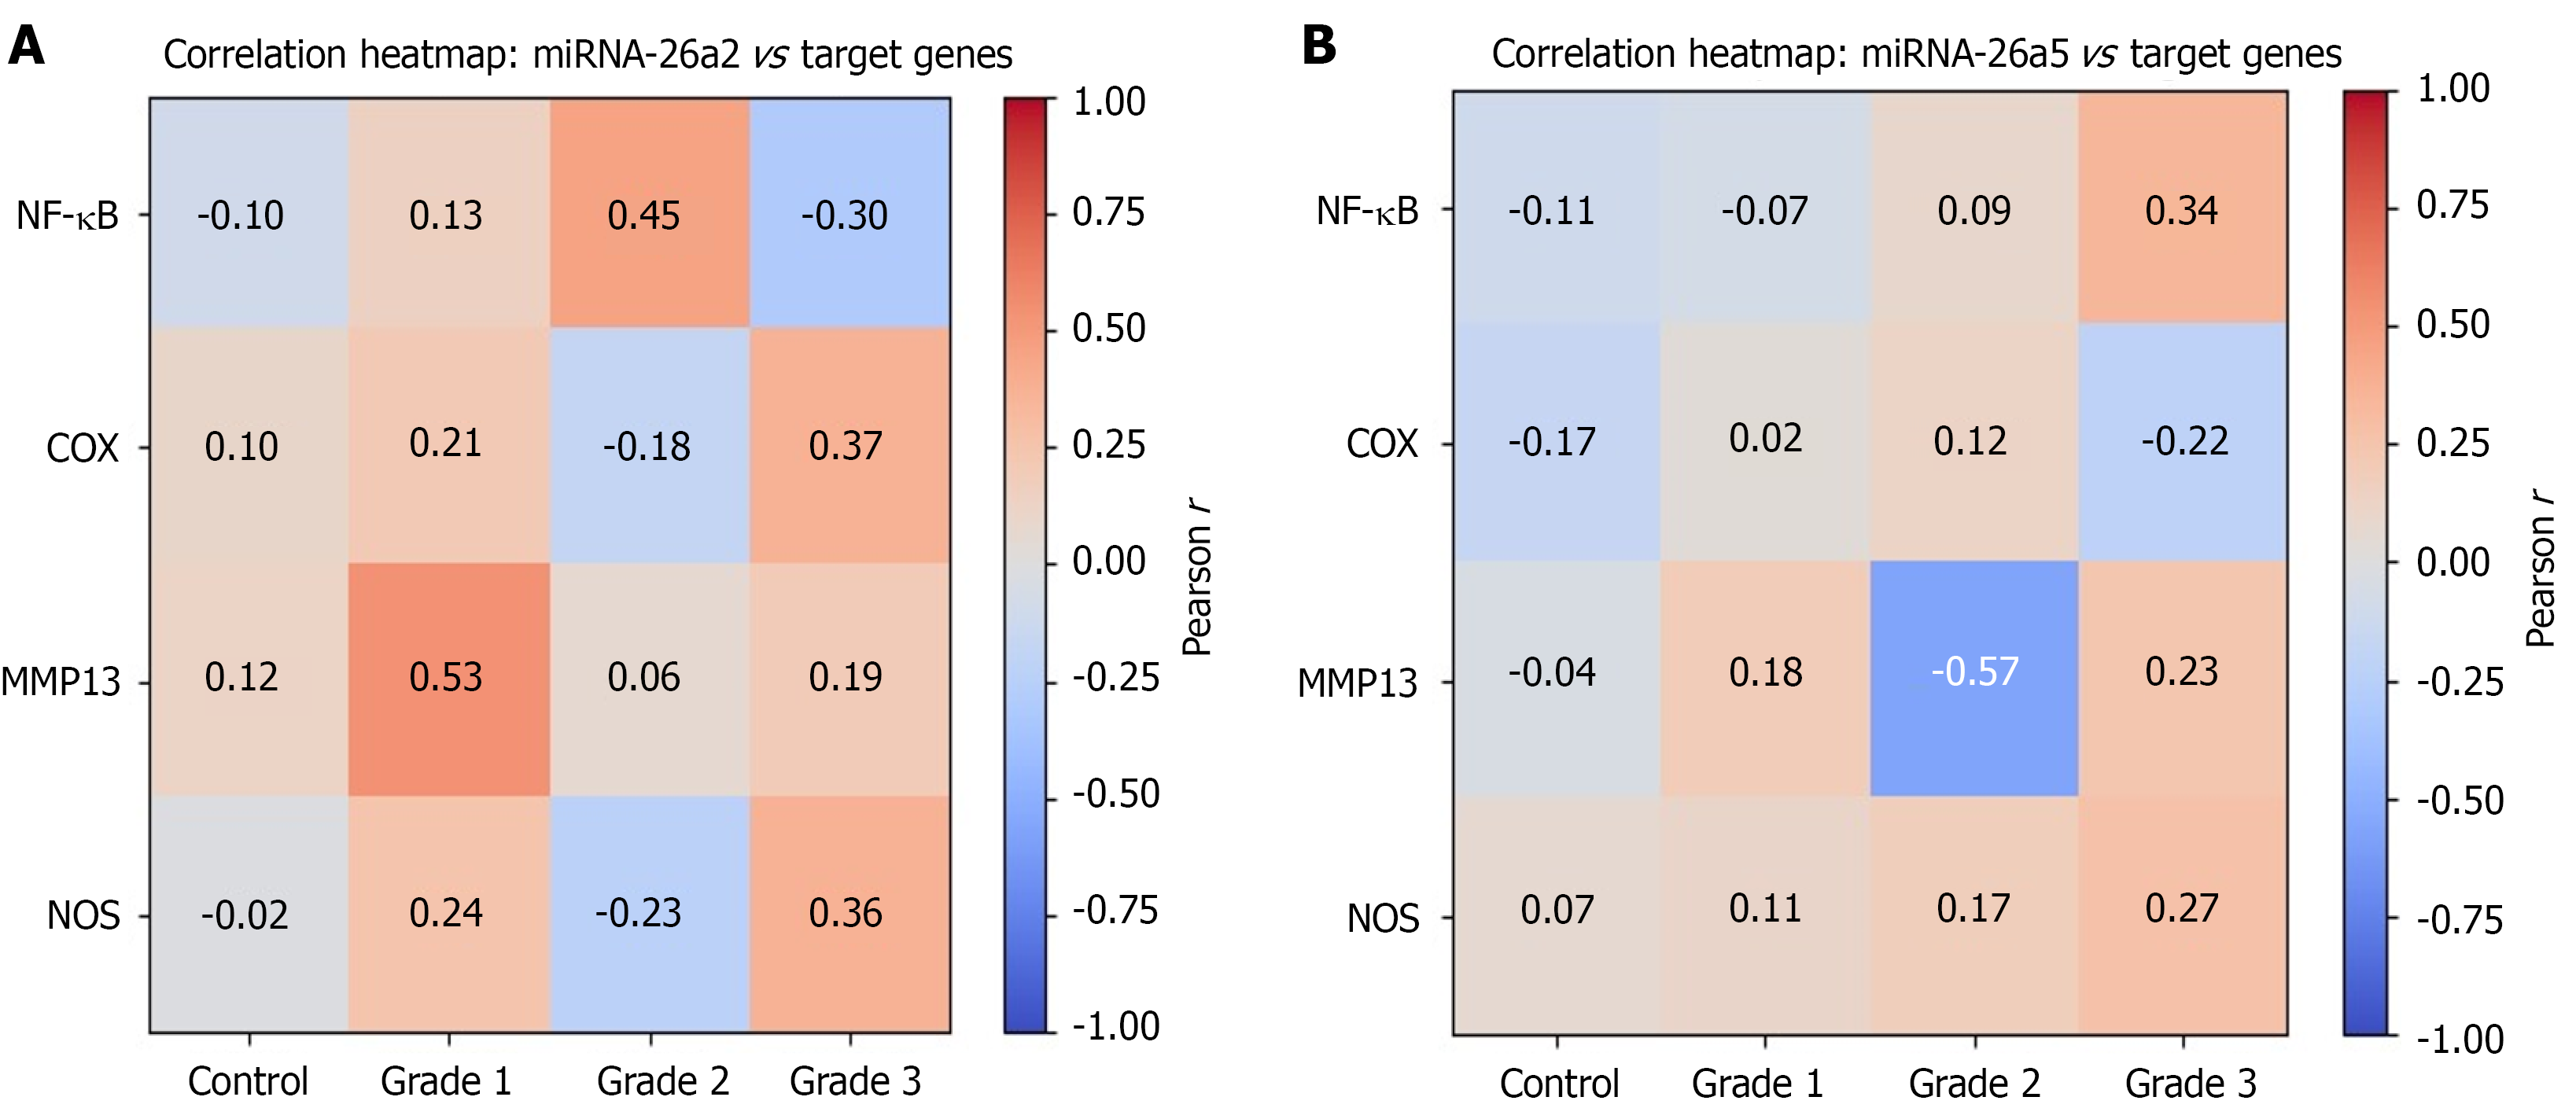
Figure 3 Correlation heat map of 26a2 and 26a5 vs target genes.
A: 26a2; B: 26a5. Heat map depicting the Pearson correlation coefficients between miRNA-26a2 and 26a5 and their target genes (NF-κB, Cox, MMP13, and NOS) among different grades of osteoarthritis individuals: The scale on the right-hand side indicates the correlation coefficient values. Values closer to ± 1 show stronger correlations, while values near 0 imply a weak or non-linear relationship. Red shades denote positive correlations. Blue shades denote negative correlations.
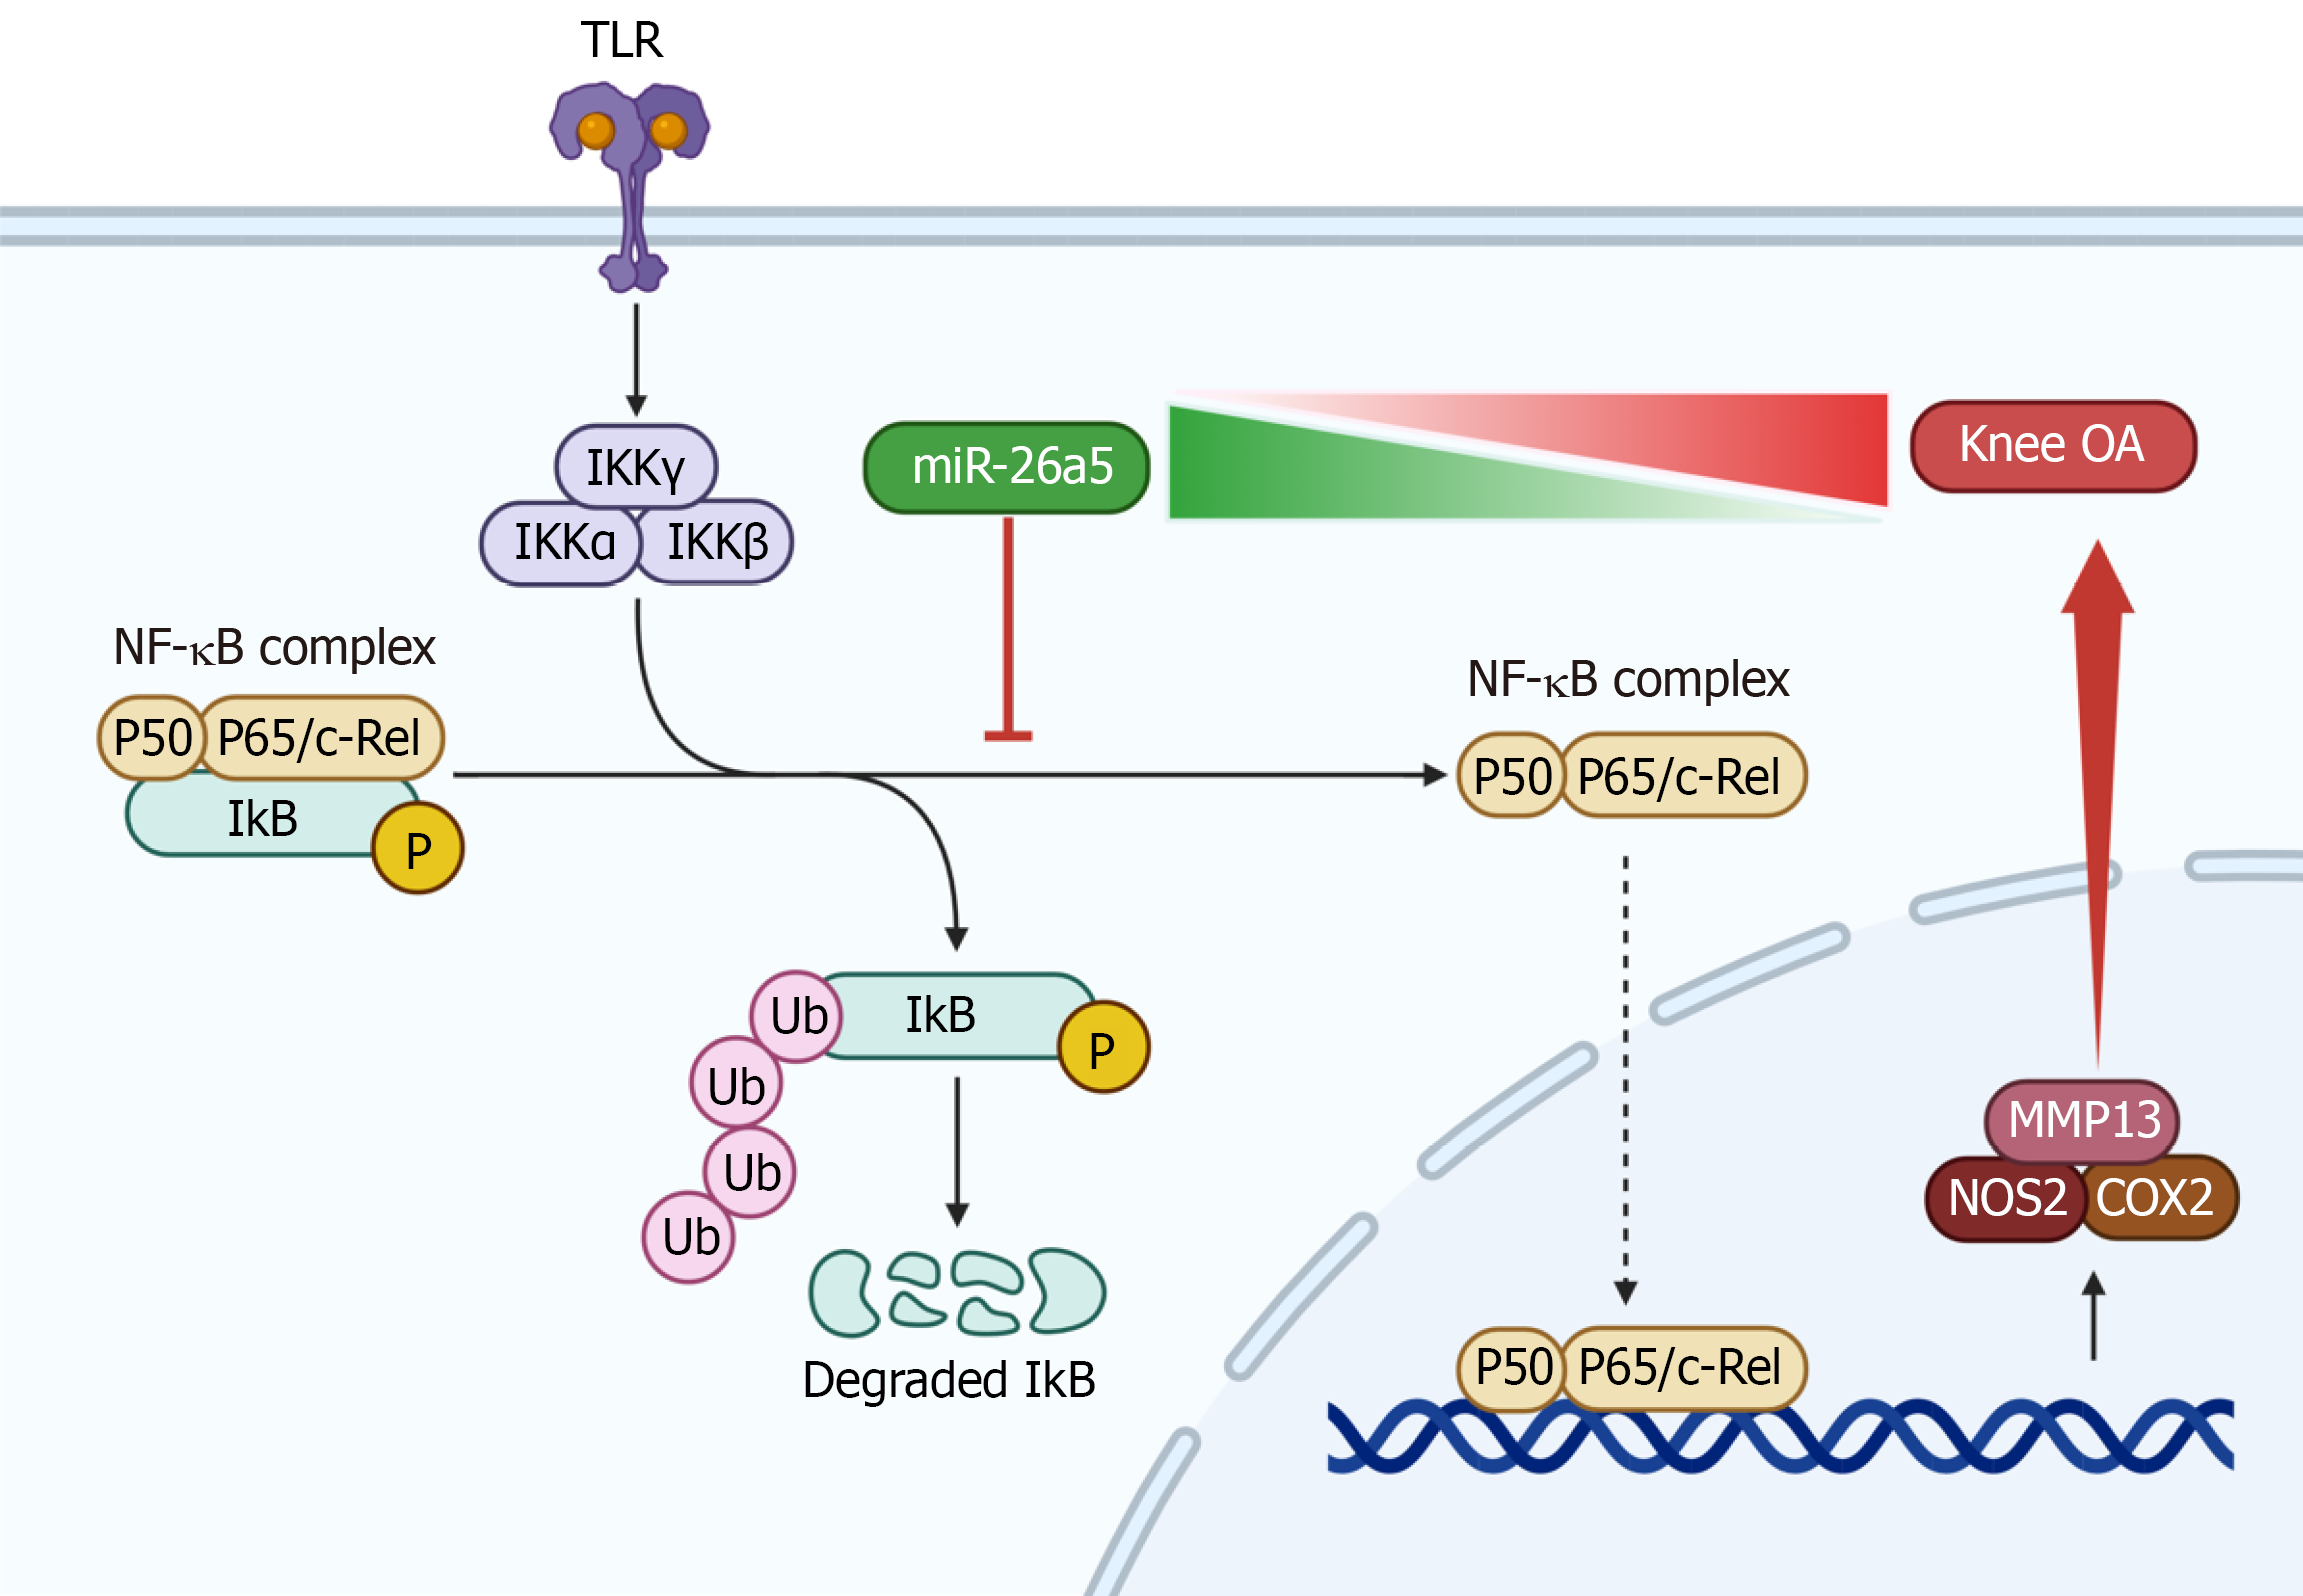
Figure 4 Schematic representation of miR-26a5 in knee osteoarthritis.
OA: Osteoarthritis.
- Citation: Gunamala V, Hari R, Jeyaraman N, Nallakumarasamy A, Muthu S, Jeyaraman M. MiR 26a as a stage-dependent biomarker and therapeutic regulator of inflammation in knee osteoarthritis. World J Orthop 2026; 17(7): 120195
- URL: https://www.wjgnet.com/2218-5836/full/v17/i7/120195.htm
- DOI: https://dx.doi.org/10.5312/wjo.120195