
















Copyright: ©Author(s) 2026.
World J Orthop. May 18, 2026; 17(5): 118547
Published online May 18, 2026. doi: 10.5312/wjo.v17.i5.118547
Published online May 18, 2026. doi: 10.5312/wjo.v17.i5.118547
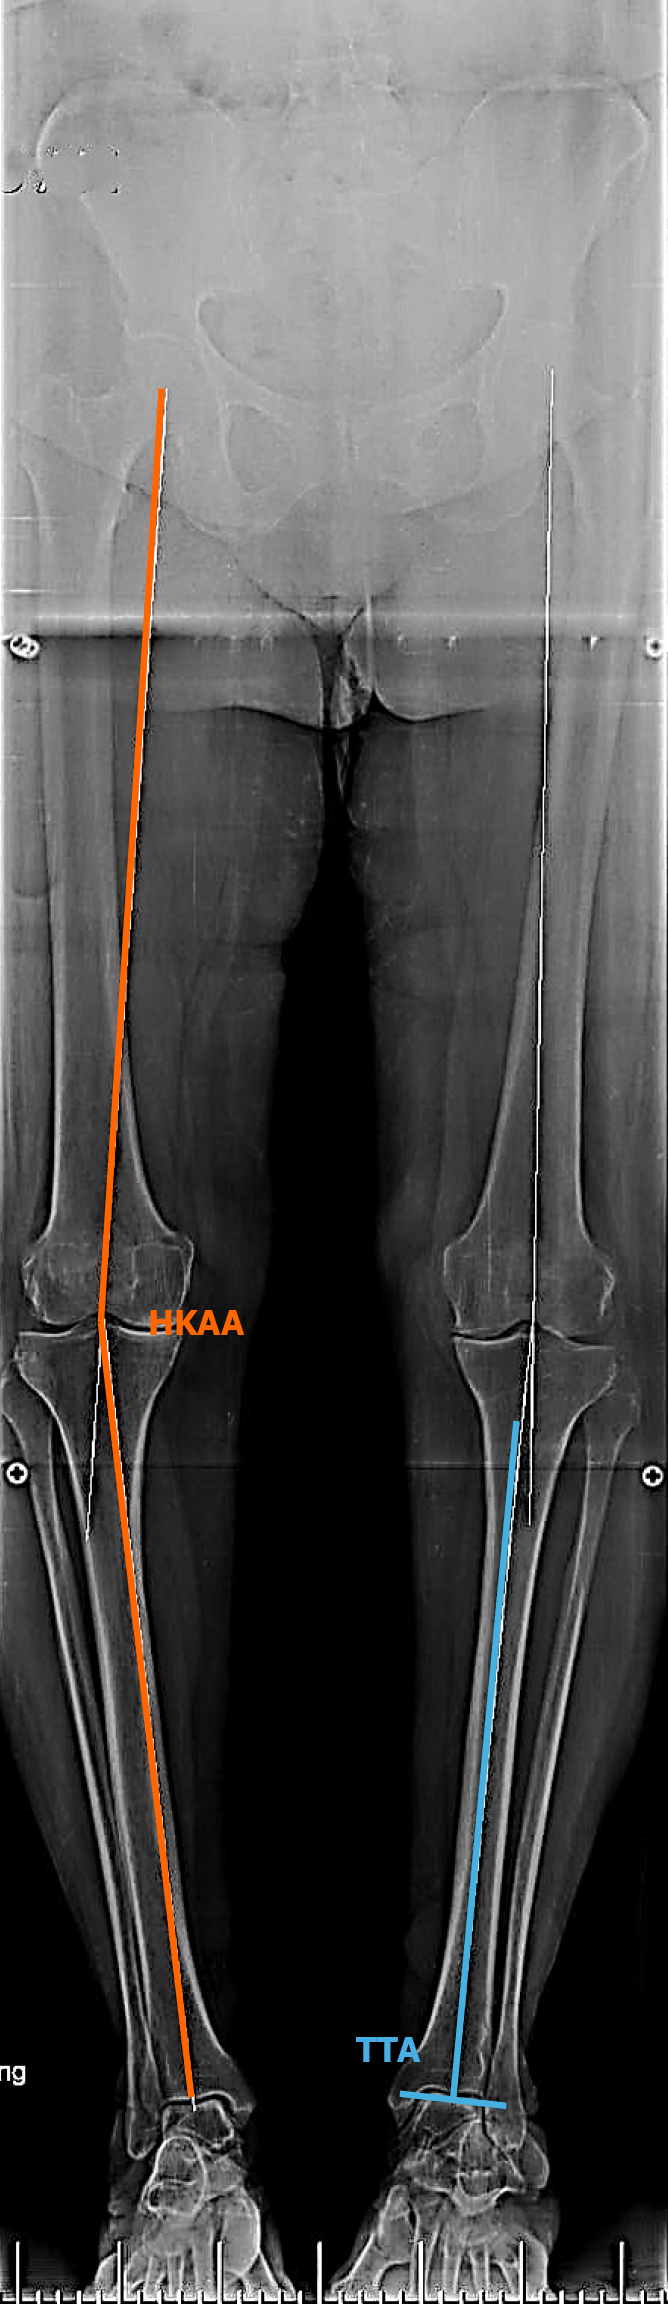
Figure 1 Long leg anteroposterior plain radiograph of the hip, knee, and ankle joints, which was used to measure the knee and ankle coronal alignment.
The hip to knee to ankle angle (HKAA) in orange is the medial angle between the mechanical axis of the tibia and femur; a neutral HKAA was defined as 180° ± 2°. The tibiotalar angle (TTA) in blue is the medial angle between the distal tibial axis and the line tangential to the upper talar surface; a neutral TTA was defined as 88.9° ± 3°. HKAA: Hip to knee to ankle angle; TTA: Tibiotalar angle.
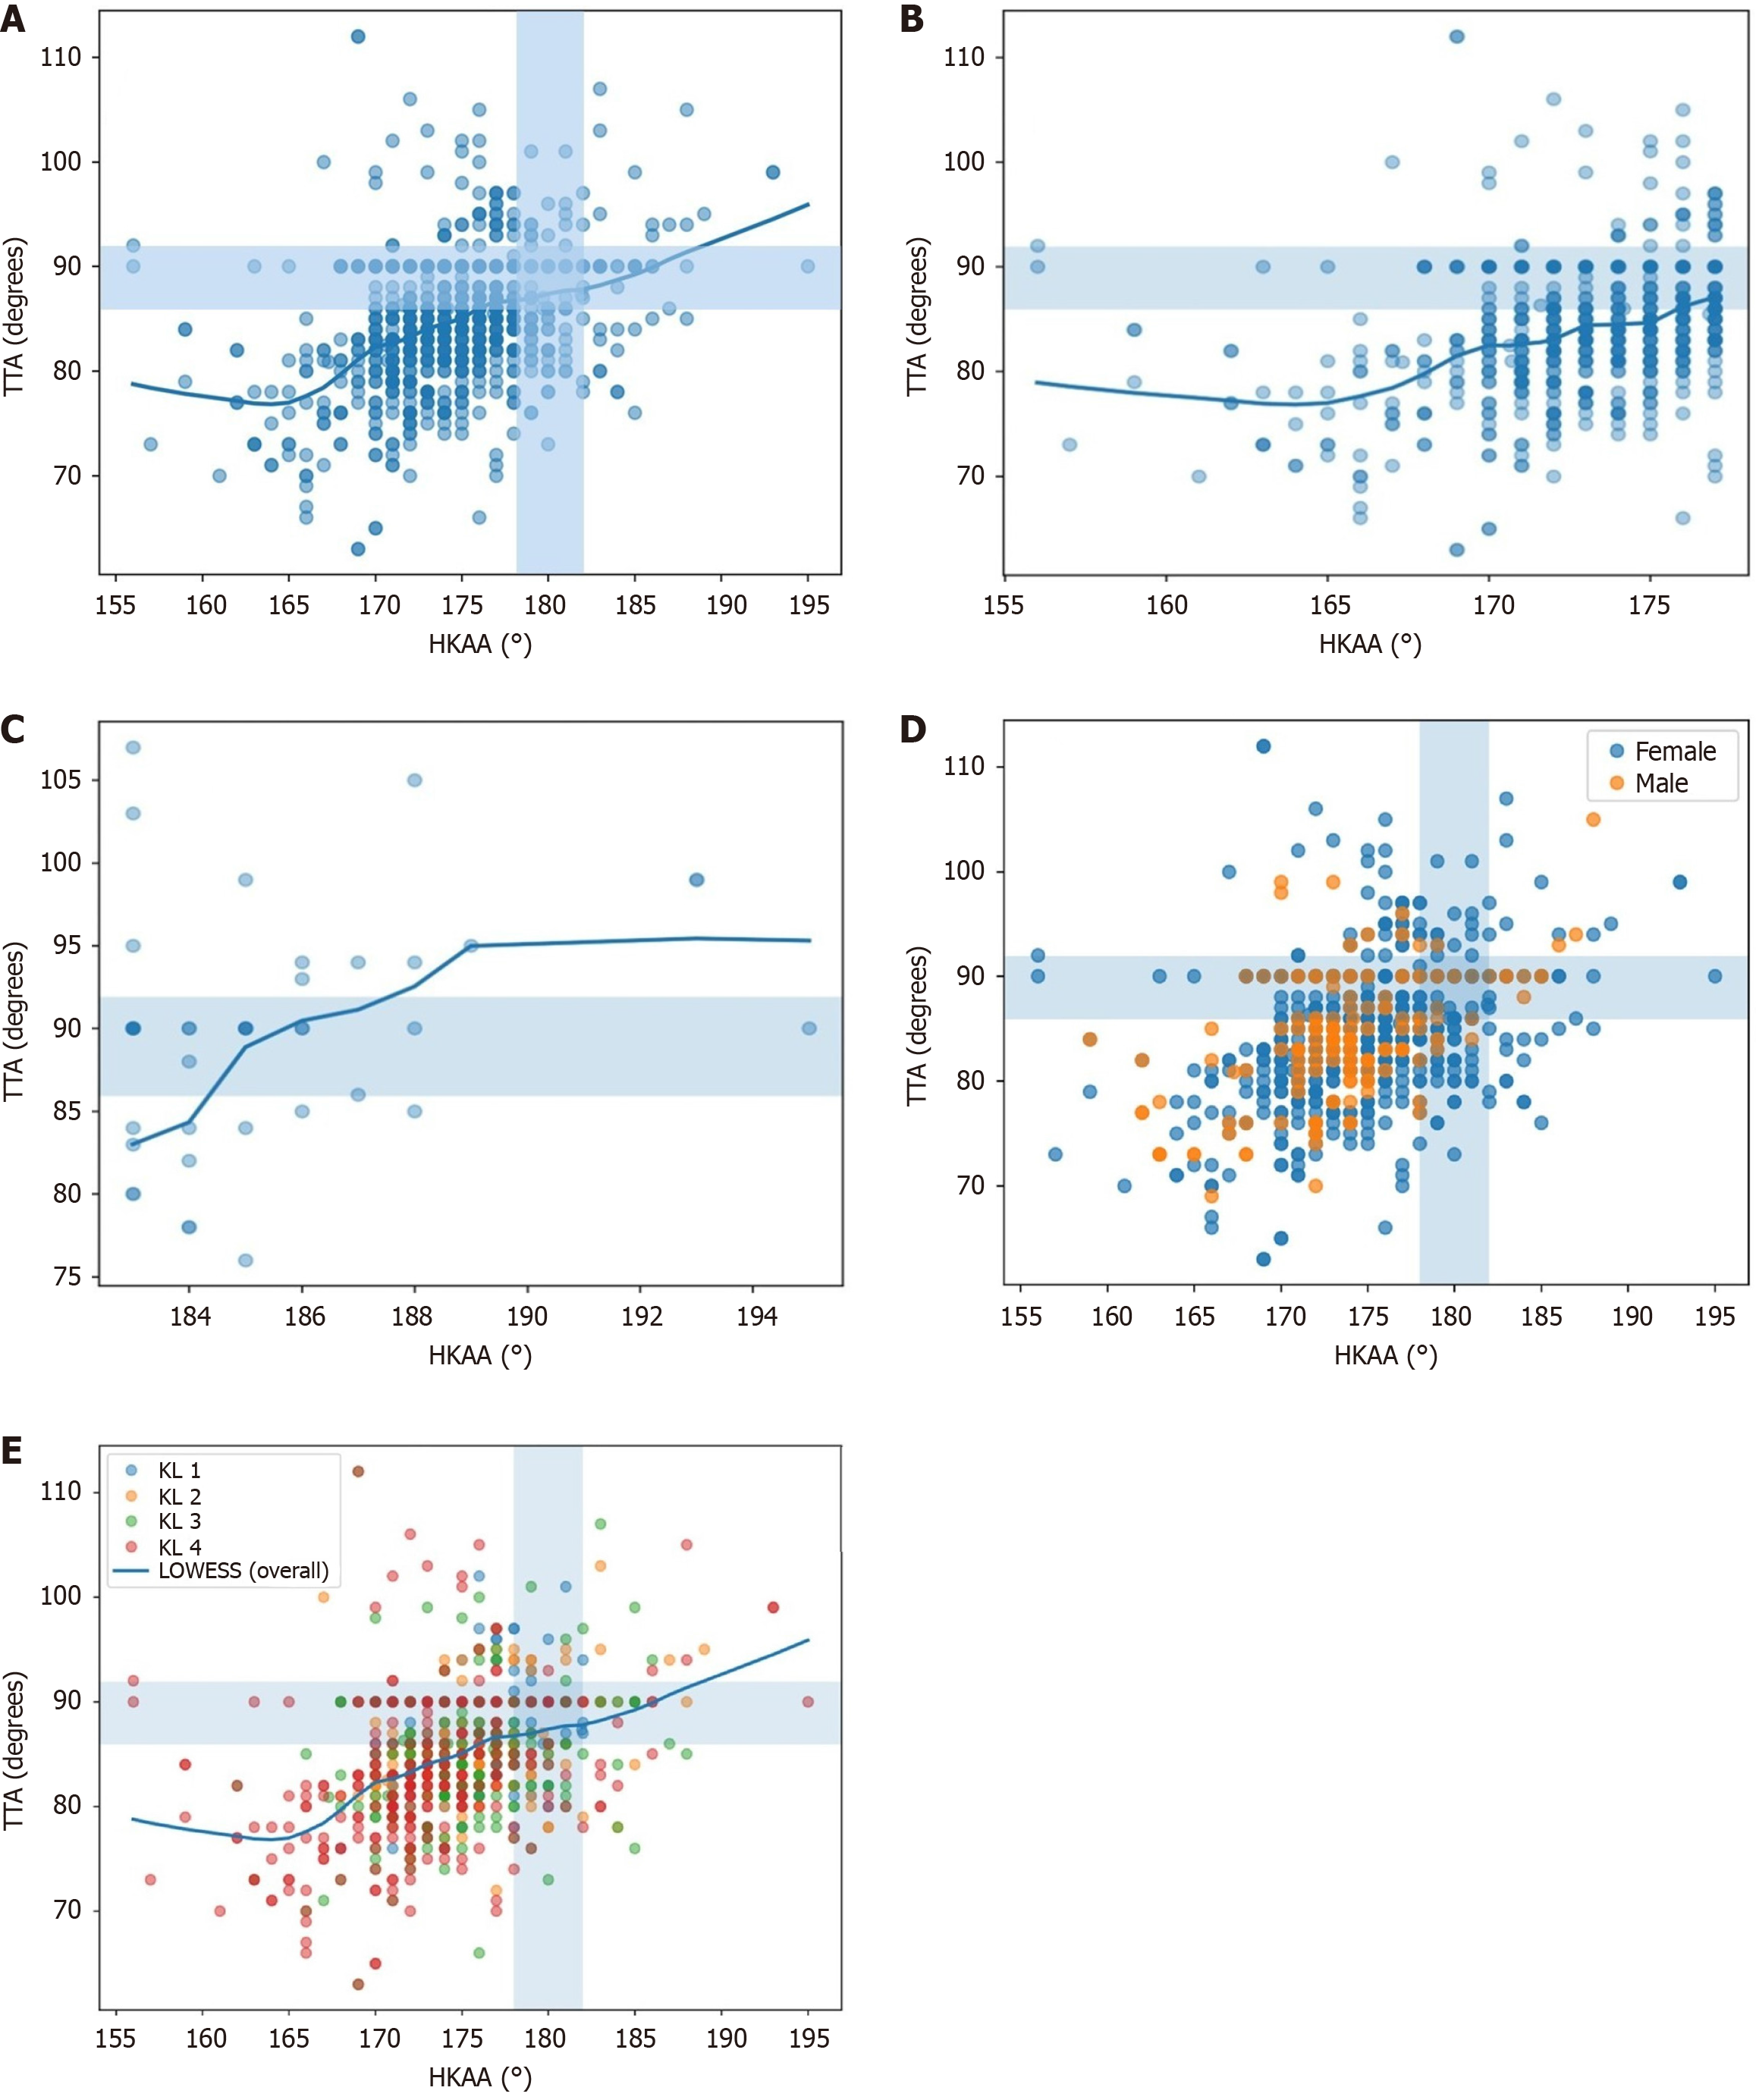
Figure 2 Scatter plots illustrating the relationship between the hip to knee to ankle angle and the tibiotalar angle with shaded neutral zones (hip to knee to ankle angle: 178-182°, tibiotalar angle: 85.
9-91.9°). A: All the patients; B: Varus knees; C: Valgus knees; D: Stratified based on patients’ sex; E: Stratified based on the knee osteoarthritis Kellgren-Lawrence grades. The solid curve represents locally weighted scatterplot smoothing, used to explore non-linear trends without assuming a predefined functional form. A steeper and more consistent trend is observed in varus knees, whereas greater dispersion is seen in valgus knees. HKAA: Hip to knee to ankle angle; TTA: Tibiotalar angle; KL: Kellgren-Lawrence; LOWESS: Locally weighted scatterplot smoothing.
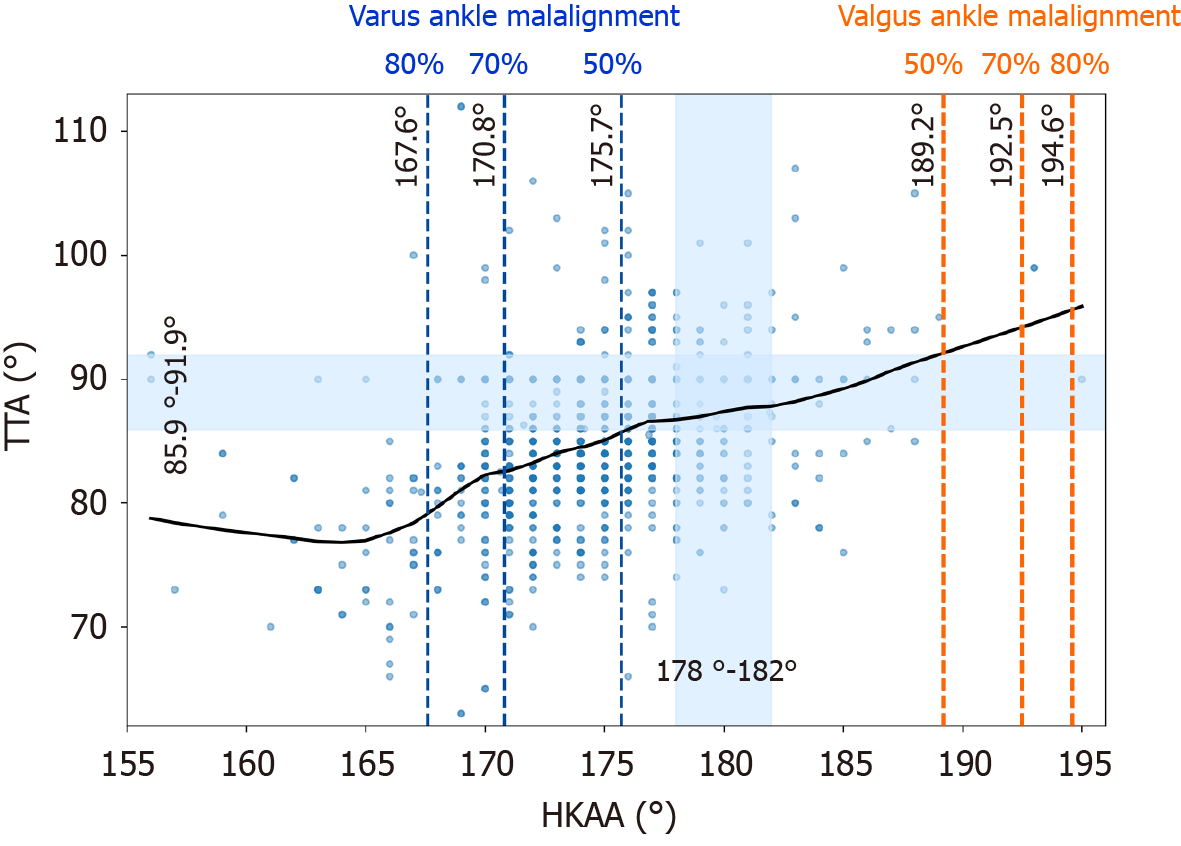
Figure 3 Scatterplot showing the relationship between hip to knee to ankle angle and tibiotalar angle with locally weighted scatterplot smoothing.
Blue dashed vertical lines indicate hip to knee to ankle angle (HKAA) thresholds corresponding to 50%, 70%, and 80% predicted probabilities of varus ankle malalignment [tibiotalar angle (TTA)< 85.9°], while red dashed lines indicate corresponding thresholds for valgus ankle malalignment (TTA > 91.9°), derived from direction-specific logistic regression models. Shaded regions represent neutral knee HKAA (178°-182°) and ankle neutral TTA (85.9°-91.9°) alignment ranges. HKAA: Hip to knee to ankle angle; TTA: Tibiotalar angle.
- Citation: Khalifa AA, Lemma S, Fadle AA. In knee osteoarthritis, what is the knee deformity threshold after which the ankle realigns beyond the neutral zone? World J Orthop 2026; 17(5): 118547
- URL: https://www.wjgnet.com/2218-5836/full/v17/i5/118547.htm
- DOI: https://dx.doi.org/10.5312/wjo.v17.i5.118547