©The Author(s) 2025.
World J Orthop. Jun 18, 2025; 16(6): 106804
Published online Jun 18, 2025. doi: 10.5312/wjo.v16.i6.106804
Published online Jun 18, 2025. doi: 10.5312/wjo.v16.i6.106804
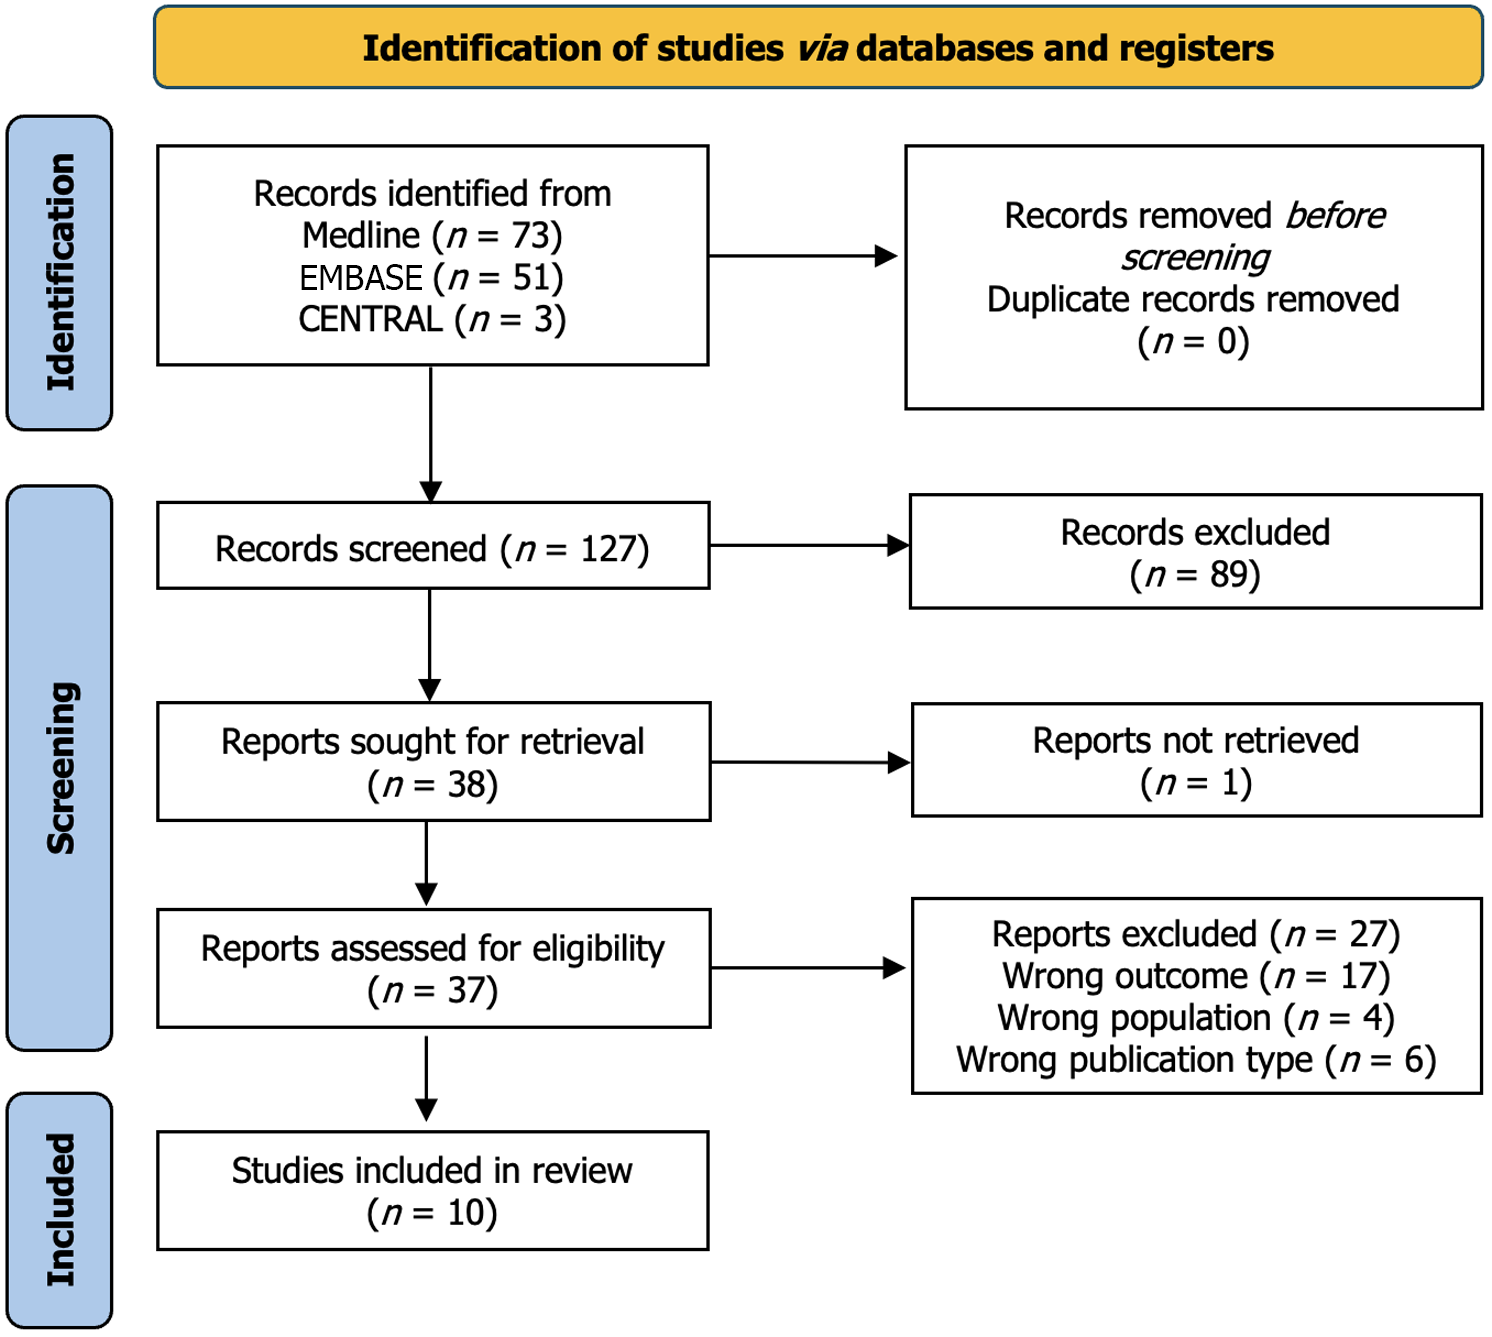
Figure 1 PRISMA 2020 flow diagram outlining the literature search and screening process.
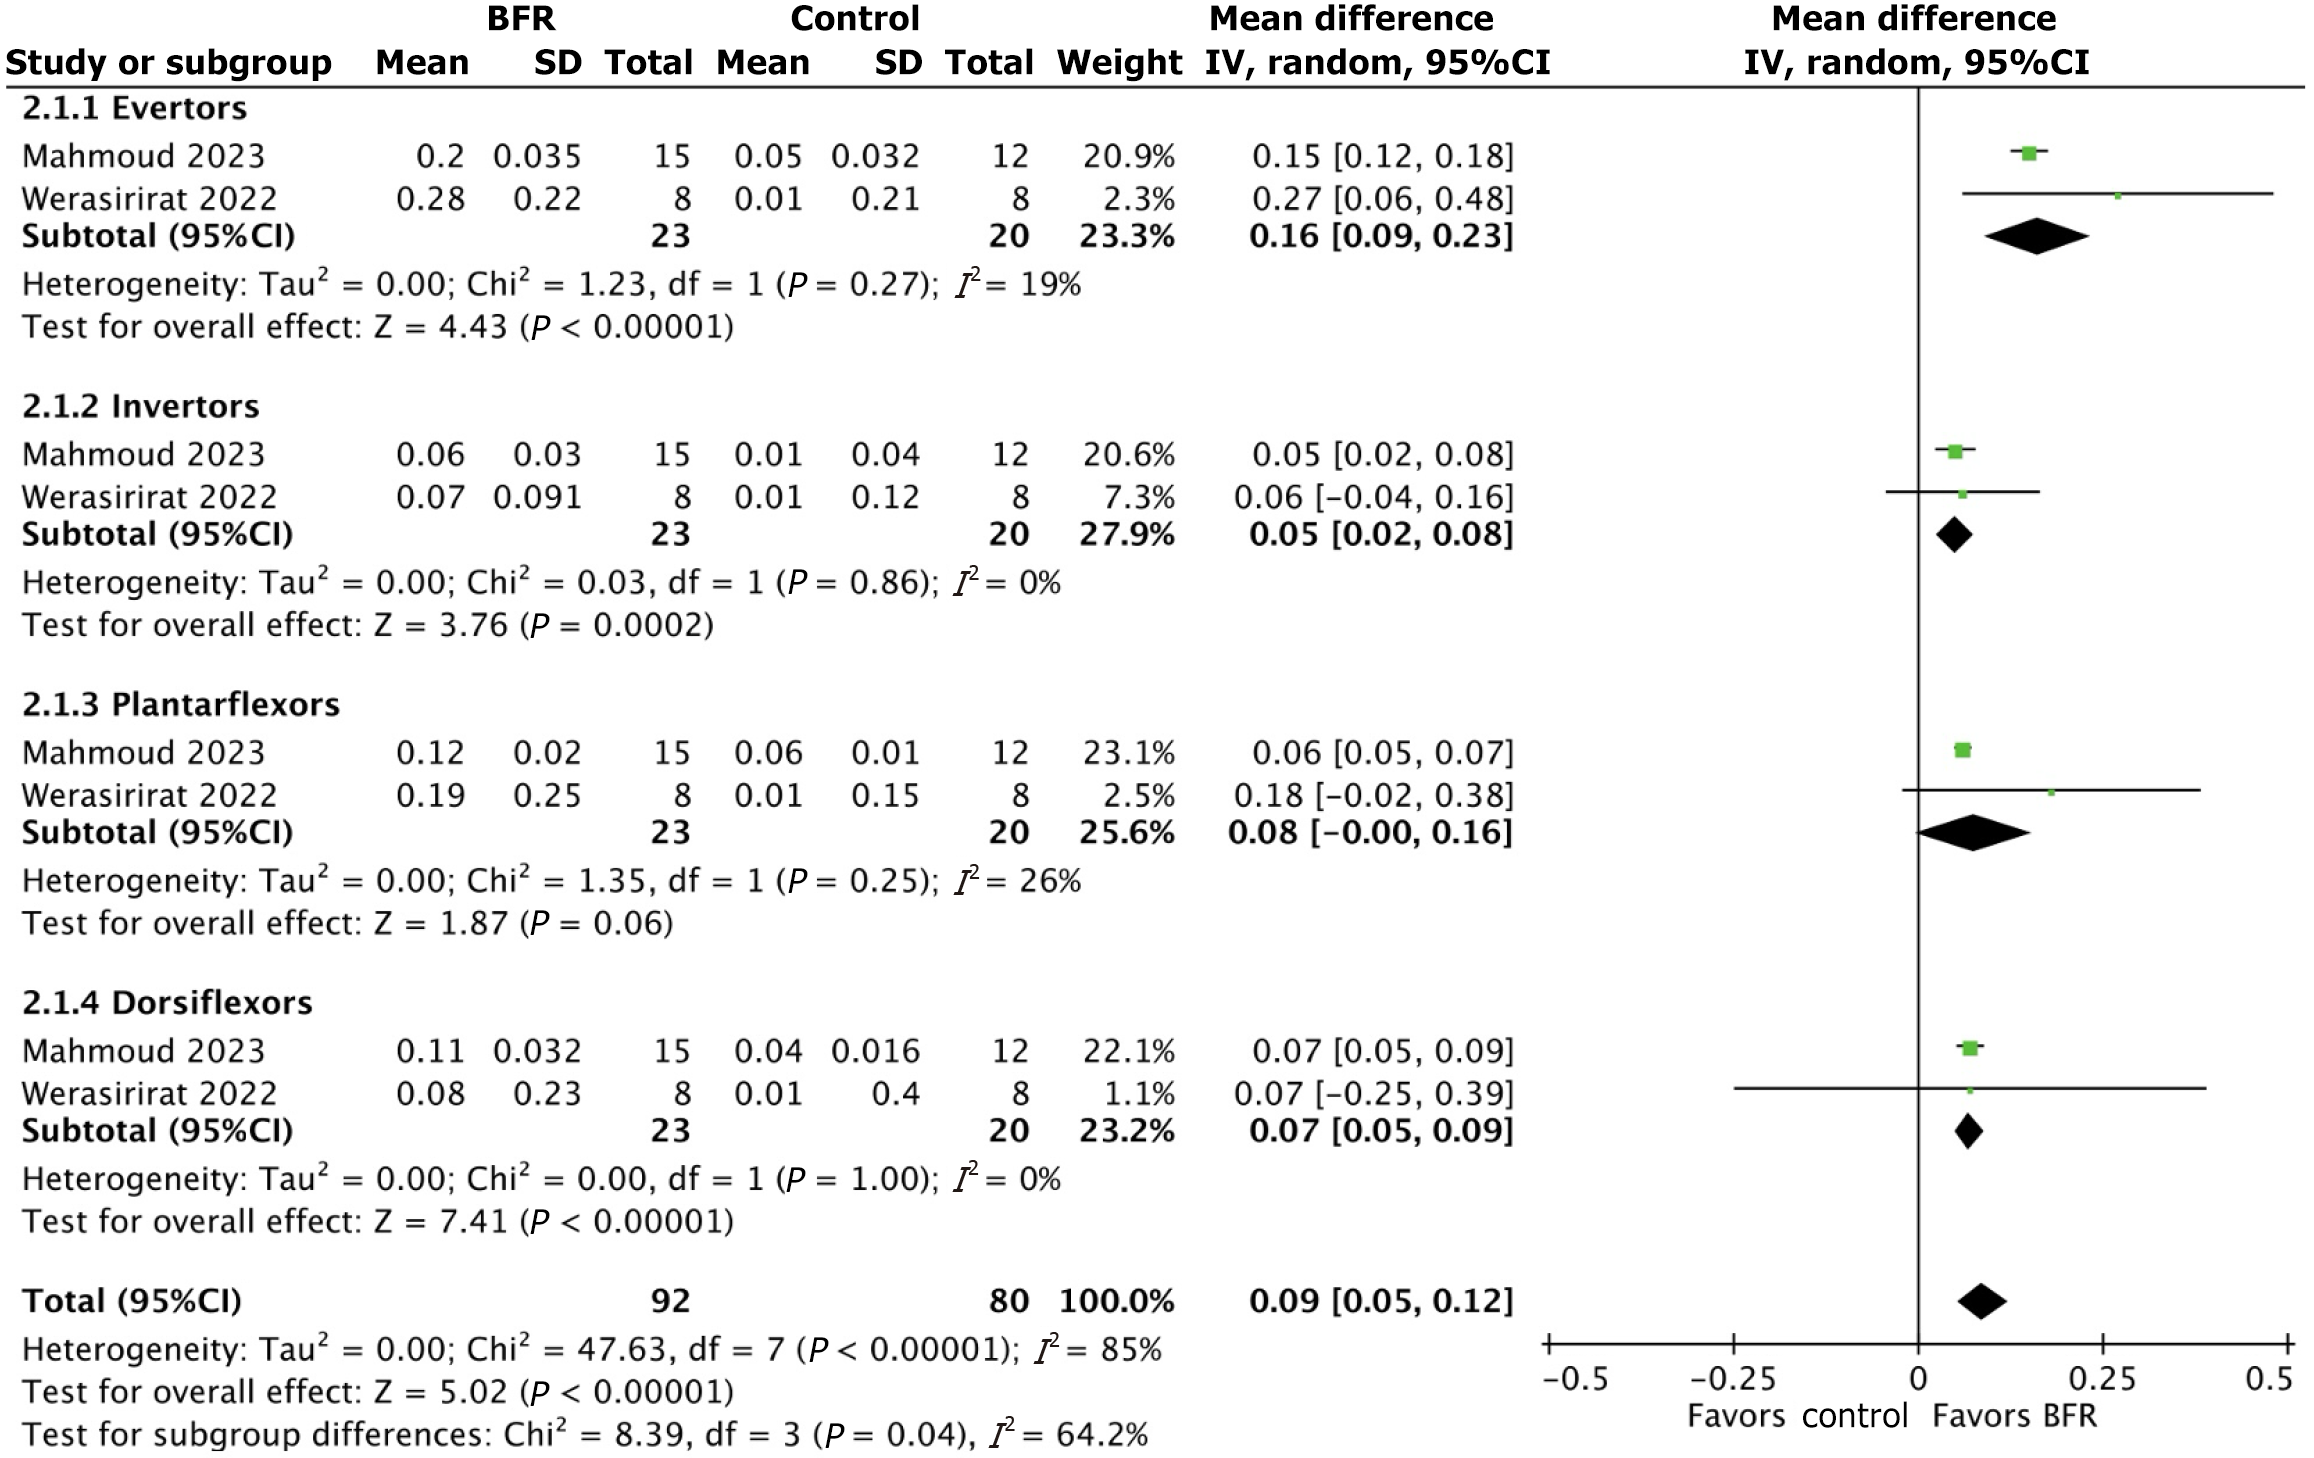
Figure 2 Meta-analysis forest plot of peak torque to body weight ratios in ankle dorsiflexor/plantarflexor and ankle invertor/evertor muscles.
BFR: Blood flow restriction; IV Random: Inverse variance random effects model.
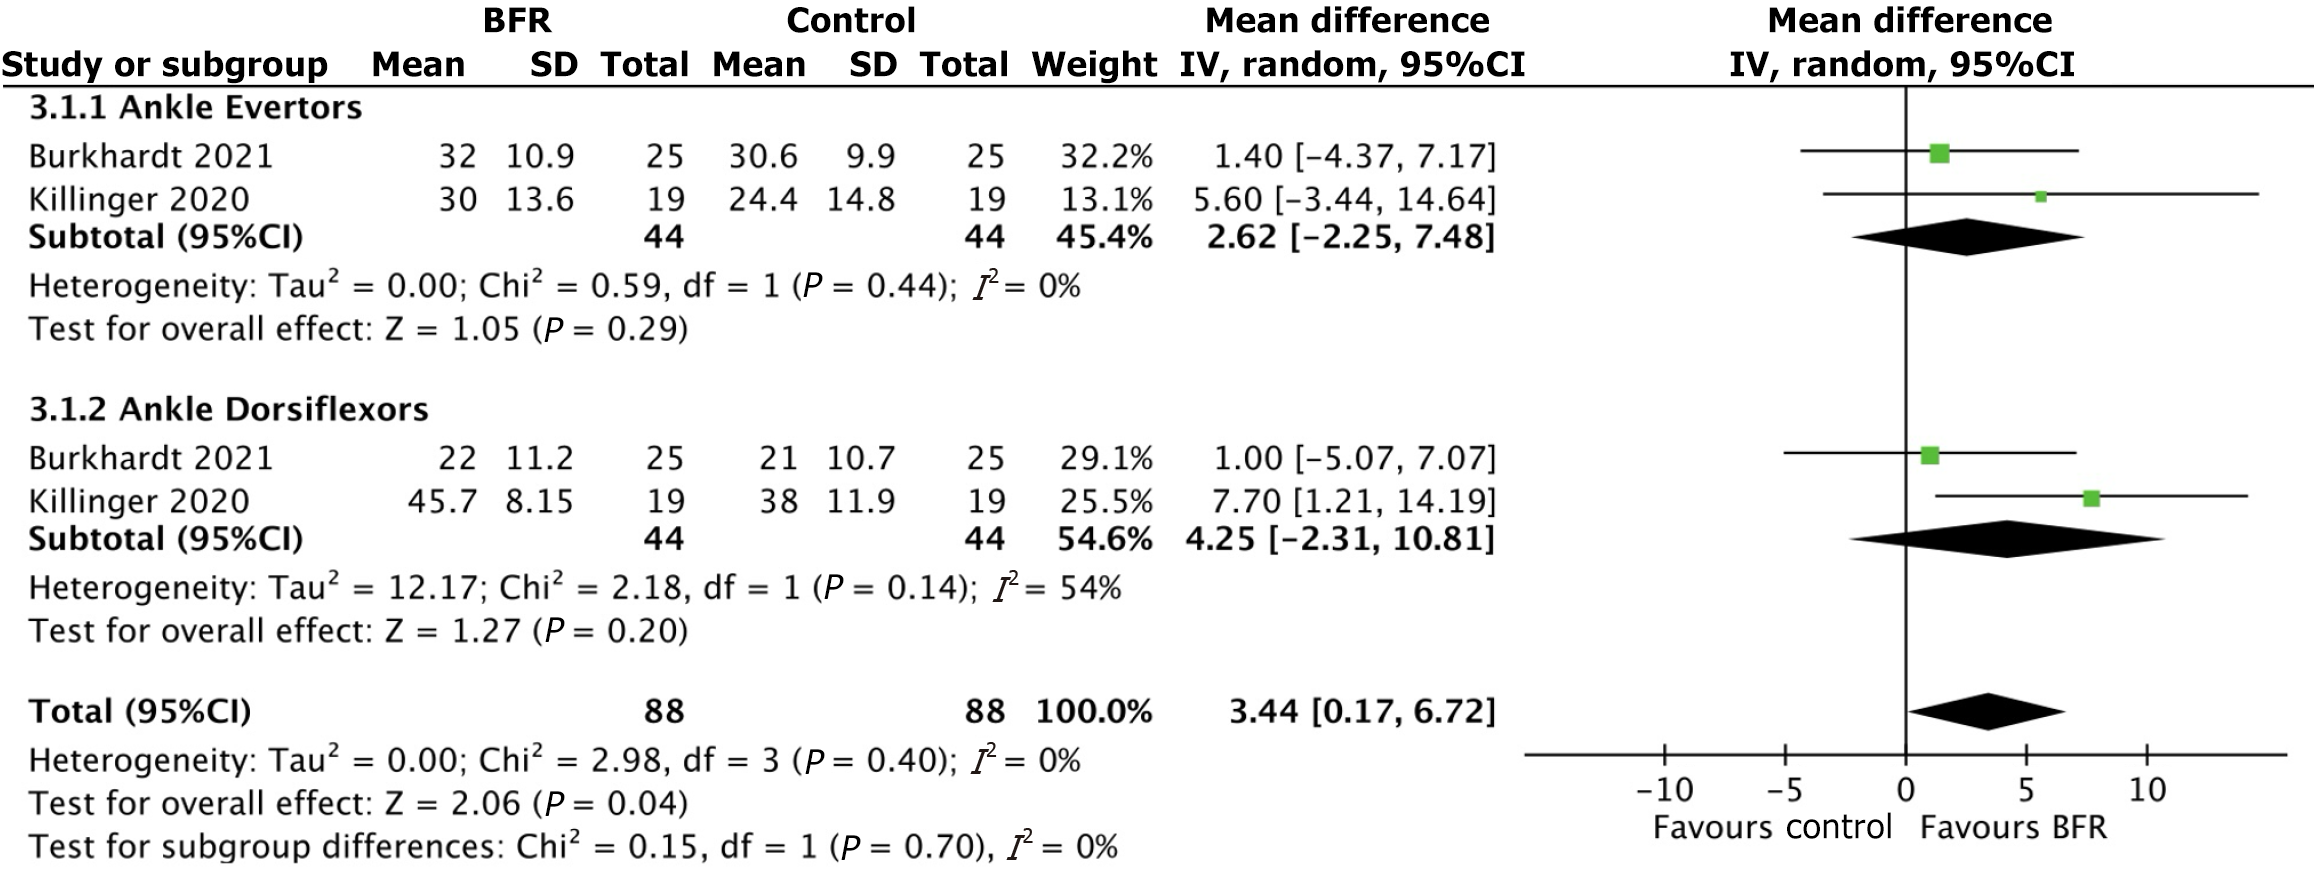
Figure 3 Meta-analysis forest plot of percent muscle activation with and without blood flow restriction in ankle dorsiflexor and evertor muscles.
BFR: Blood flow restriction; IV Random: Inverse variance random effects model.
Figure 4 Meta-analysis forest plot of Y-Balance Test Scores with and without blood flow restriction.
BFR: Blood flow restriction; IV Random: Inverse variance random effects model.
Figure 5 Meta-analysis forest plot of peroneus longus change in cross-sectional area with and without blood flow restriction.
BFR: Blood flow restriction; IV Random: Inverse variance random effects model.
- Citation: Balboni JM, Madhira K, Martinez V, Tung WS, Kennedy JG, Gianakos AL. Effect of blood flow restriction on muscle strength and stability following foot and ankle injury: A systematic review. World J Orthop 2025; 16(6): 106804
- URL: https://www.wjgnet.com/2218-5836/full/v16/i6/106804.htm
- DOI: https://dx.doi.org/10.5312/wjo.v16.i6.106804


