©The Author(s) 2025.
World J Orthop. Oct 18, 2025; 16(10): 110233
Published online Oct 18, 2025. doi: 10.5312/wjo.v16.i10.110233
Published online Oct 18, 2025. doi: 10.5312/wjo.v16.i10.110233
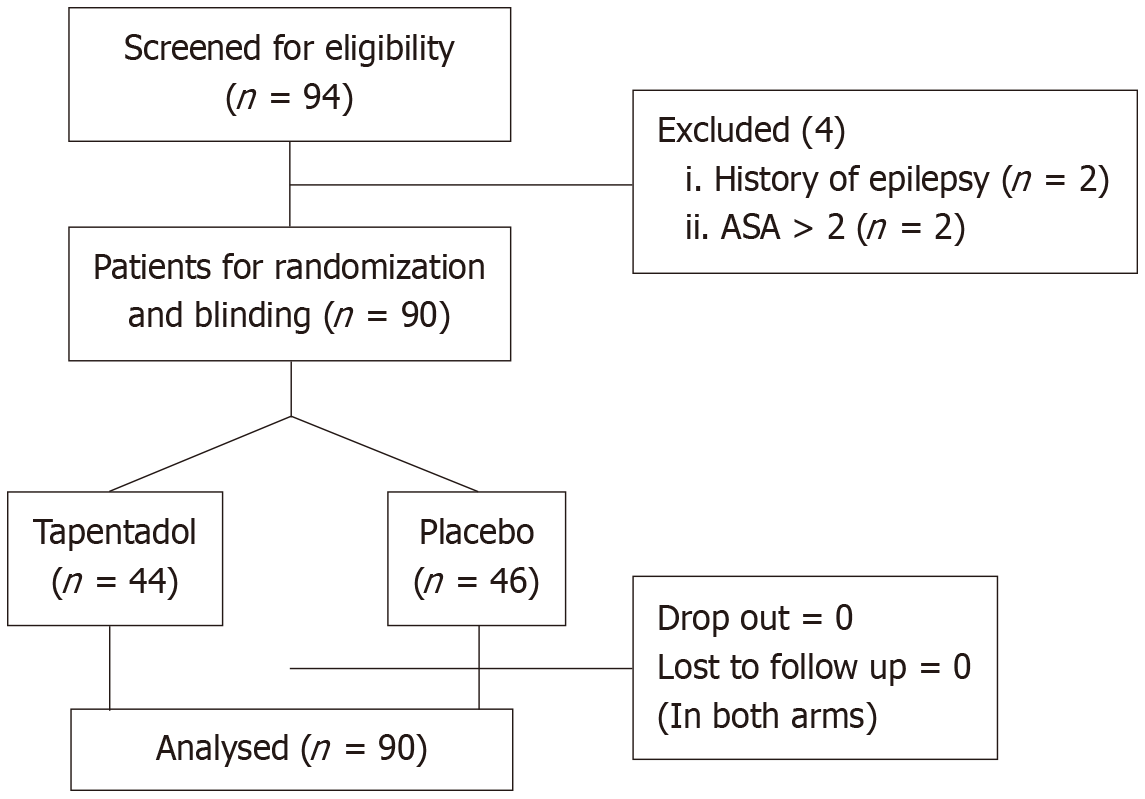
Figure 1
CONSORT statement.
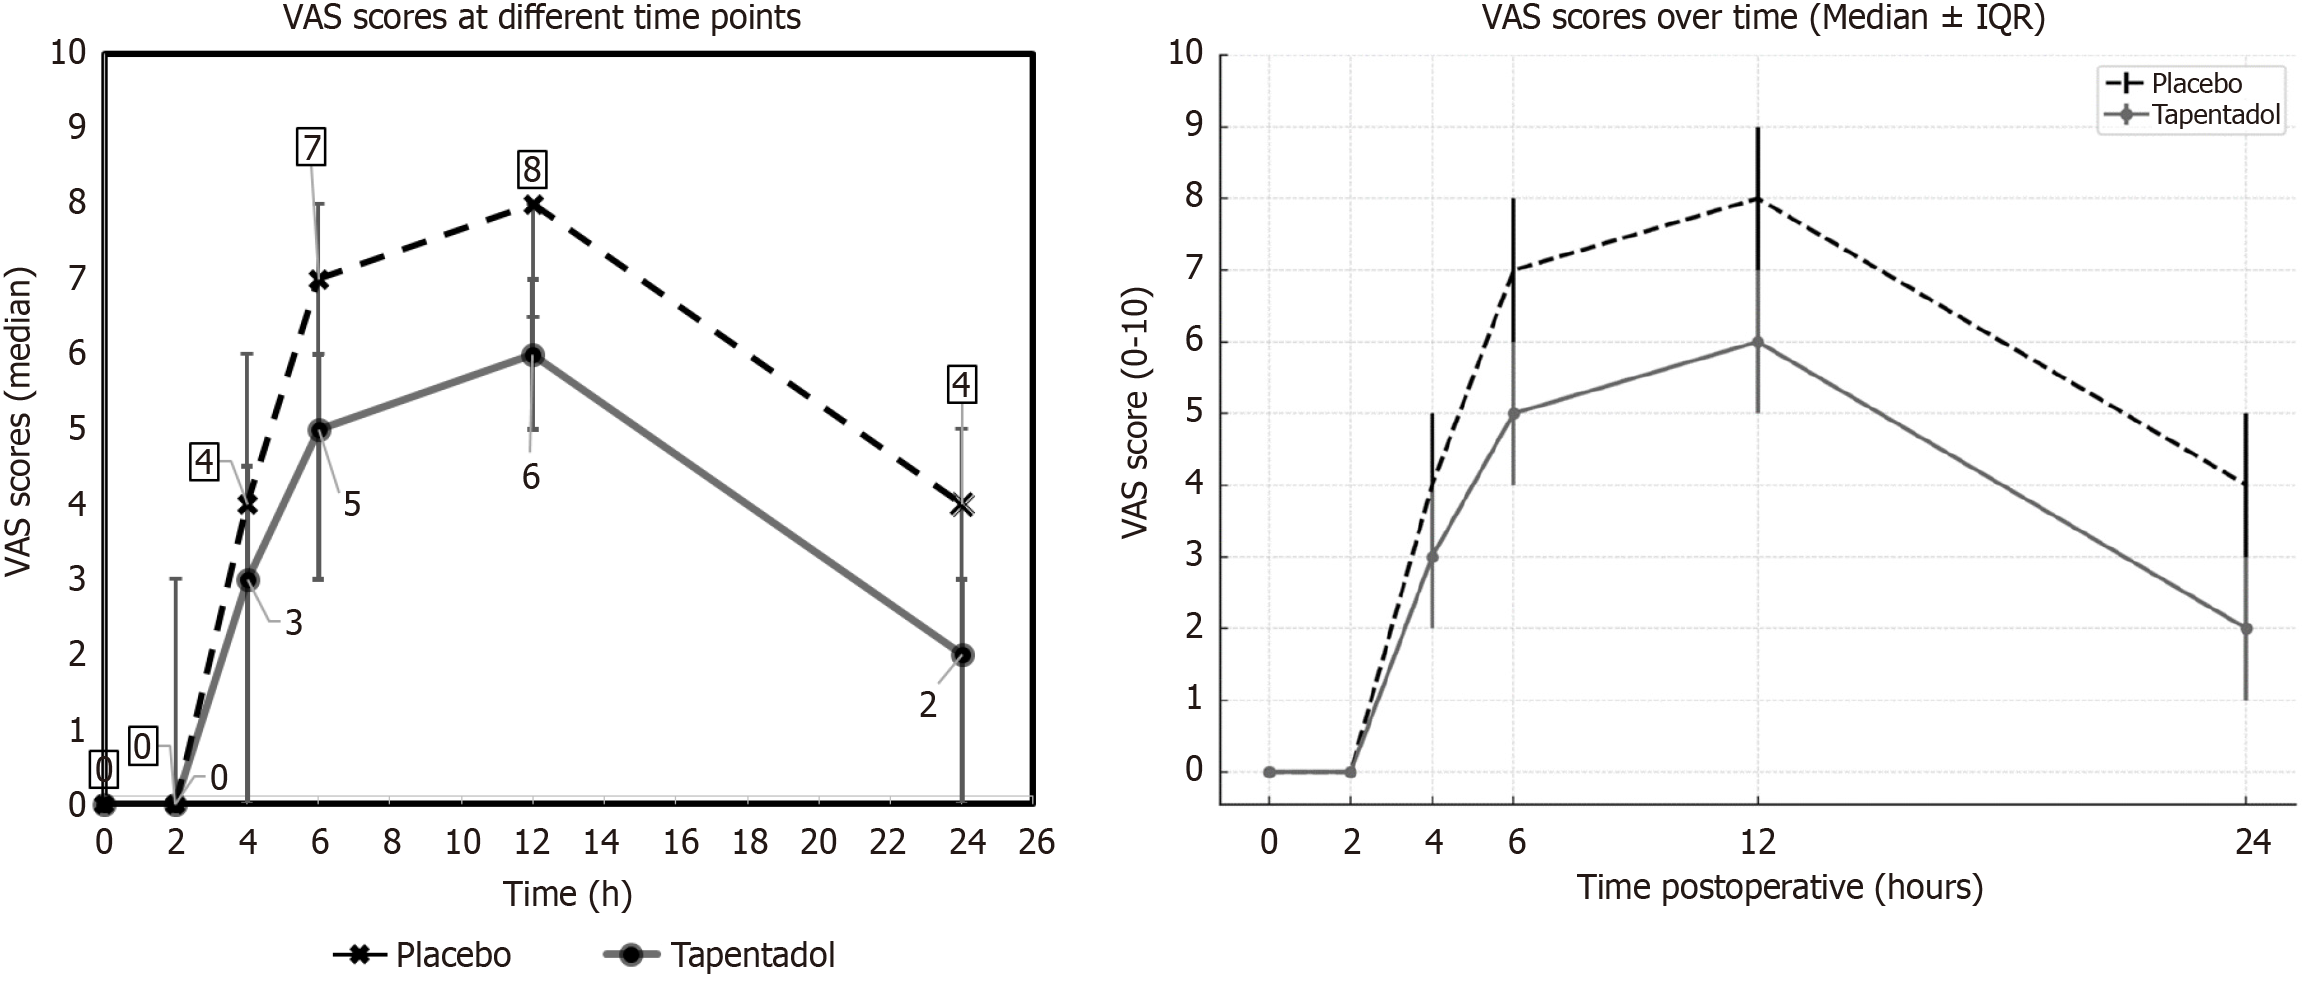
Figure 2 Change of visual analog scale scores in with time in both the groups.
IQR: Interquartile range; VAS: Visual analog scale.
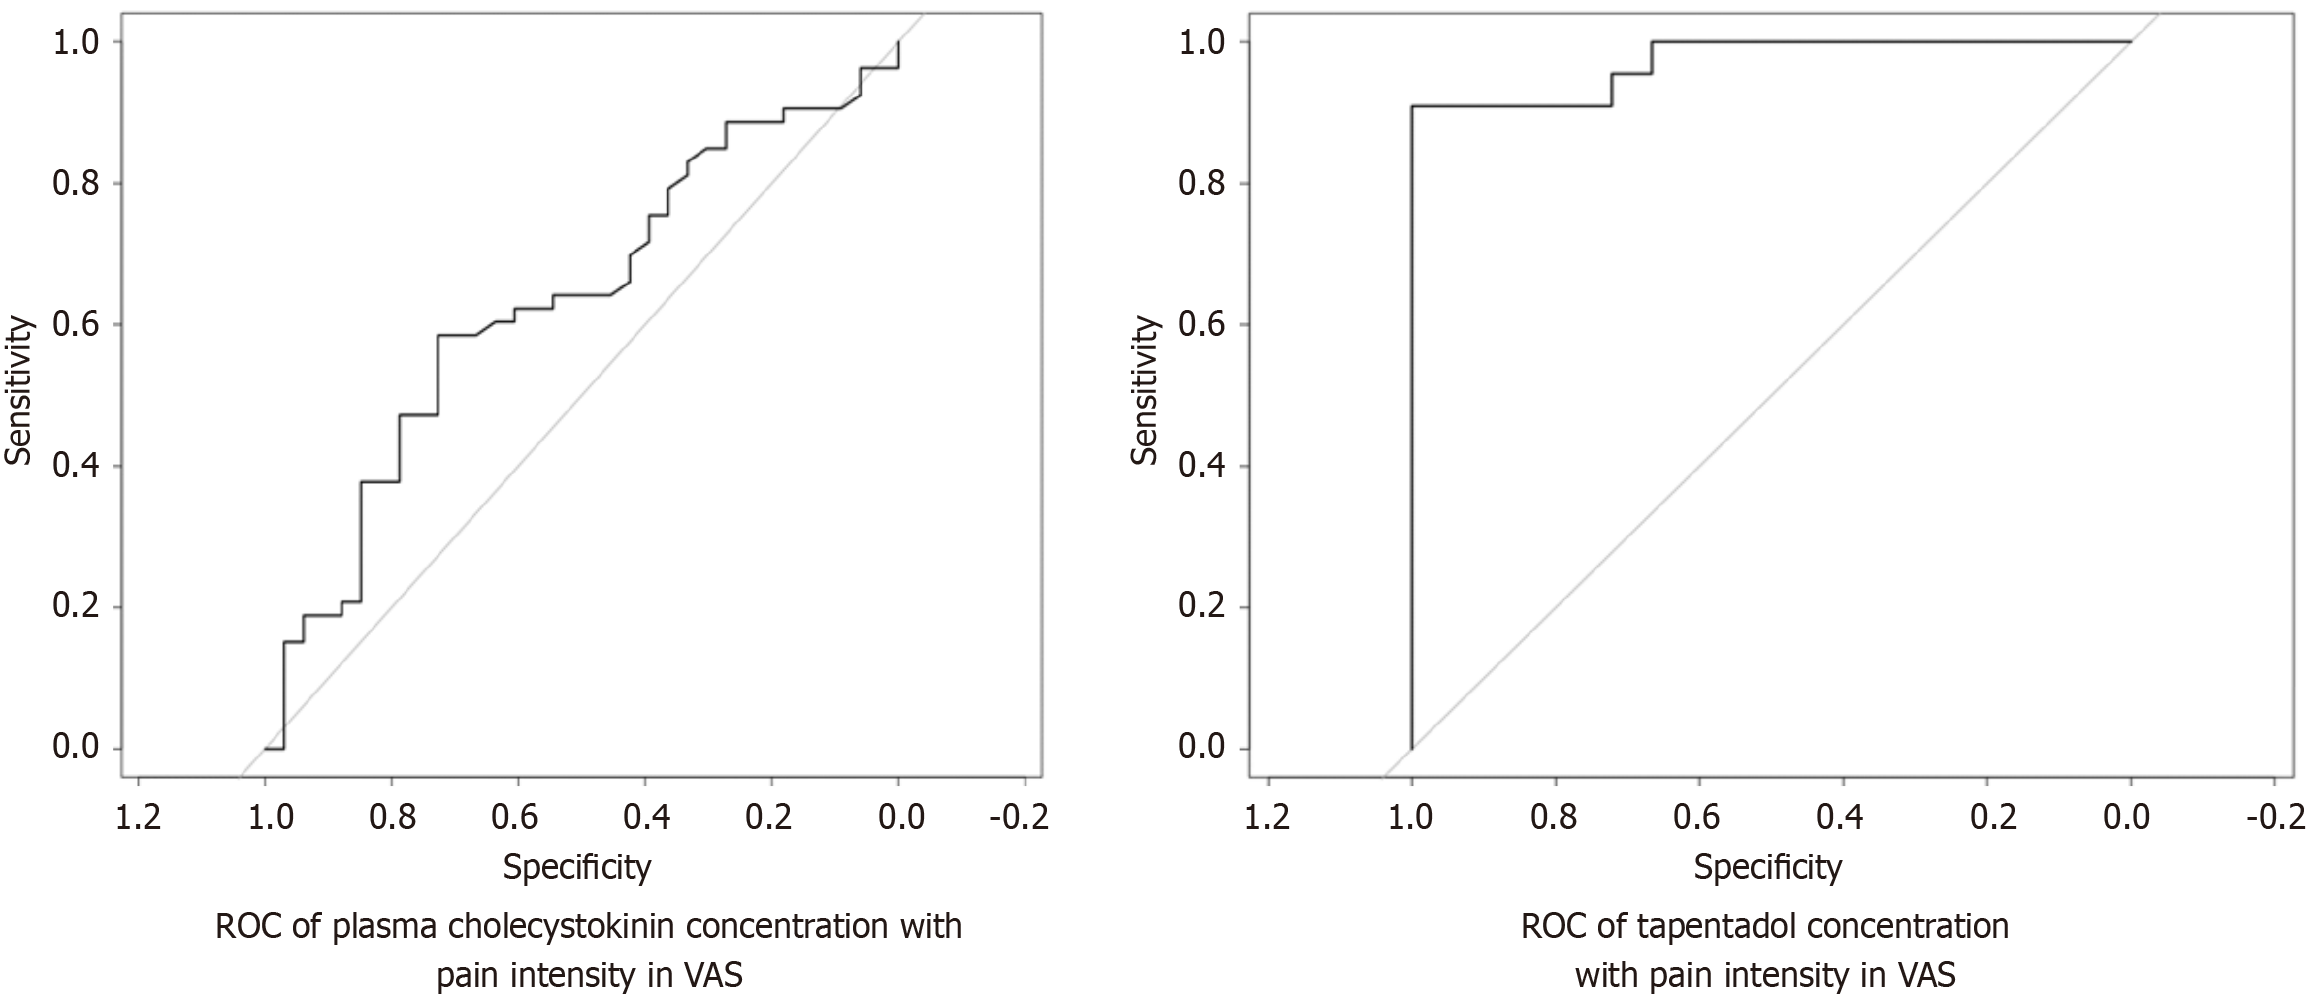
Figure 3 Receiver operating characteristic of plasma cholecystokinin concentration and tapentadol concentration with pain intensity in visual analog scale.
ROC: Receiver operating characteristic; VAS: Visual analog scale.
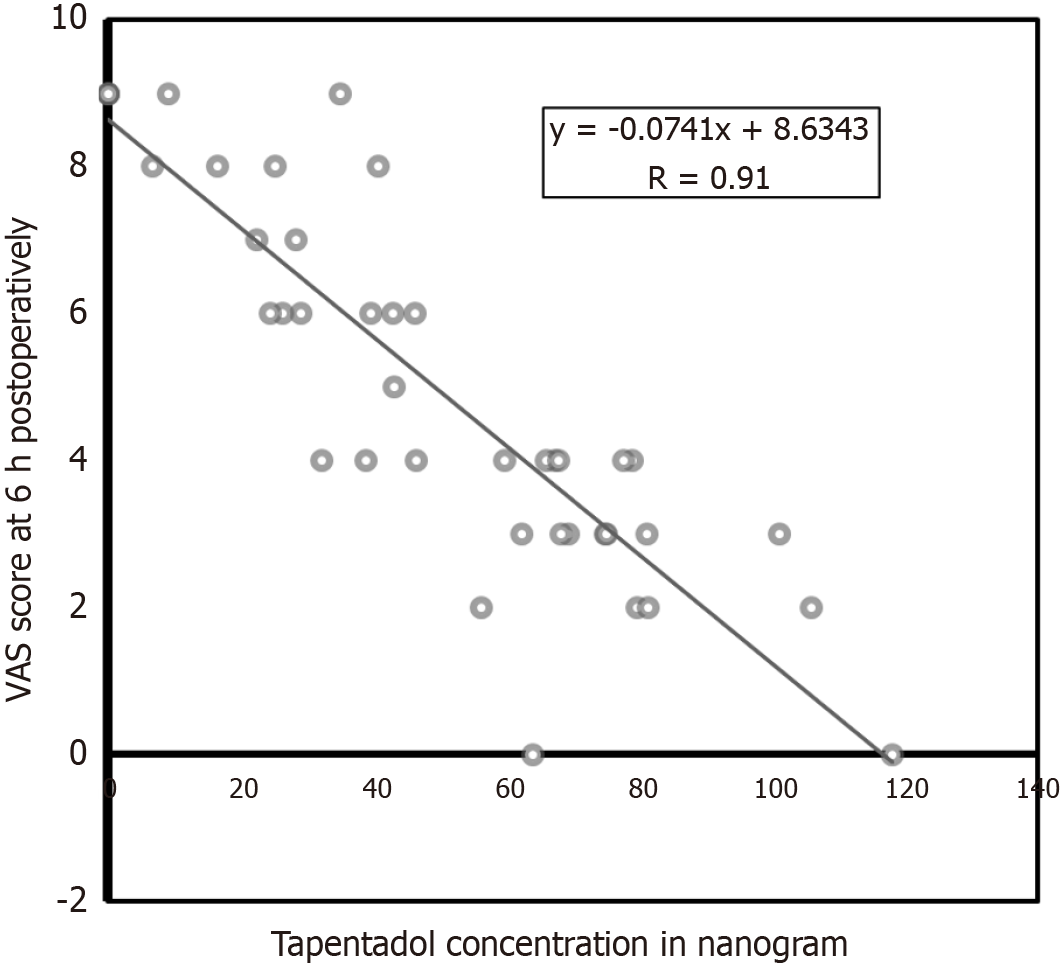
Figure 4
Correlation of plasma tapentadol levels and pain intensity (visual analog scale) at 6 hours.
- Citation: Bhattacharjee S, Srinivasan A, Tripathy SK, Doki SK, Hota D. Efficacy and safety of pre-emptive tapentadol on pain control in total knee arthroplasty: A randomized, double-blind, placebo-controlled trial. World J Orthop 2025; 16(10): 110233
- URL: https://www.wjgnet.com/2218-5836/full/v16/i10/110233.htm
- DOI: https://dx.doi.org/10.5312/wjo.v16.i10.110233


