©The Author(s) 2021.
World J Orthop. Aug 18, 2021; 12(8): 604-619
Published online Aug 18, 2021. doi: 10.5312/wjo.v12.i8.604
Published online Aug 18, 2021. doi: 10.5312/wjo.v12.i8.604
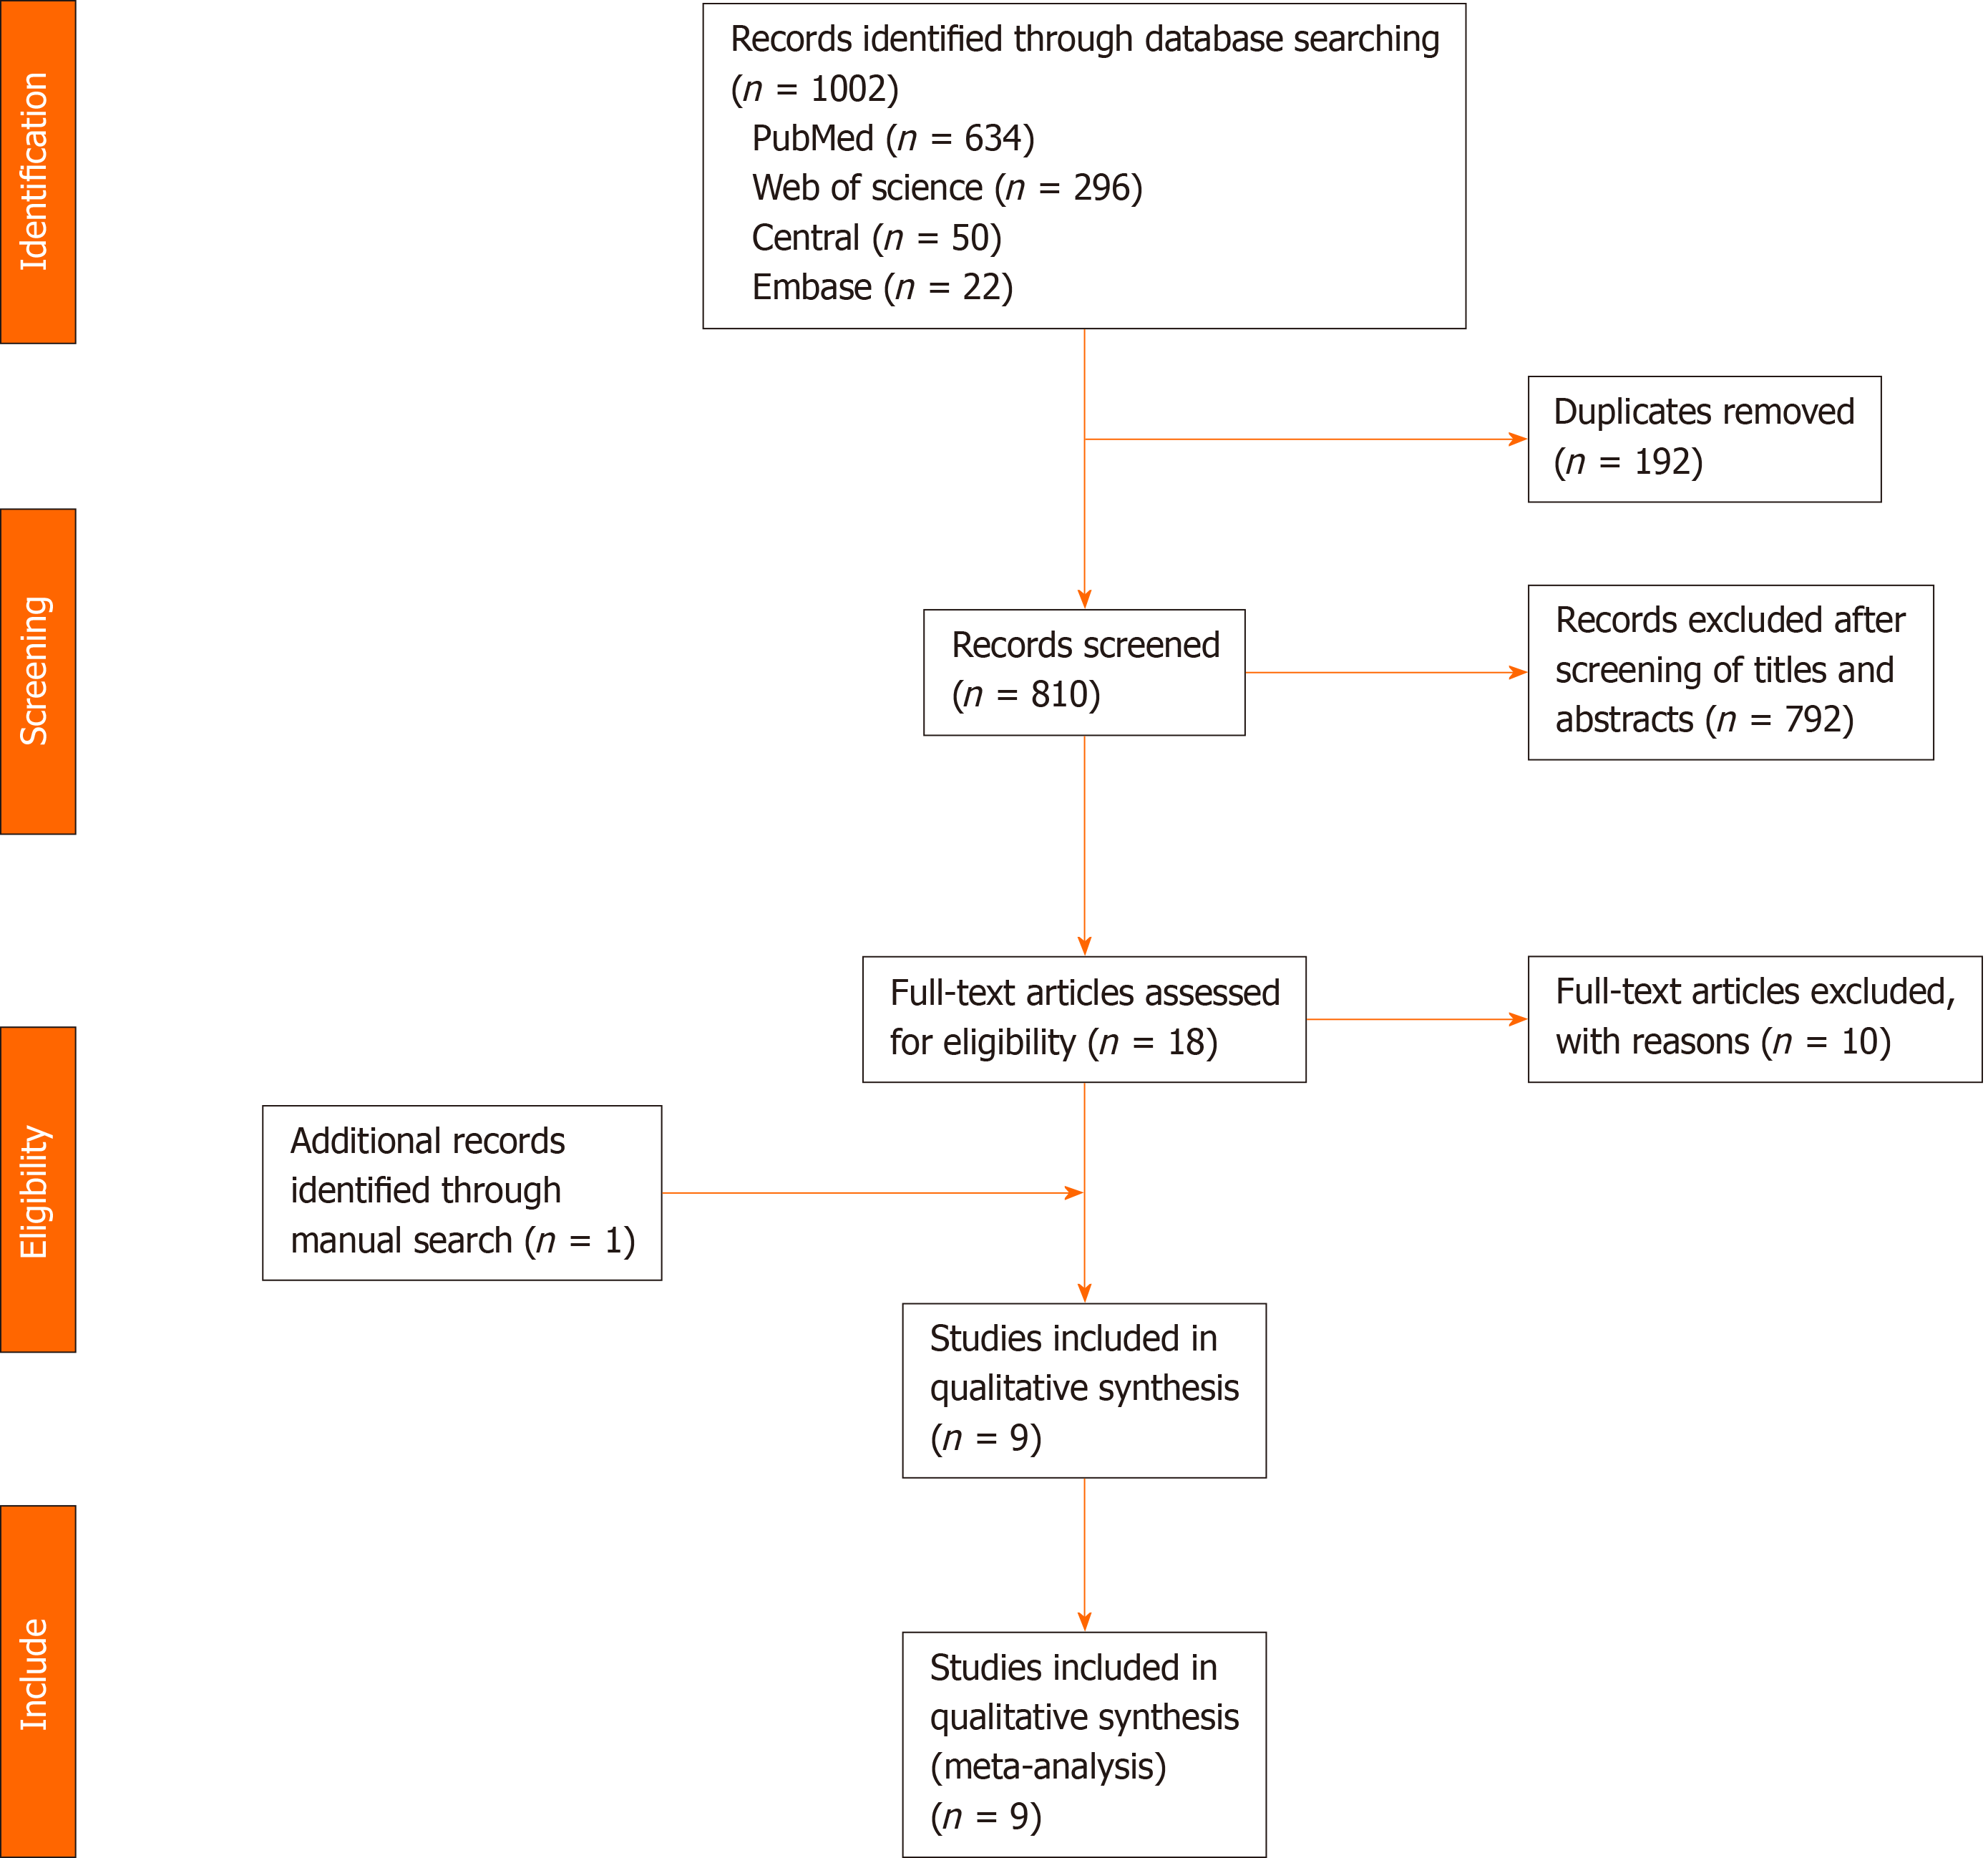
Figure 1 Preferred Reporting Items for Systematic Reviews and Meta-Analyses flow diagram of search results, studies’ screening, and selection.
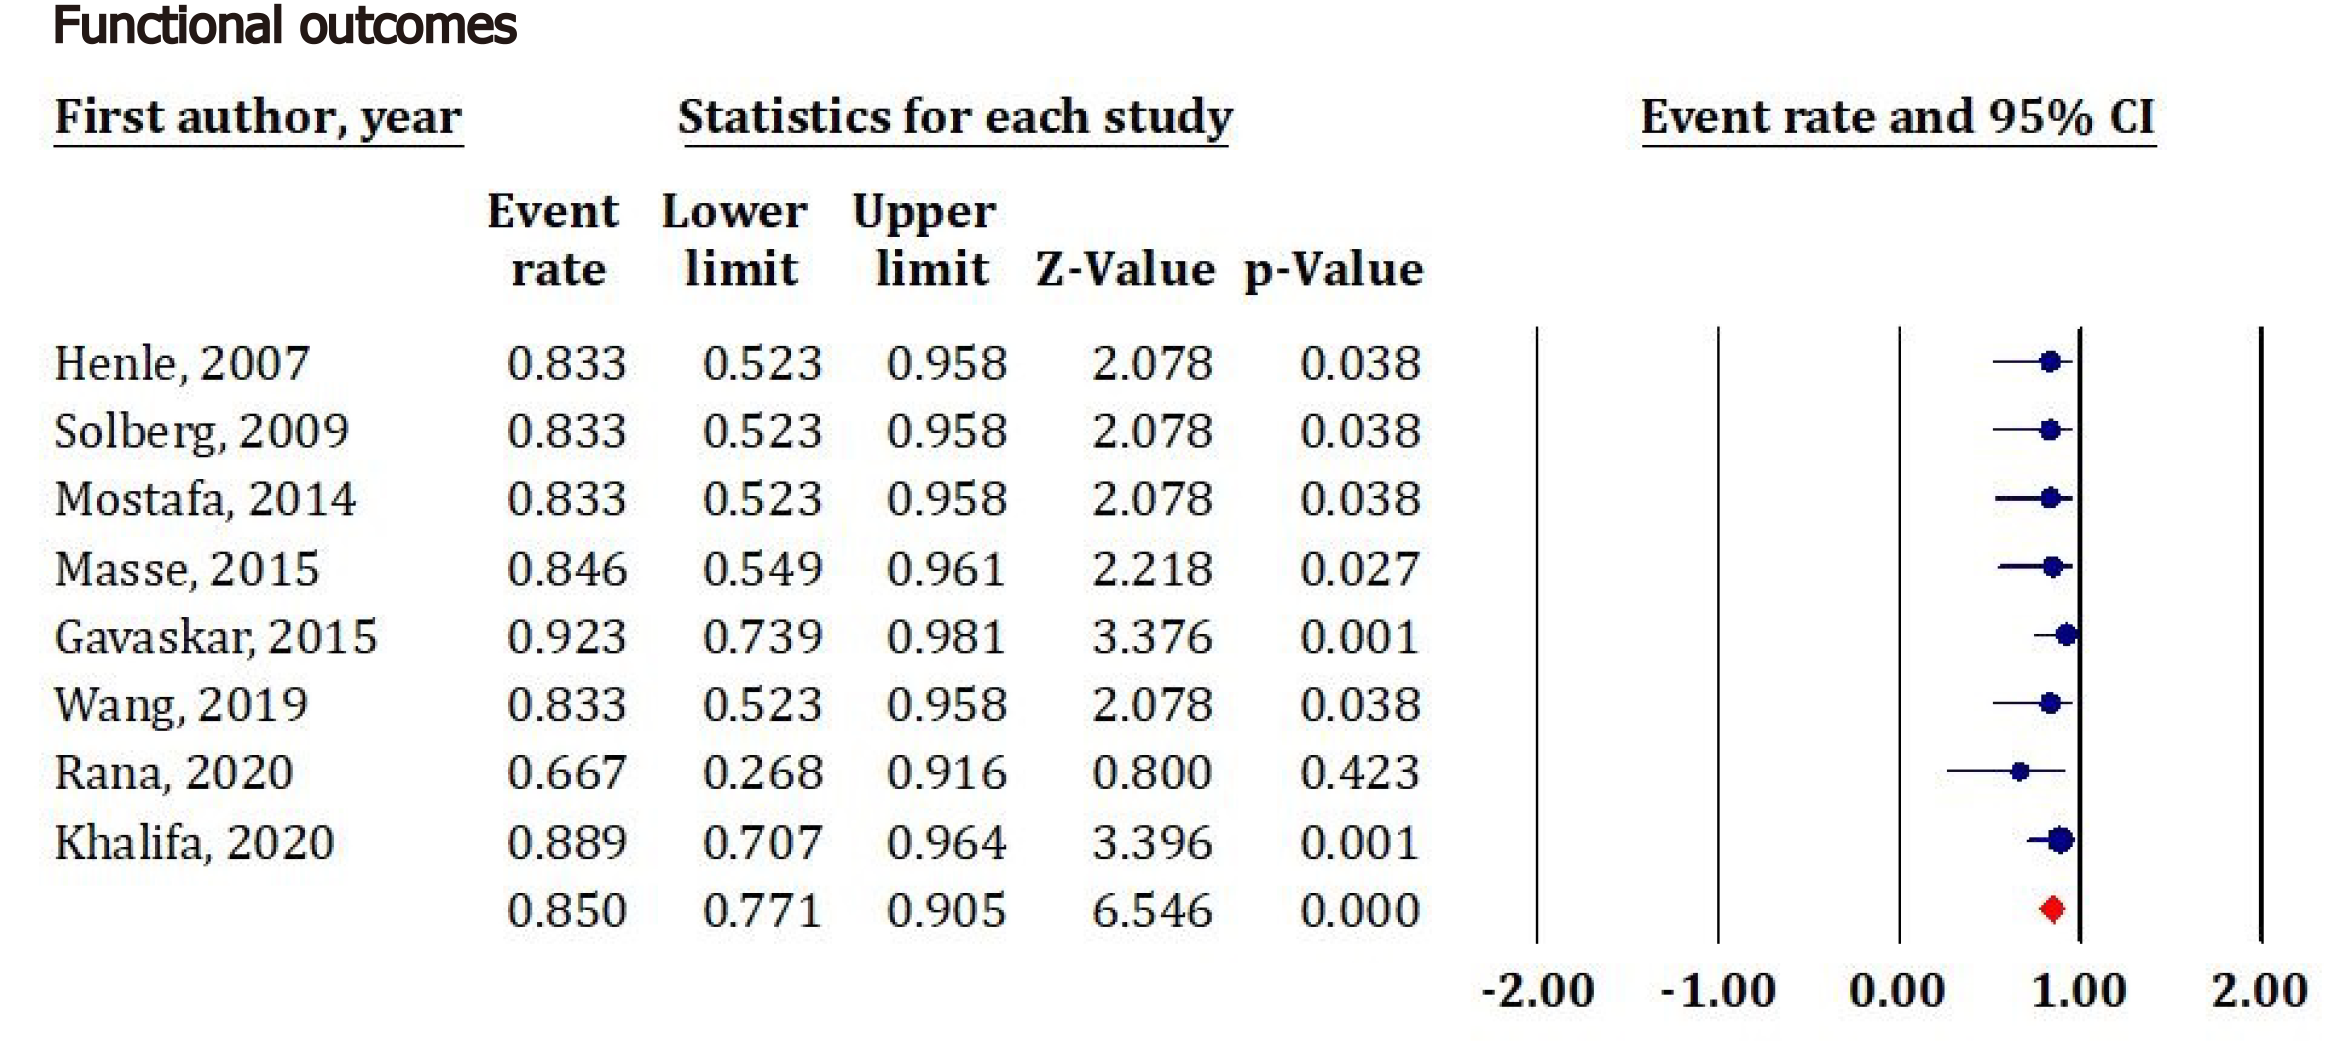
Figure 2 Forest plot diagram shows postoperative functional outcomes.
CI: Confidence interval.
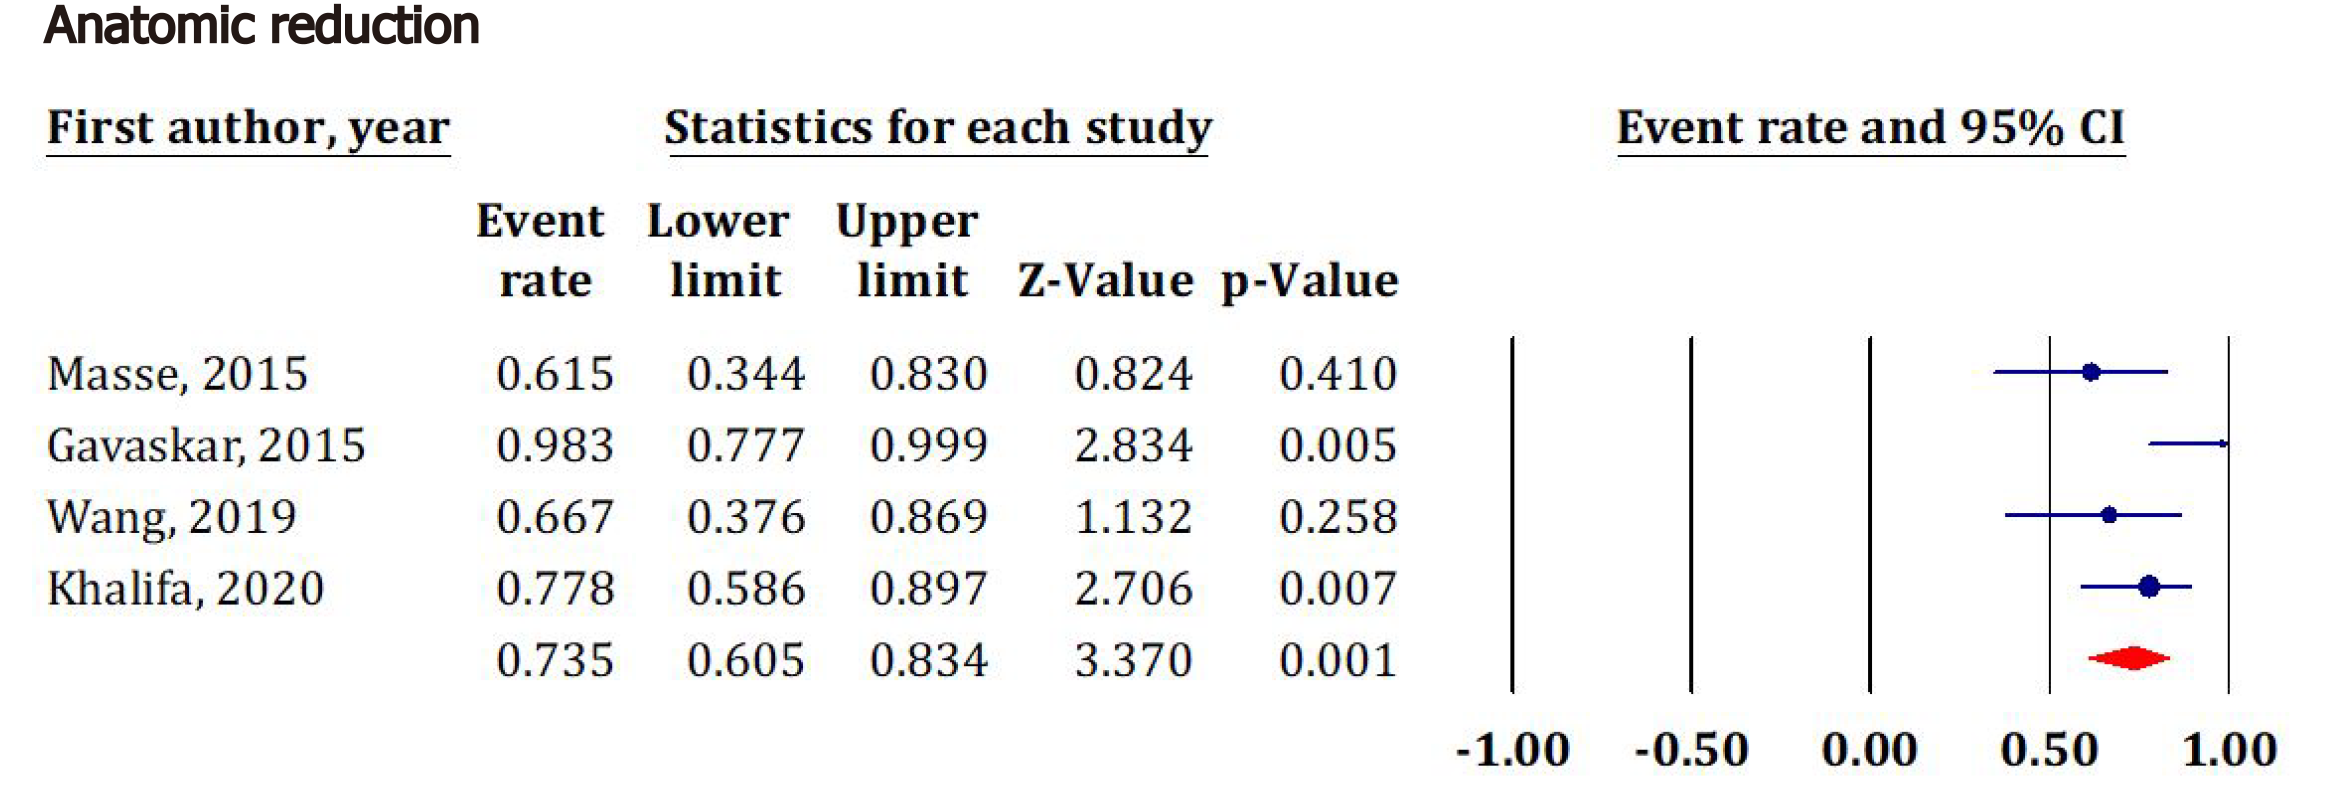
Figure 3 Forest plot diagram shows postoperative anatomical reduction as a representative of radiological outcomes.
CI: Confidence interval.
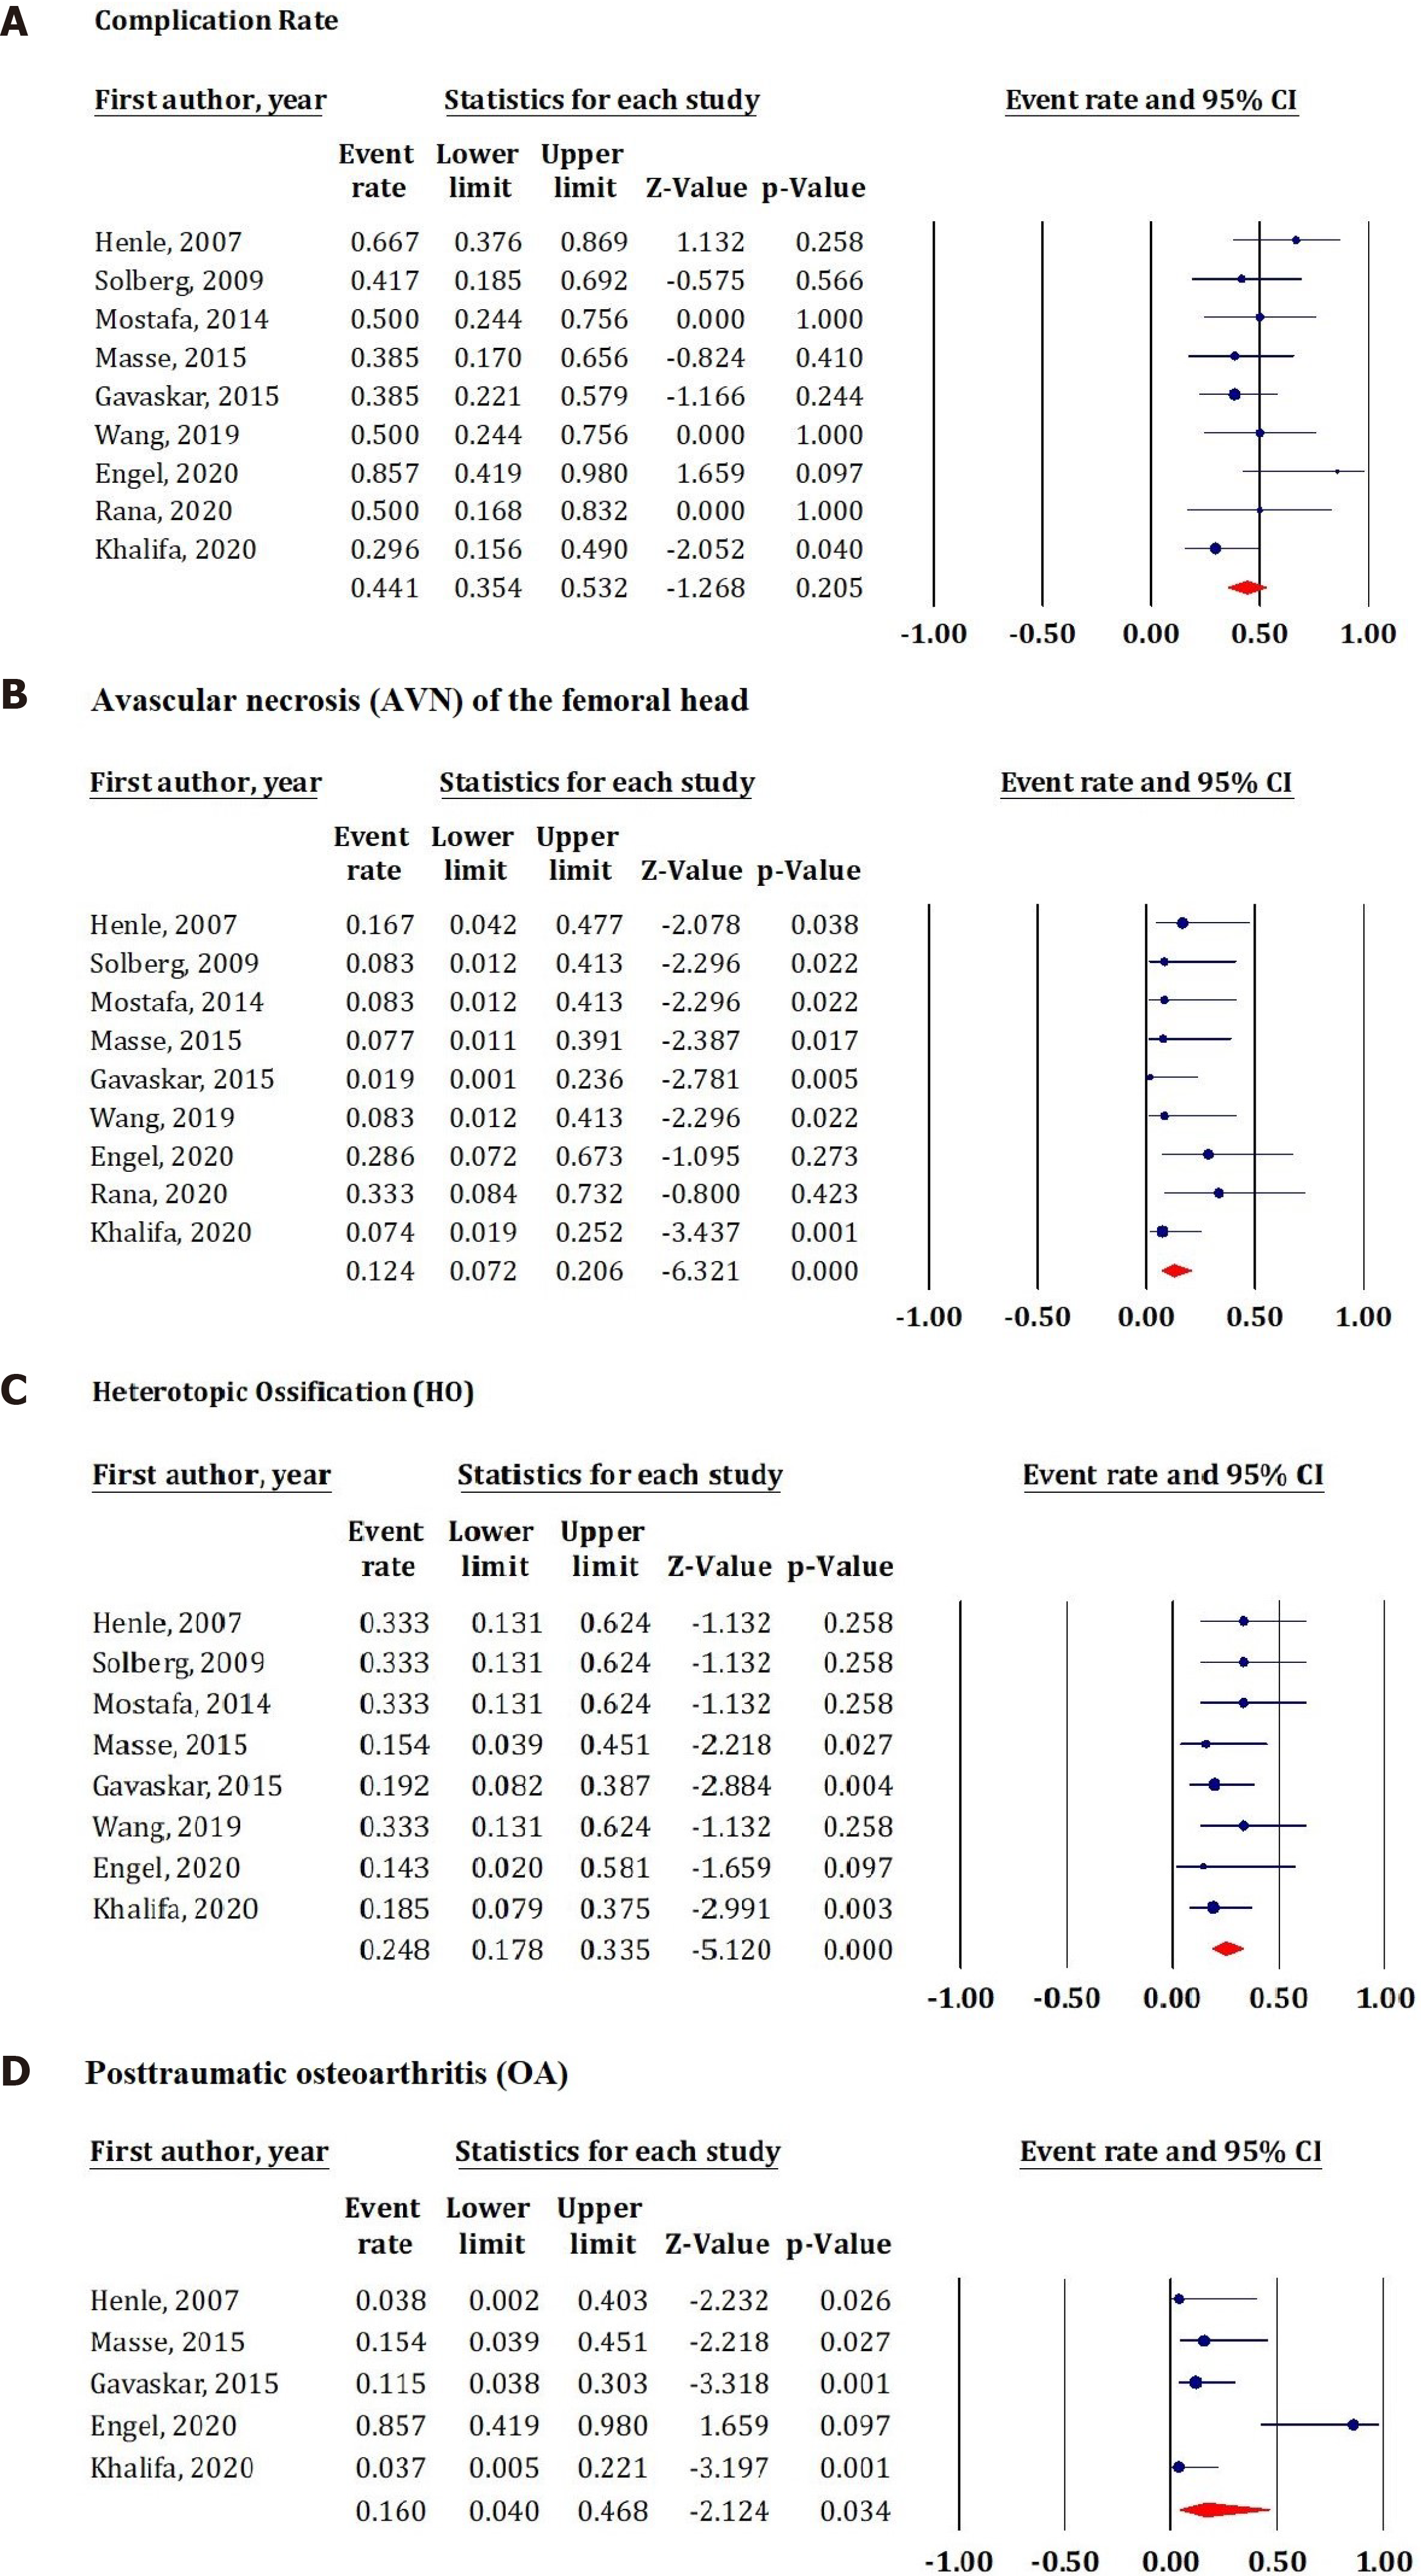
Figure 4 Forest plot diagram shows postoperative complications.
A: Overall complications incidence; B: Avascular necrosis of the femoral head; C: Heterotopic ossification formation; D: Posttraumatic osteoarthritis. AVN: Avascular necrosis; CI: Confidence interval; HO: Heterotopic ossification; OA: Osteoarthritis.
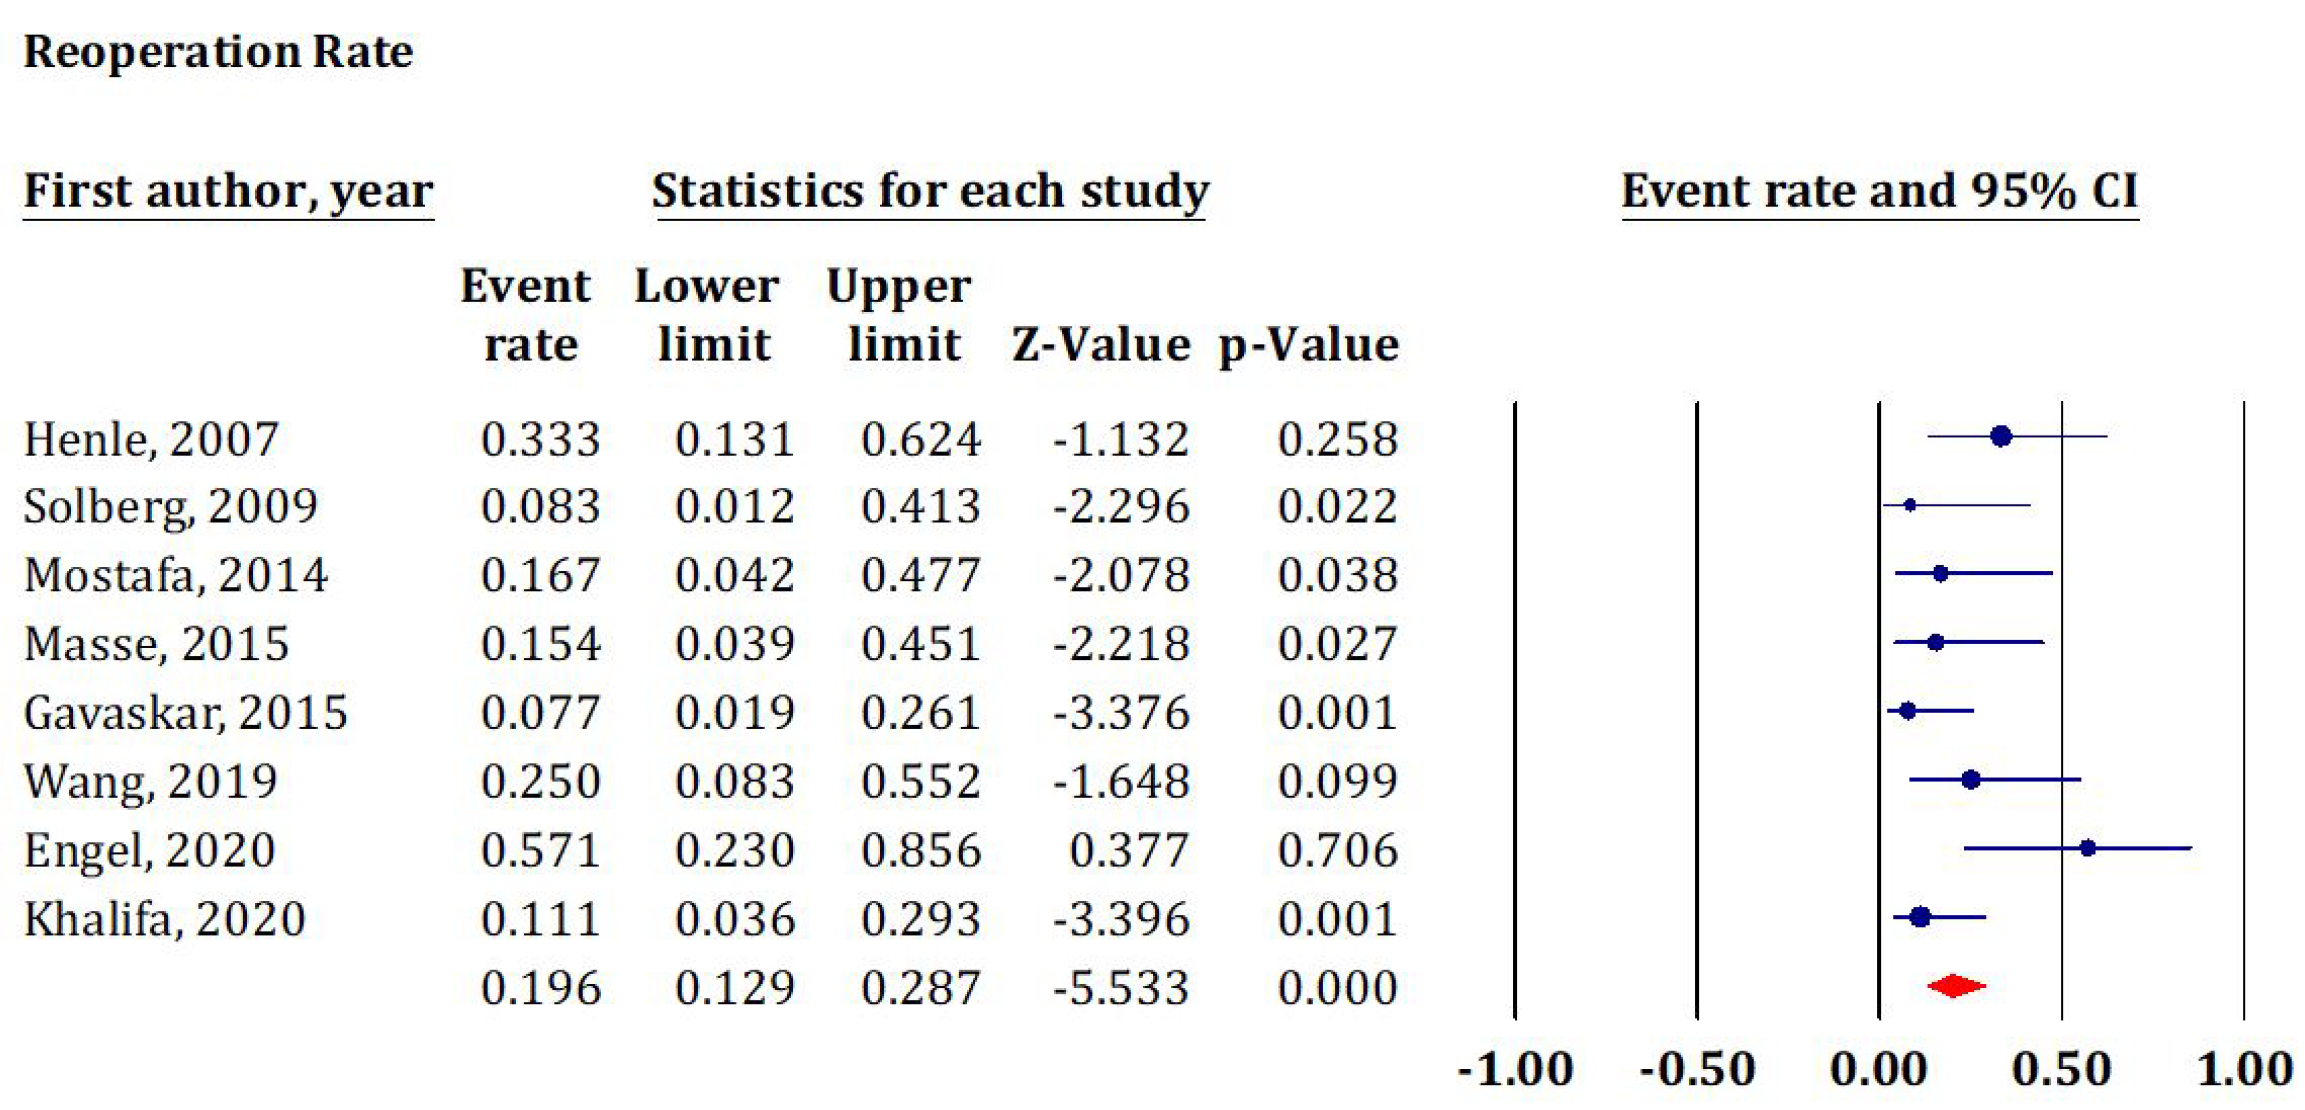
Figure 5 Forest plot diagram shows postoperative reoperation rate.
CI: Confidence interval.
- Citation: Khalifa AA, Haridy MA, Fergany A. Safety and efficacy of surgical hip dislocation in managing femoral head fractures: A systematic review and meta-analysis. World J Orthop 2021; 12(8): 604-619
- URL: https://www.wjgnet.com/2218-5836/full/v12/i8/604.htm
- DOI: https://dx.doi.org/10.5312/wjo.v12.i8.604


