Copyright
©The Author(s) 2018.
World J Radiol. Jun 28, 2018; 10(6): 52-64
Published online Jun 28, 2018. doi: 10.4329/wjr.v10.i6.52
Published online Jun 28, 2018. doi: 10.4329/wjr.v10.i6.52
Figure 1 Direct findings of pulmonary embolism.
A: CE-MRA shows a filling defect in the interlobar artery (white arrow) consistent with the expected appearance of a pulmonary embolus (arrow); B: CE-MRA showing an eccentrically located pulmonary embolus that spans the truncus anterior and interlobar artery (arrow); C: Post gadolinium fat saturated breath hold axial spoiled gradient echo image showing bilateral filling defects in the lower lobe pulmonary arteries (interlobar PE-dashed arrow, left lower lobe pulmonary artery-arrow). CE-MRA: Contrast enhanced magnetic resonance angiograph; PE: Pulmonary embolism.
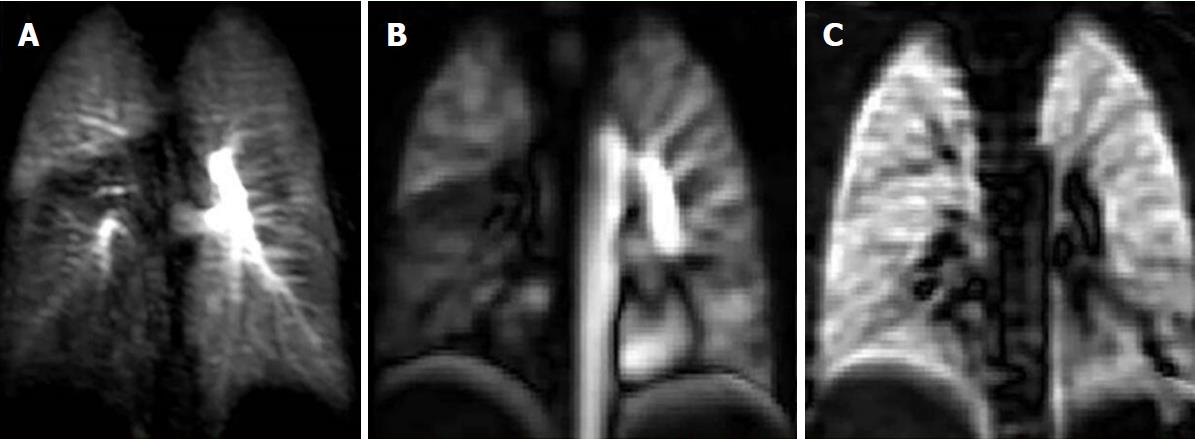
Figure 2 Case of pulmonary embolism to the right lower lobe.
A: Coronal dynamic contrast MRI shows notable right lower lobe hypo-perfusion in a 25-year-old female with known acute pulmonary embolism one month ago; B: Corresponding (non-contrast) Fourier decomposition (FD) perfusion; C: Ventilation-weighted FD MR images also depict right lower lobe hypo-perfusion and normal ventilation (VQ mismatch). MRI: Magnetic resonance imaging.
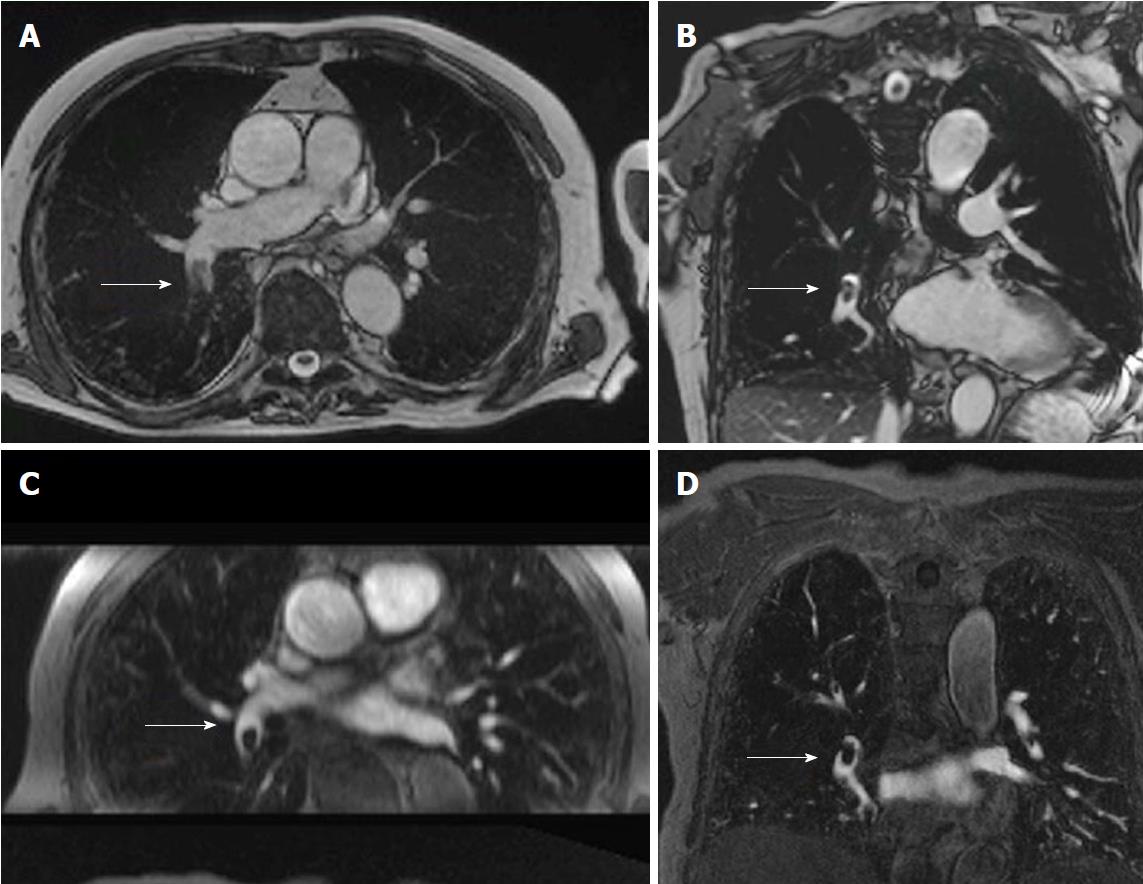
Figure 3 Non-contrast pulmonary magnetic resonance angiograph of an 82-year-old male with a history of san acute onset of dyspnea.
A: Transverse non-contrast enhanced steady state GRE; B: Coronal oblique non-contrast enhanced steady-state GRE images of a fresh embolus in the right lower lobe artery; C: For comparison the transverse reformation; D: The original coronal images from the contrast-enhanced MRA (images courtesy of Heussel CP and Wielpuetz M, Thoraxklinik, Heidelberg, Germany). GRE: Gradient recalled echo; MRA: Magnetic resonance angiograph.
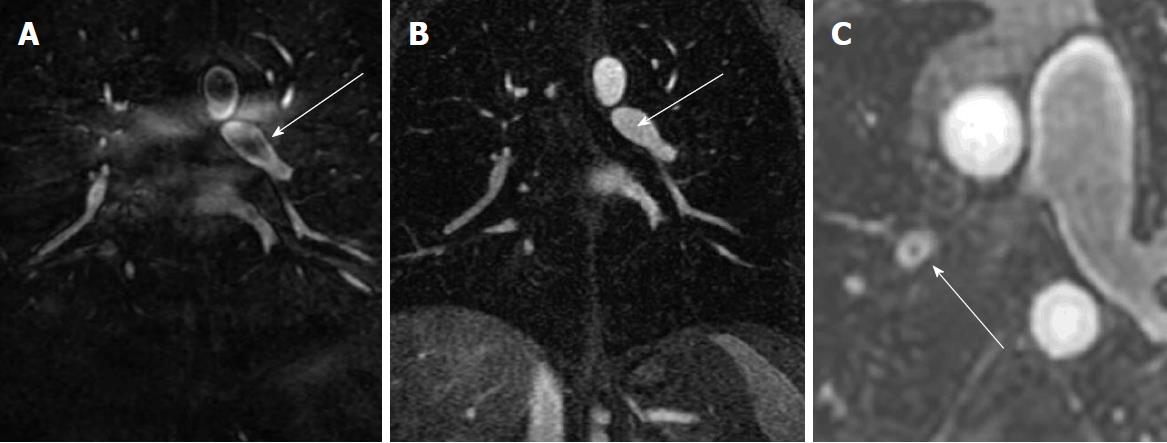
Figure 4 Artifacts: The Maki artifact.
A: Acquisition of the central aspect of k-space was before the bolus of contrast agent filled the pulmonary artery causing a pseudo-clot within the left lower lobe pulmonary artery (arrow); B: Later phase acquisition from the same patient shows normal contrast enhancement of the Left lower lobe pulmonary artery (arrow); C: Gibbs’’ ringing artifact can simulate a central filling defect. Typically, the signal of emboli will be less than 50% of the signal intensity of the lumen.
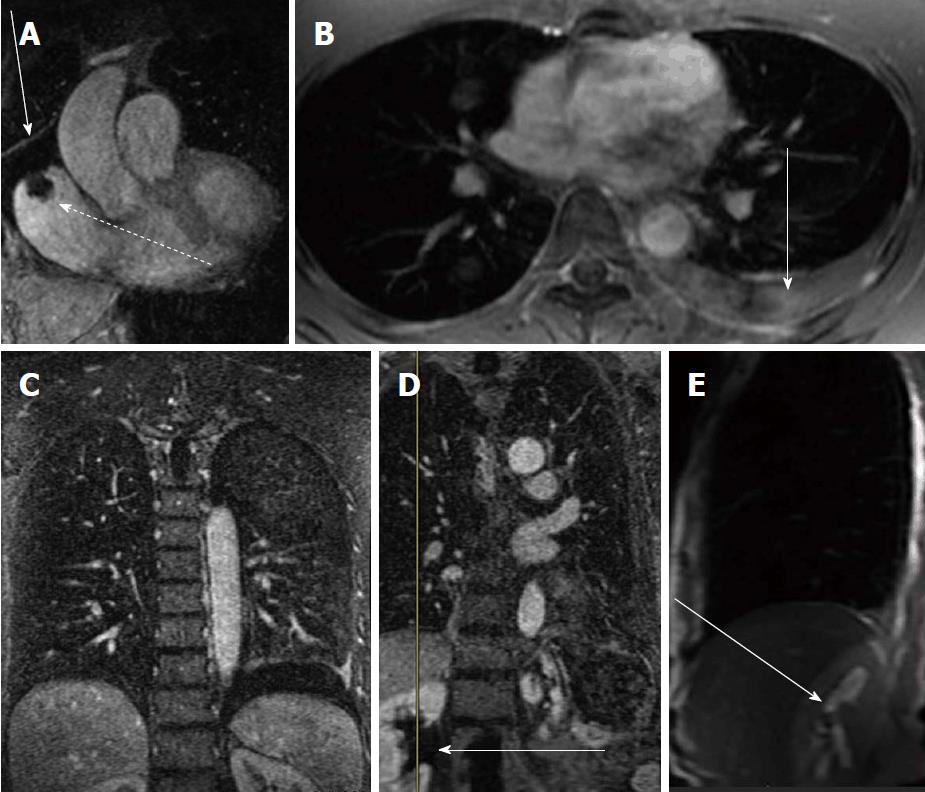
Figure 5 Ancillary findings on contrast enhanced magnetic resonance angiograph exams.
A: Contrast enhanced MRA shows a right atrial thrombus from a long standing indwelling central venous catheter (dashed arrow) and a pericardial effusion (straight arrow); B: Post contrast breath hold fat saturated gradient echo showing a left pleural effusion (arrow); C: CE-MRA coronal image showing the same left pleural effusion ( arrow); D: CE-MRA showing right renal pelvis hydronephrosis (arrow); E: Fast spin echo scout sagittal image through the right renal pelvis showing the high signal intensity of the hydronephrosis (arrow). CE-MRA: Contrast enhanced magnetic resonance angiograph.
- Citation: Tsuchiya N, Beek EJV, Ohno Y, Hatabu H, Kauczor HU, Swift A, Vogel-Claussen J, Biederer J, Wild J, Wielpütz MO, Schiebler ML. Magnetic resonance angiography for the primary diagnosis of pulmonary embolism: A review from the international workshop for pulmonary functional imaging. World J Radiol 2018; 10(6): 52-64
- URL: https://www.wjgnet.com/1949-8470/full/v10/i6/52.htm
- DOI: https://dx.doi.org/10.4329/wjr.v10.i6.52


