©The Author(s) 2015.
World J Cardiol. Oct 26, 2015; 7(10): 671-684
Published online Oct 26, 2015. doi: 10.4330/wjc.v7.i10.671
Published online Oct 26, 2015. doi: 10.4330/wjc.v7.i10.671
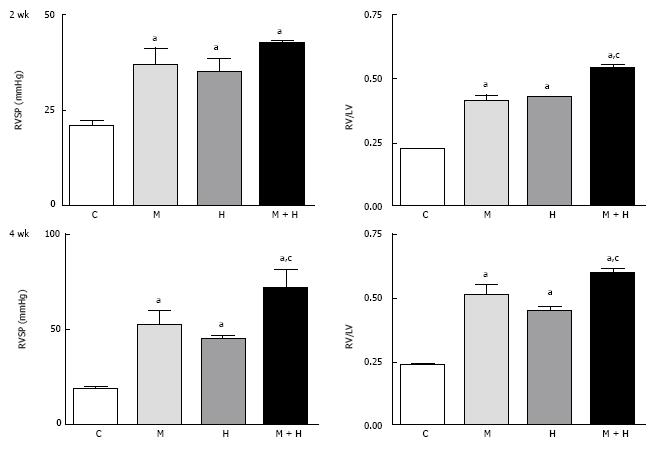
Figure 1 This figure depicts right ventricular systolic pressure and right ventricular hypertrophy in controls, monocrotaline, hypoxia and monocrotaline + hypoxia at 2 (n = 5-8) and 4 wk (n = 6-10).
aP < 0.05 vs C, cP < 0.05 vs M and H. RVSP: Right ventricular systolic pressure; C: Controls; M: Monocrotaline; H: Hypoxia; M + H: Monocrotaline + hypoxia.
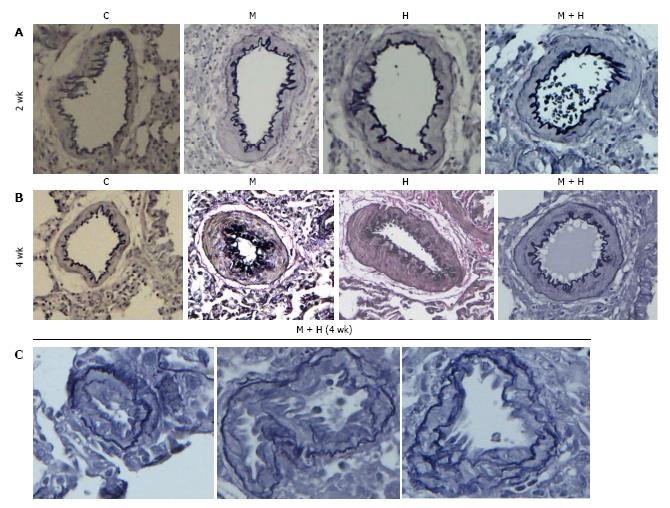
Figure 2 Pulmonary arteries (experimental groups).
A and B: Pulmonary arteries (size 200-317 μm) from the controls and different experimental groups (elastic van Gieson stain): At 2 and 4 wk, arteries from MCT (M), hypoxia (H) and MCT + hypoxia (M + H) exhibit increased medial wall thickening compared with the control (C). Magnification = × 100; C: Arteries (size 100-155 μm) from 4 wk M + H group showing the presence of neointima. Fragmentation of internal elastic lamina can be seen in these arteries. Magnification = × 400.
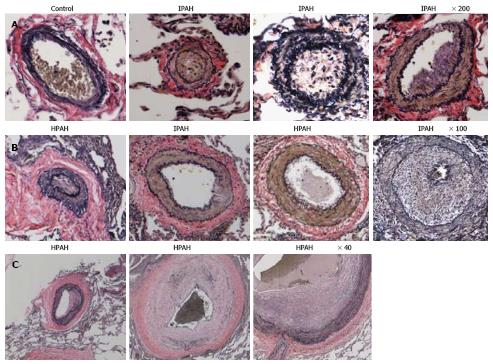
Figure 3 Pulmonary arteries (Human).
A and B: Pulmonary arteries (size 134-323 μm) from a control, IPAH and HPAH patients. Control artery is thin walled. The arteries from patients exhibit varying degrees of muscular thickening, neointima and significant narrowing of the lumen; C: Larger arteries exhibiting vascular remodeling, extensive neointima formation and narrowing of the lumen.
Figure 4 Western blots and bar graphs showing the expression of caveolin-1, caveolin-2 and β actin in controls, monocrotaline, hypoxia and monocrotaline + hypoxia at 2 (n = 3-6) and 4 wk (n = 5-8).
aP < 0.05 vs C, cP < 0.05 vs M. C: Controls; M: Monocrotaline; H: Hypoxia; M + H: Monocrotaline + hypoxia.
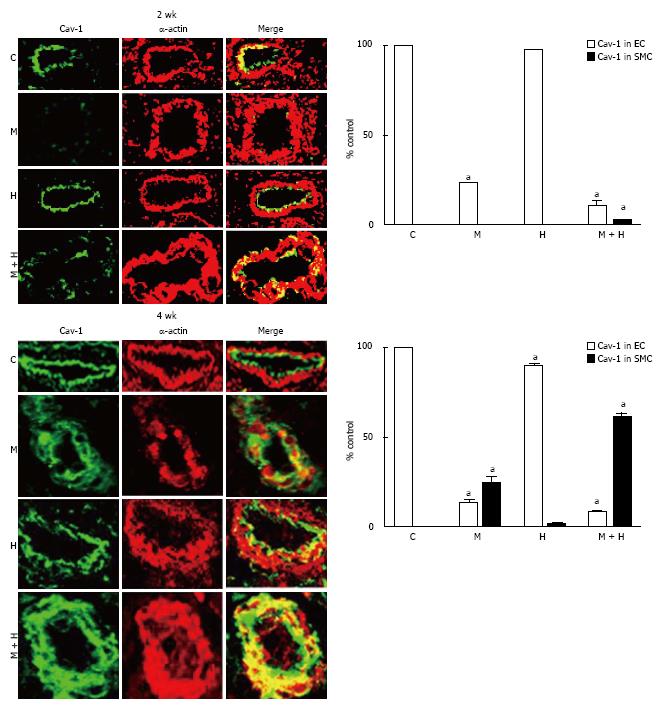
Figure 5 Immunofluorescence study depicting the expression of caveolin-1 (green) and smooth muscle α actin (red) in pulmonary arteries from controls, monocrotaline, hypoxia and monocrotaline + Hypoxia groups at 2 and 4 wk.
The accompanying bar graphs (n = 4-5) shows the % arteries exhibiting the presence of caveolin-1 in endothelium (EC) and in smooth muscle layer (SMC). aP < 0.05 vs C. C: Controls; M: Monocrotaline; H: Hypoxia; M + H: Monocrotaline + hypoxia.
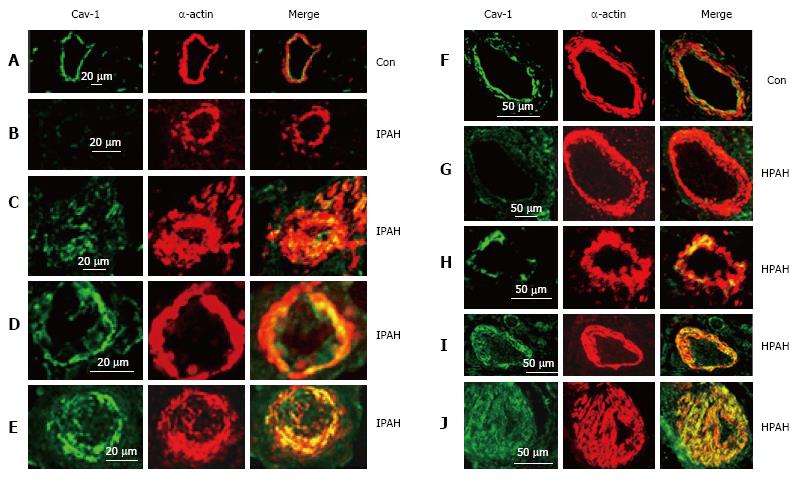
Figure 6 Immunofluorescence study showing the expression of caveolin-1 (green) and smooth muscle α-actin (red) in pulmonary arteries from the controls (A and F), and from the patients with idiopathic pulmonary arterial hypertension (B-E) and with heritable pulmonary arterial hypertension (G-J).
In controls, endothelial caveolin-1 is well preserved and there is no enhanced expression of caveolin-1 in smooth muscle layer. Two arteries each from patients, IPAH (B and C), HPAH (G and F) show loss of endothelial caveolin-1 in B and G, and the appearance of increased expression of caveolin-1 in SMC in C and H. The next panels D, E, I and J from 4 different patients show loss of endothelial caveolin-1 and enhanced expression of caveolin-1 in SMC. PAH: Pulmonary arterial hypertension; IPAH: Idiopathic PAH; HPAH: Heritable PAH; SMC: Smooth muscle cells.
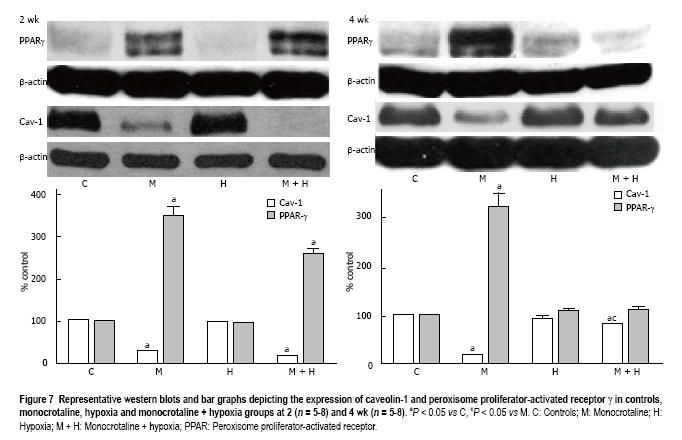
Figure 7 Representative western blots and bar graphs depicting the expression of caveolin-1 and peroxisome proliferator-activated receptor γ in controls, monocrotaline, hypoxia and monocrotaline + hypoxia groups at 2 (n = 5-8) and 4 wk (n = 5-8).
aP < 0.05 vs C, cP < 0.05 vs M. C: Controls; M: Monocrotaline; H: Hypoxia; M + H: Monocrotaline + hypoxia; PPAR: Peroxisome proliferator-activated receptor.
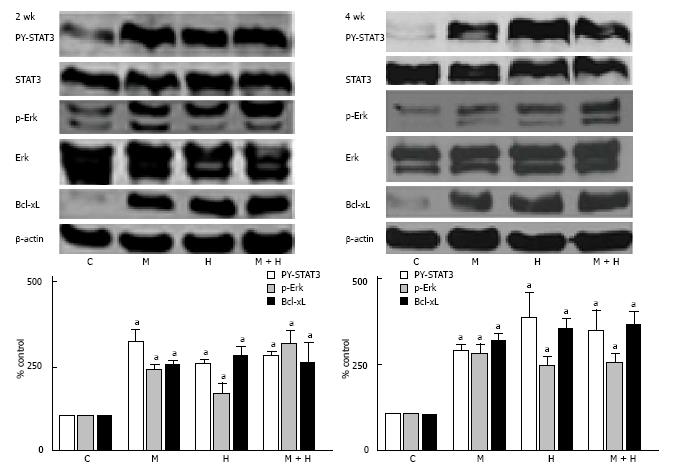
Figure 8 Representative western blots and bar graphs depicting the expression of PY-STAT3, p-Erk and Bcl-xL in controls, monocrotaline, hypoxia and monocrotaline + hypoxia at 2 (n = 4-7) and 4 wk (n = 5-8).
STAT3, Erk and β-actin were used to assess the protein loading. aP < 0.05 vs C. C: Controls; M: Monocrotaline; H: Hypoxia; M + H: Monocrotaline + hypoxia.
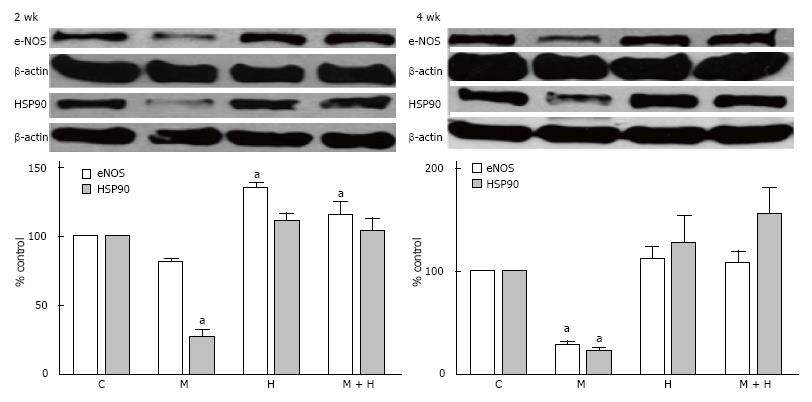
Figure 9 Representative western blots and bar graphs depicting the expression of endothelial nitric oxide synthase, HSP90 and β-actin in controls, monocrotaline, hypoxia and monocrotaline + hypoxia at 2 (n = 3-6) and 4 wk (n = 4-7).
aP < 0.05 vs C. C: Controls; M: Monocrotaline; H: Hypoxia; M + H: Monocrotaline + hypoxia.
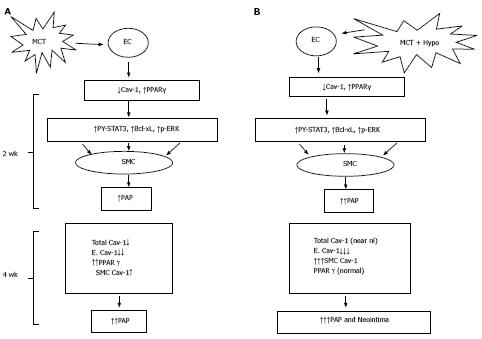
Figure 10 Monocrotaline injury to endothelial cells resulting in the loss of caveolin-1 and the activation of the proliferative pathways (PY-STAT3, Bcl-xL, p-ERK) leading to PH at 2 wk; and a reciprocal relationship between caveolin-1 and peroxisome proliferator-activated receptorγ expression (A) and MCT + hypoxia (MCT + Hypo) accelerates the disease process (B).
At 4 wk, there is a further loss of endothelial caveolin-1 (E. Cav-1) and enhanced expression of cav-1 in smooth muscle cells (SMC), however, the total cav-1 levels remain low (17% vs C, 100%). These alterations are accompanied by a further increase in pulmonary artery pressure. Panel B shows MCT + hypoxia (MCT + Hypo) accelerates the disease process. At 2 wk, extensive endothelial caveolin-1 is accompanied by the activation of proliferative pathways and PH (higher pulmonary artery pressure compared with MCT alone group). At 4 wk, a further loss of E. Cav-1 is accompanied by significantly increased expression of caveolin-1 in SMC compared with MCT alone group. At this stage total caveolin-1 level is closer to normal (81% vs C, 100%), and neointimal lesions can be seen. MCT: Monocrotaline; EC: Endothelial cells; PPAR: Peroxisome proliferator-activated receptor.
- Citation: Huang J, Wolk JH, Gewitz MH, Loyd JE, West J, Austin ED, Mathew R. Enhanced caveolin-1 expression in smooth muscle cells: Possible prelude to neointima formation. World J Cardiol 2015; 7(10): 671-684
- URL: https://www.wjgnet.com/1949-8462/full/v7/i10/671.htm
- DOI: https://dx.doi.org/10.4330/wjc.v7.i10.671


