©2014 Baishideng Publishing Group Inc.
World J Cardiol. Jul 26, 2014; 6(7): 531-538
Published online Jul 26, 2014. doi: 10.4330/wjc.v6.i7.531
Published online Jul 26, 2014. doi: 10.4330/wjc.v6.i7.531
Figure 1 Crude arithmetic mean (A) and adjusted geometric mean (B) of medical expenditure per month over 10 years of follow-up in male and female Japanese medical insurance beneficiaries aged 40-69 years, grouped according to sex and hypertension status.
Analysis of covariance was used to compare log-transformed monthly medical expenditure in each blood pressure category, after adjustment for age, body mass index, smoking habit, drinking habit, serum total cholesterol, and a history of diabetes. From Nakamura et al[6].
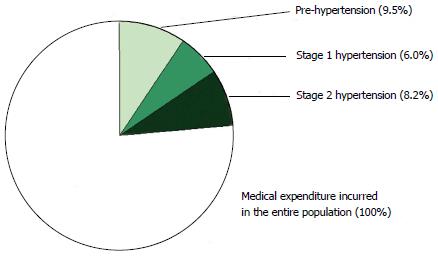
Figure 2 Percentage of medical expenditure attributable to pre-, stage 1, and stage 2 hypertension relative to medical expenditure incurred by the entire population of Japanese medical insurance beneficiaries aged 40-69 years (100%).
From Nakamura et al[6].
Figure 3 Crude arithmetic mean (A) and adjusted geometric mean (B) of medical expenditure per month over 10 years of follow-up in Japanese medical insurance beneficiaries aged 40-69 years, grouped according to hypertension and diabetes status.
Analysis of covariance was used to compare log-transformed monthly medical expenditure in each blood pressure category, after adjustment for age, sex, body mass index, smoking habit, drinking habit, and serum total cholesterol. From Nakamura et al[7].
Figure 4 Crude arithmetic mean (A) and adjusted geometric mean (B) of medical expenditure per month over 10 years of follow-up in male Japanese medical insurance beneficiaries aged 40-69 years, grouped according to hypertension and smoking status.
Analysis of covariance was used to compare log-transformed monthly medical expenditure in each blood pressure category, after adjustment for age, body mass index, drinking habit, serum total cholesterol, and a history of diabetes. From Nakamura et al[8].
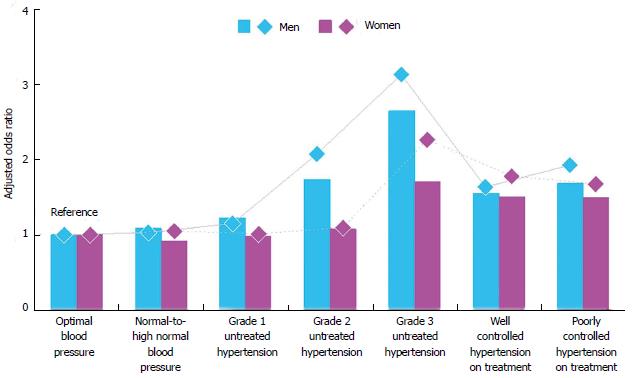
Figure 5 Adjusted odds ratios for two kinds of events over one year of follow-up in male and female Japanese medical insurance beneficiaries aged 40-54 years, grouped according to hypertension status.
The bars represent the risk of undergoing hospitalization for ≥ 14 cumulative days, while the diamonds represent the risk of falling into the top 1% group of medical expenditure. A logistic regression model was used to calculate odds ratios after adjustment for age, body mass index, smoking habit, serum low-density lipoprotein cholesterol, log-transformed fasting plasma glucose, and medications for hypercholesterolemia and diabetes, with the “optimal blood pressure” group acting as the reference. Male and female participants who fell into the sex-specific top 1% medical expenditure group each incurred ≥ 1571 euros/mo and ≥ 1249 euros/mo, respectively (1 euro = 95.91 Japanese yen). From Nakamura et al[11].
- Citation: Nakamura K, Okamura T, Miura K, Okayama A. Hypertension and medical expenditure in the Japanese population: Review of prospective studies. World J Cardiol 2014; 6(7): 531-538
- URL: https://www.wjgnet.com/1949-8462/full/v6/i7/531.htm
- DOI: https://dx.doi.org/10.4330/wjc.v6.i7.531


