©2014 Baishideng Publishing Group Inc.
World J Cardiol. Oct 26, 2014; 6(10): 1067-1079
Published online Oct 26, 2014. doi: 10.4330/wjc.v6.i10.1067
Published online Oct 26, 2014. doi: 10.4330/wjc.v6.i10.1067
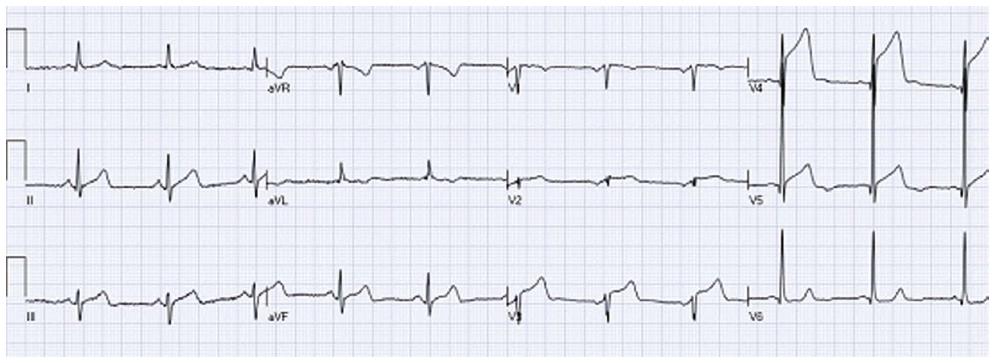
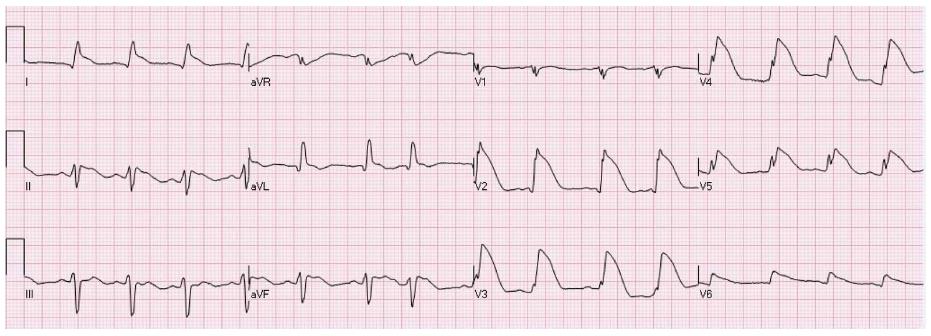
Figure 1 A patient with acute anterior wall ST elevation myocardial infarctions with concave form of ST elevation in the precordial leads (V3-V5).
Coronary angiography revealed mid left anterior descending occlusion and primary percutaneous coronary intervention was performed.
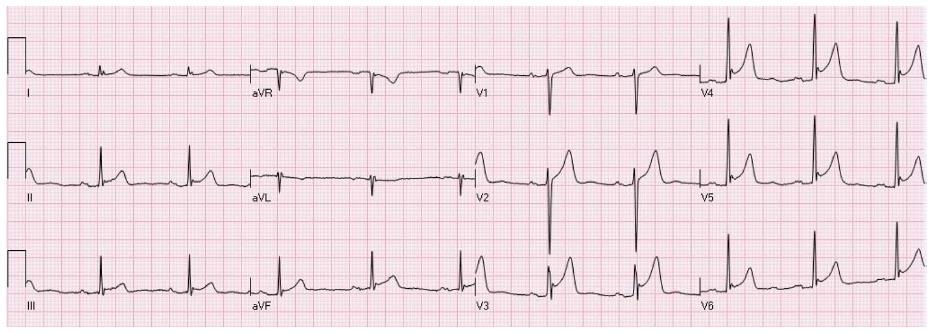
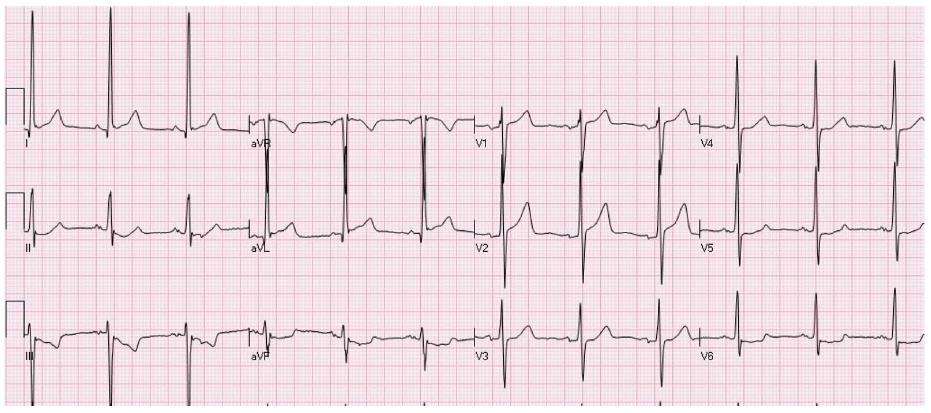
Figure 2 An example of ST elevation due to “early repolarization”.
ST elevation with notched J waves is seen in the inferior and anterolateral leads.
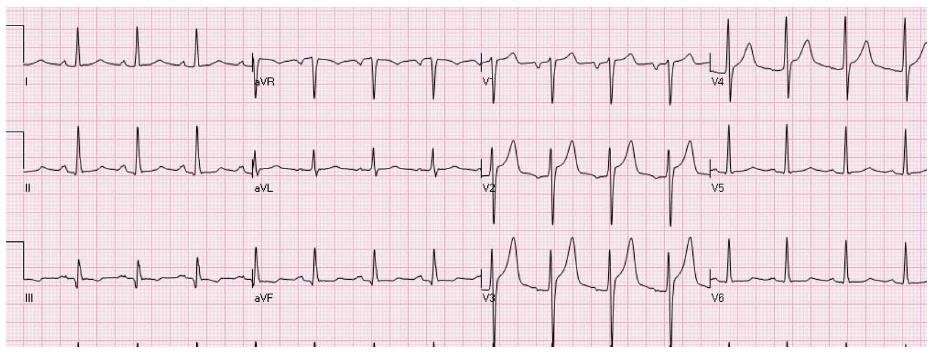
Figure 3 An electrocardiogram of a young male with a “normal variant” concave pattern of ST elevation in leads V2-V4.
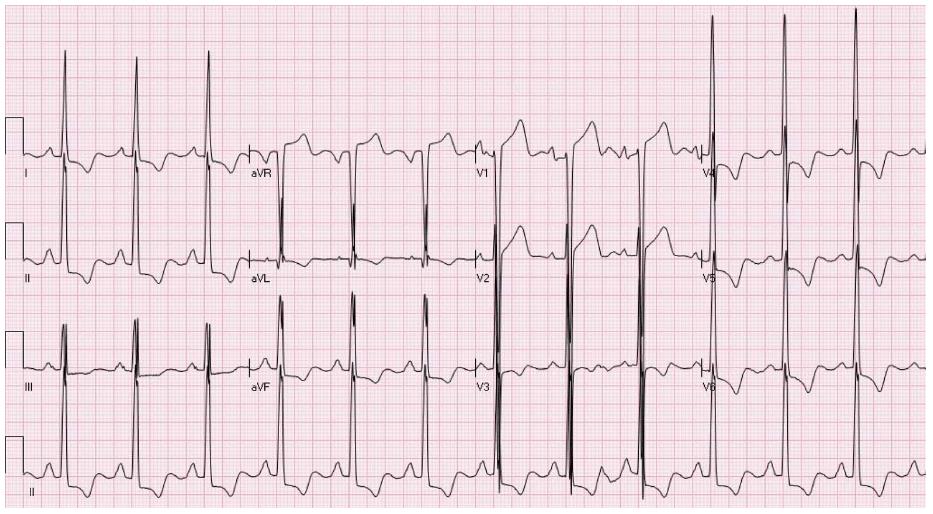
Figure 4 An electrocardiogram showing typical pattern of ST elevation due to hypertrophy of the left ventricular with secondary repolarization changes.
There is ST elevation in leads V1-V2 and ST depression with T wave inversion in the inferolateral leads.
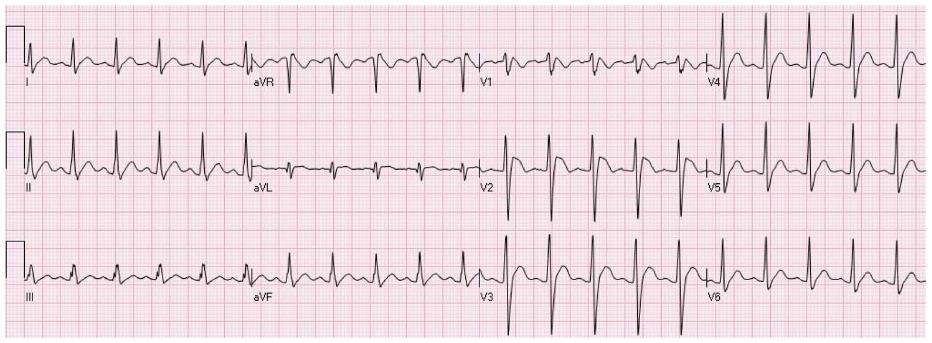
Figure 5 An electrocardiogram of a patient with atypical form of ST elevation secondary to left ventricular hypertrophy.
ST elevation is present in leads I, aVL, V1-V2. Mild ST depression is present in the inferior leads and V5-V6.
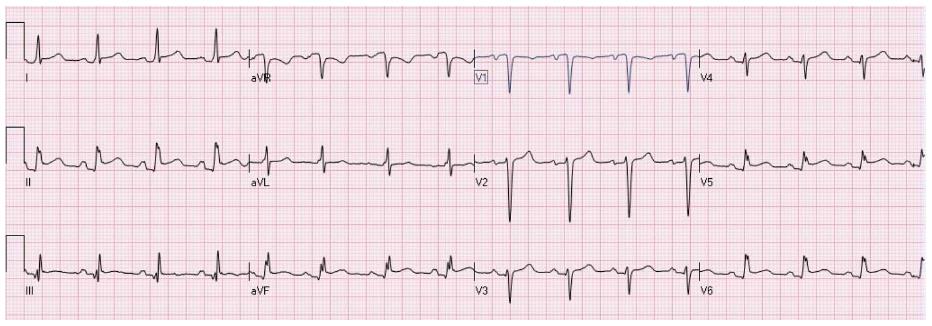
Figure 6 Diffuse ST elevation secondary to acute pericarditis.
There is typical depression of the PR segment (seen mainly in leads II and aVF. There is ST elevation in the inferolateral leads with ST depression in lead aVR.
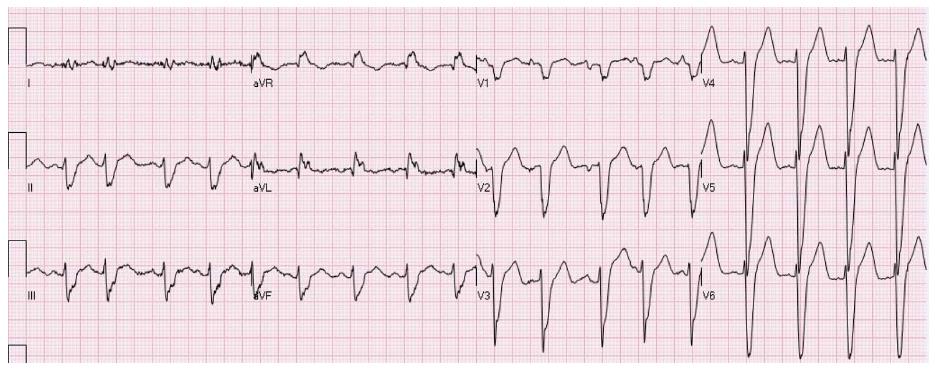
Figure 7 ST elevation secondary to left bundle branch block.
The ST segment vector is directed opposite to the QRS vector. STE is present in the leads with negative QRS deflection (mainly leads V1-V3). There is typical ST depression in the leads with positive QRS deflection (the inferolateral leads).
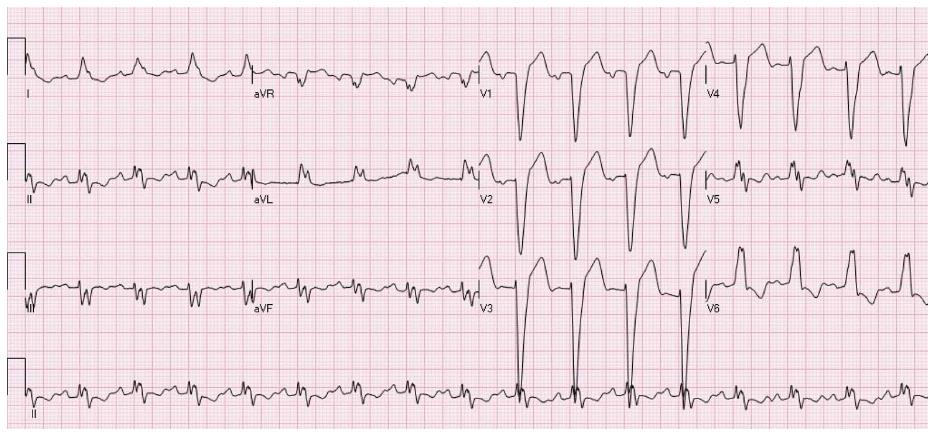
Figure 8 A patient with intraventricular conduction delay.
There is mild elevation of the ST segment in the inferior leads and marked ST elevation in V2-V6. The patient is known to have non-ischemic dilated cardiomyopathy and this is his chronic electrocardiogram pattern.
Figure 9 A patient showing a Brugada pattern with RsR’, elevation of the ST segment and negative T waves in leads V1-V2.
Figure 10 An elderly female patient with ST elevation secondary to Takotsubo.
Angiography of the coronary arteries did not demonstrate significant coronary artery narrowings.
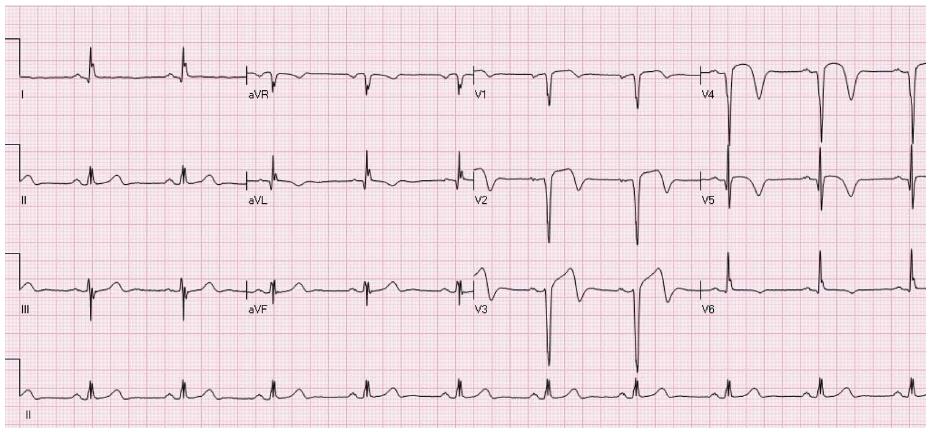
Figure 11 A patient with ST elevation associated with inversion of the terminal portion of the T waves in leads aVL, V1-V5 due to recent anterior ST elevation myocardial infarction.
On presentation symptoms have already subsided.
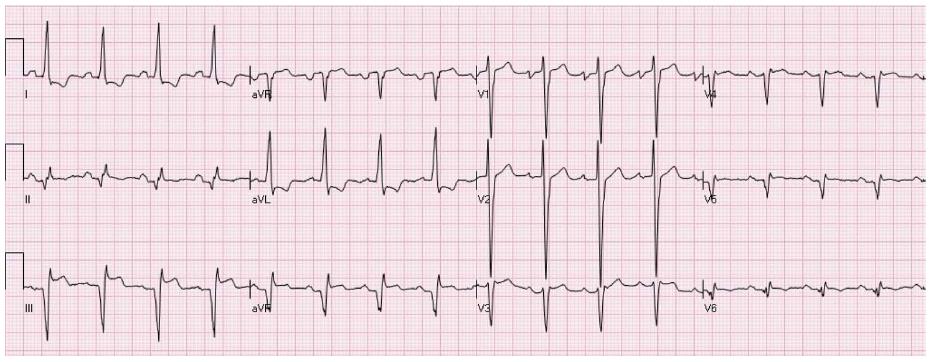
Figure 12 A patient with ST elevation secondary to aneurysm.
There are Q waves in the inferior leads + V5-V6 and tall R waves in V1-V2, secondary to old inferolateral ST elevation myocardial infarctions. There is elevation of the ST segments in the inferior leads associated with reciprocal ST depression in leads I and aVL. The electrocardiogram (ECG) is compatible with both acute evolving inferior ST elevation myocardial infarctions or aneurysm. Comparison to previous ECG showed that this pattern is chronic and compatible with aneurysm.
- Citation: Deshpande A, Birnbaum Y. ST-segment elevation: Distinguishing ST elevation myocardial infarction from ST elevation secondary to nonischemic etiologies. World J Cardiol 2014; 6(10): 1067-1079
- URL: https://www.wjgnet.com/1949-8462/full/v6/i10/1067.htm
- DOI: https://dx.doi.org/10.4330/wjc.v6.i10.1067


