©2012 Baishideng Publishing Group Co.
World J Cardiol. Apr 26, 2012; 4(4): 130-134
Published online Apr 26, 2012. doi: 10.4330/wjc.v4.i4.130
Published online Apr 26, 2012. doi: 10.4330/wjc.v4.i4.130
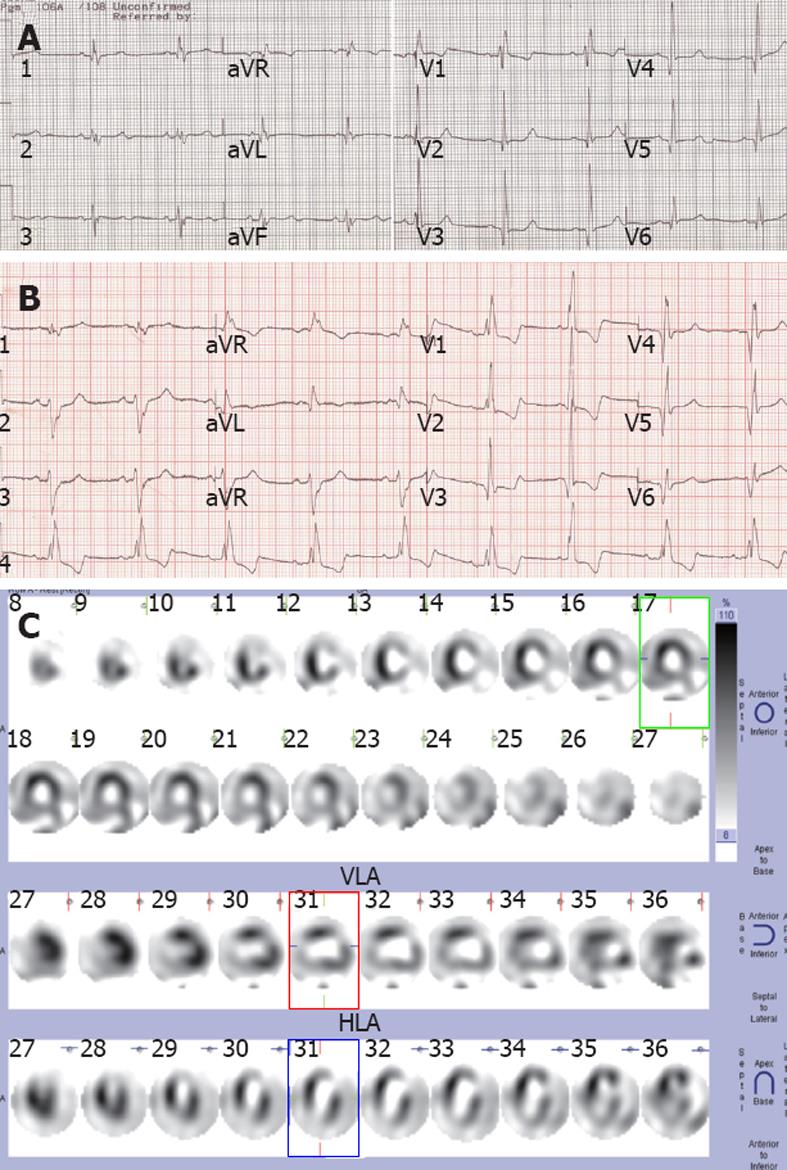
Figure 1 Electrocardiogram and single-photon emission computed tomography.
A: Electrocardiogram in 1993; B: Electrocardiogram in 2007; C: Single-photon emission computed tomography myocardial perfusion image scan shows defects in the anterolateral wall and the apex, and hypoperfusion at the inferiolateral wall.
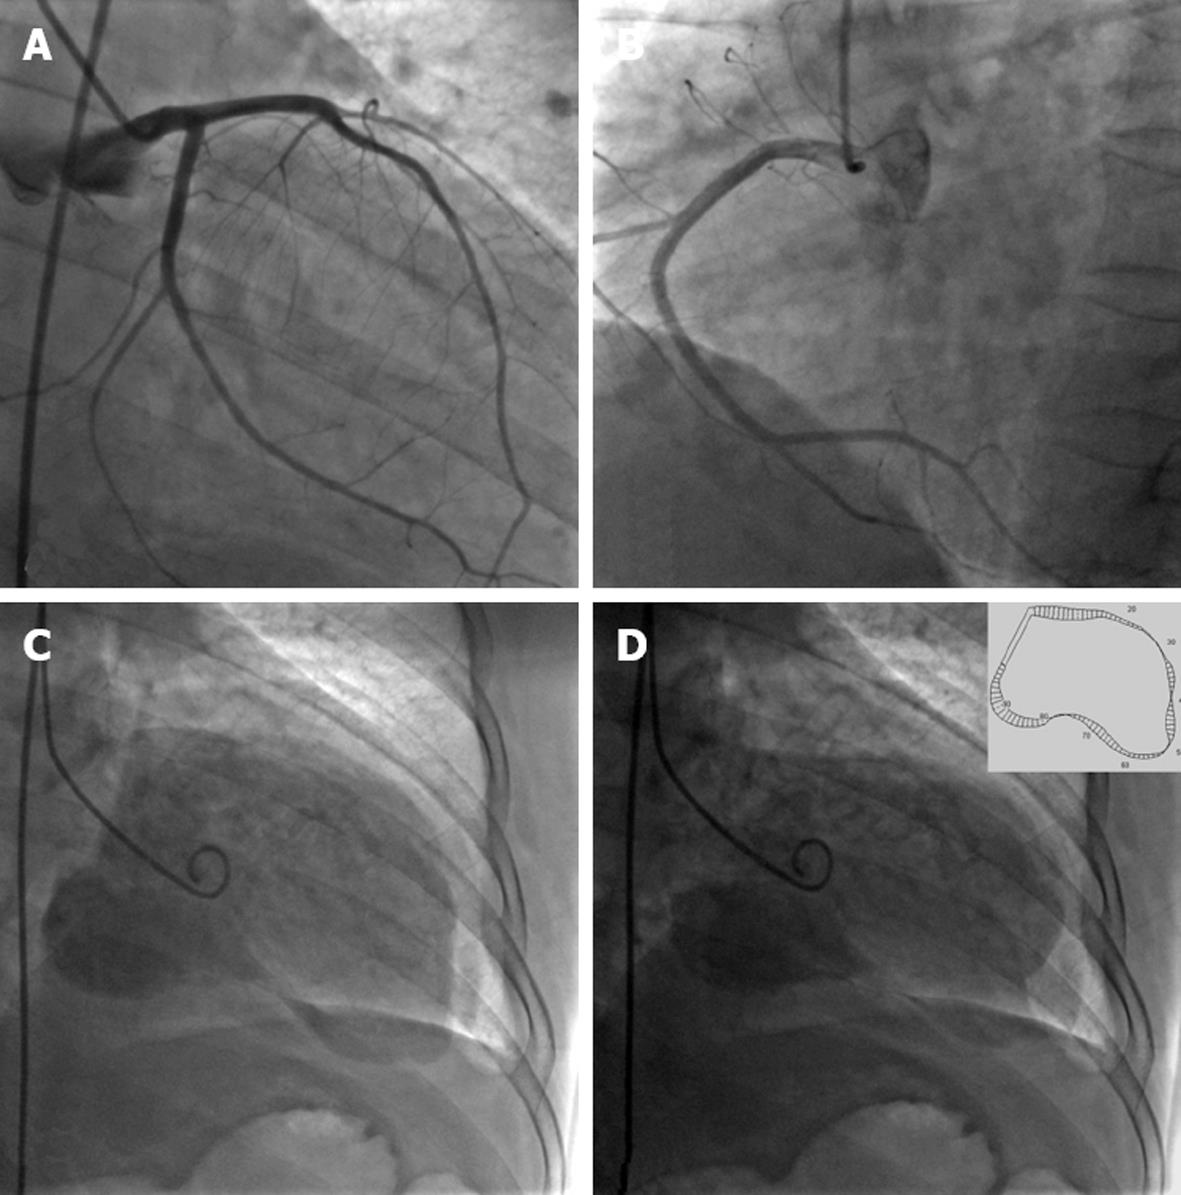
Figure 2 Coronary artery angiogram and left ventriculogram.
A: Right anterior oblique (RAO) projection shows normal left anterior descending artery and left circumflex artery; B: Left anterior oblique projection shows normal right coronary artery; C: RAO projection shows the silhouette of the left ventricle at end diastole; D: RAO projection shows the silhouette of the left ventricle at end systole; the wall motion analysis at the top right shows aneurysms with systolic bulging in the apex and anterolateral wall.
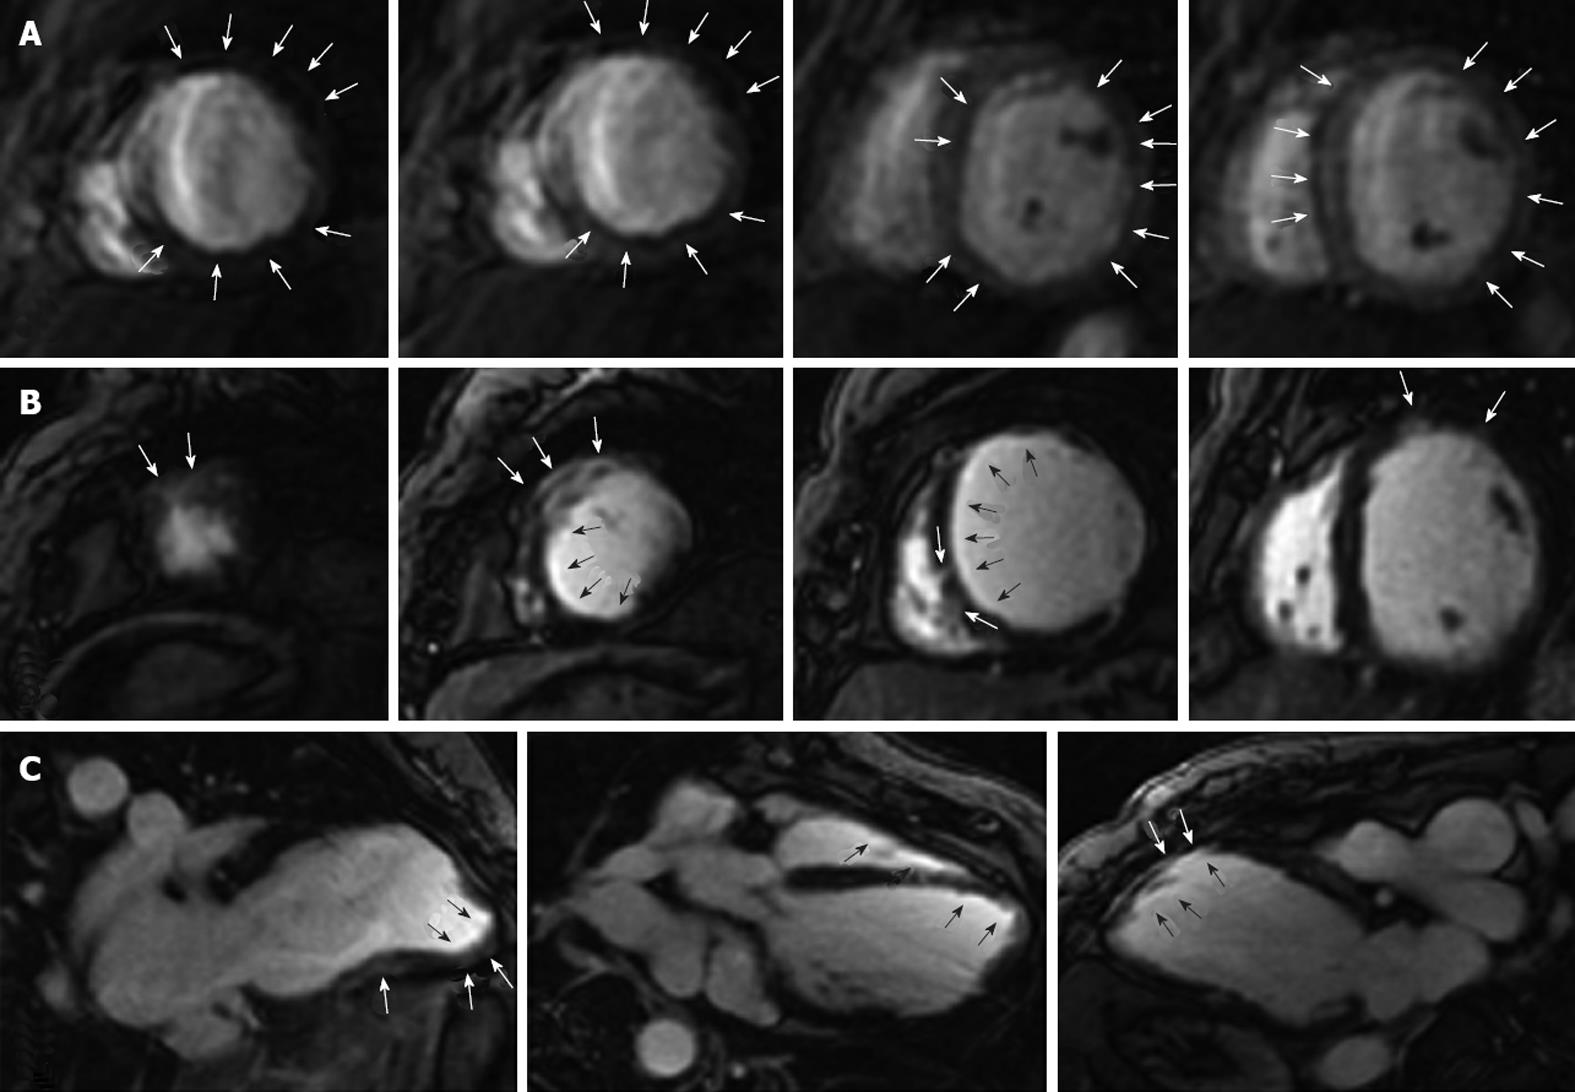
Figure 3 Cardiovascular magnetic resonance imaging.
A: Images of the myocardium at peak myocardial enhancement during the first pass of gadolinium shows the perfusion defect (decreased perfusion) in the subendocardium of the mid-inferior wall, posterior-lateral wall, posterior-septal wall and anterolateral wall of the myocardium (white arrows); B, C: Delayed contrast-enhanced images show transmural hyperenhancement in the apical anterior, mid-anterior, mid-septum, basal-anterior wall (white arrows), and mid myocardial hyperenhancement in the inferior wall. The black arrows show delayed contrast enhancement in the subendocardium.
- Citation: Feng QZ, Cheng LQ, Li YF. Progressive deterioration of left ventricular function in a patient with a normal coronary angiogram. World J Cardiol 2012; 4(4): 130-134
- URL: https://www.wjgnet.com/1949-8462/full/v4/i4/130.htm
- DOI: https://dx.doi.org/10.4330/wjc.v4.i4.130


