©2011 Baishideng Publishing Group Co.
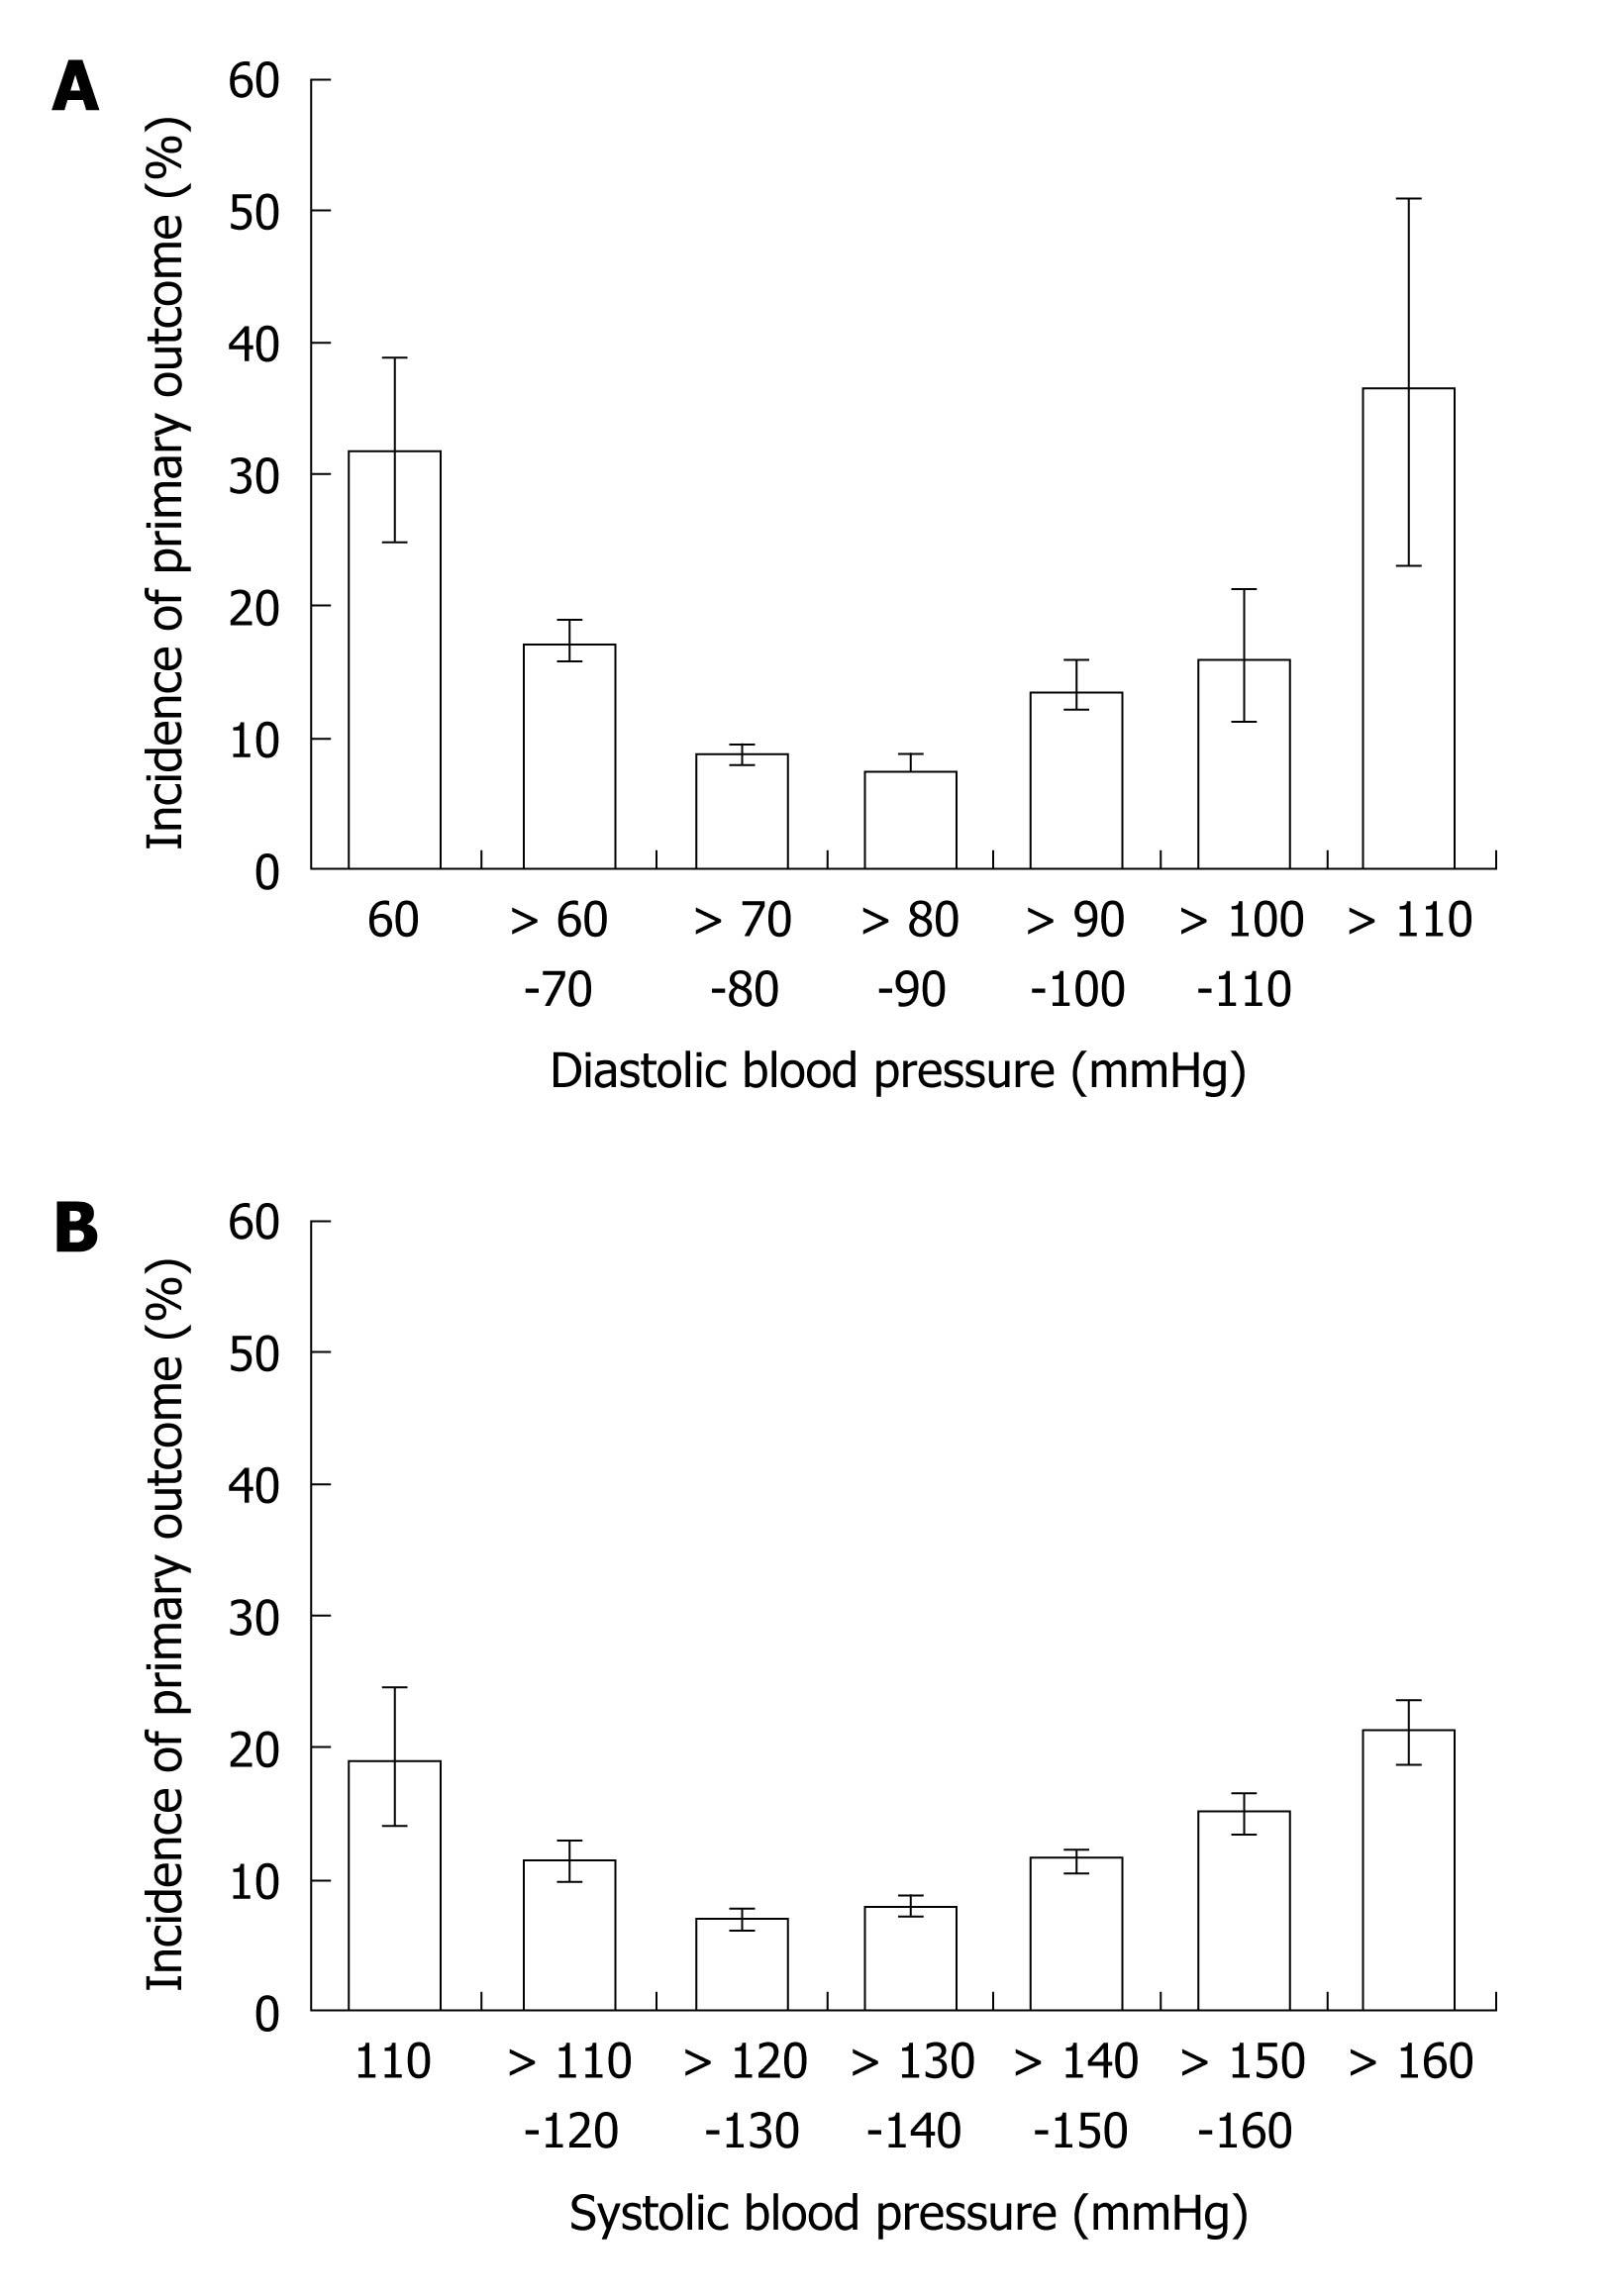
Figure 1 The J-curve effect for diastolic and systolic blood pressure and the first occurrence of all cause death, non-fatal myocardial infarction and non-fatal stroke.
Adapted and modified with permission[9].
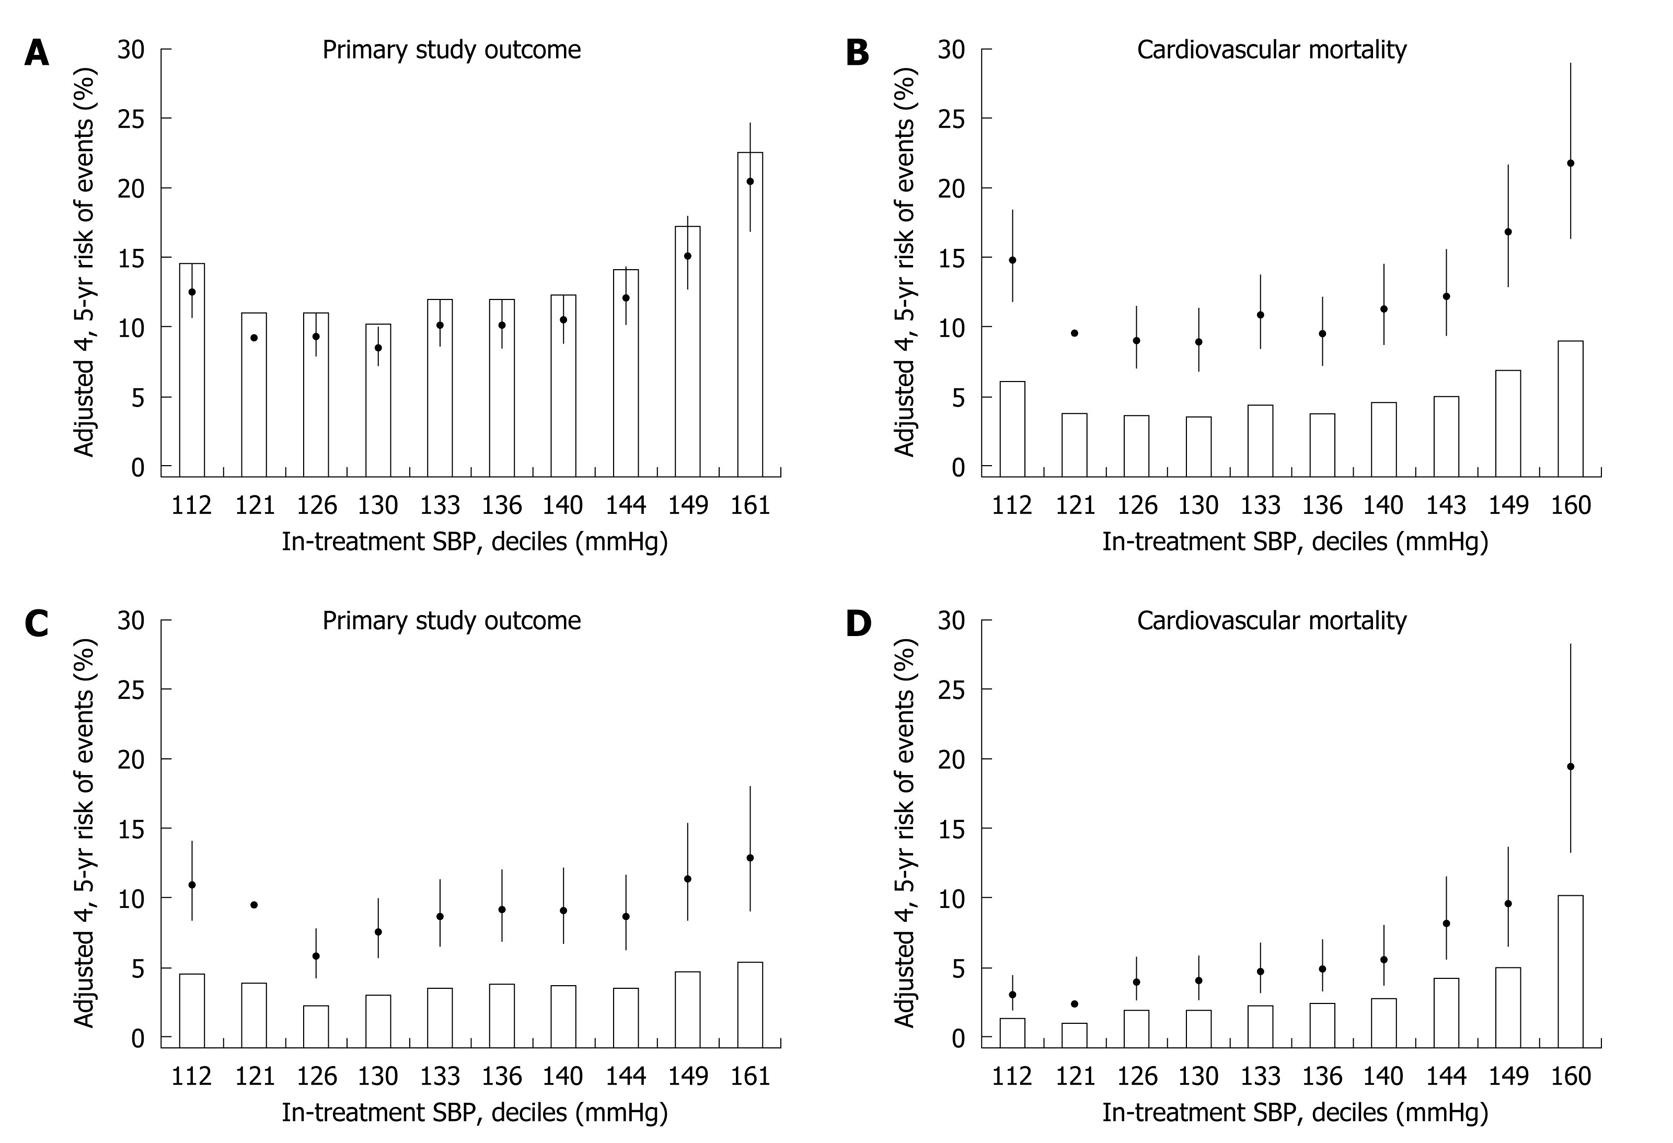
Figure 2 The J-curve effect for systolic blood pressure and the incidence of the primary outcome, cardiovascular mortality and stoke in treated hypertensive patients.
Adapted with permission[10].
- Citation: Chrysant SG. Current status of aggressive blood pressure control. World J Cardiol 2011; 3(3): 65-71
- URL: https://www.wjgnet.com/1949-8462/full/v3/i3/65.htm
- DOI: https://dx.doi.org/10.4330/wjc.v3.i3.65


