©2011 Baishideng Publishing Group Co.
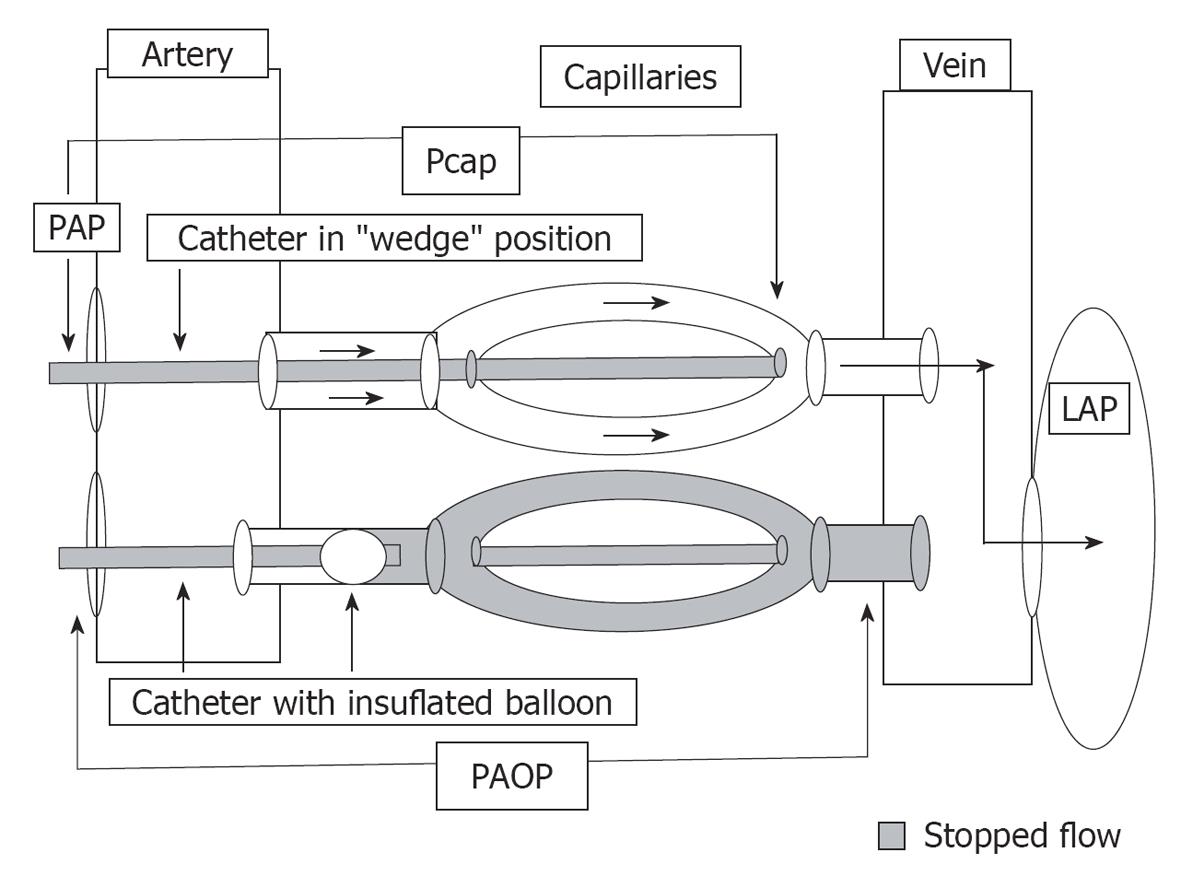
Figure 1 Occluded pulmonary artery pressure vs pulmonary capillary wedge pressure.
Modified from Lupi Herrera et al. Arch Cardiol Mex 2008; 78: 95-113.
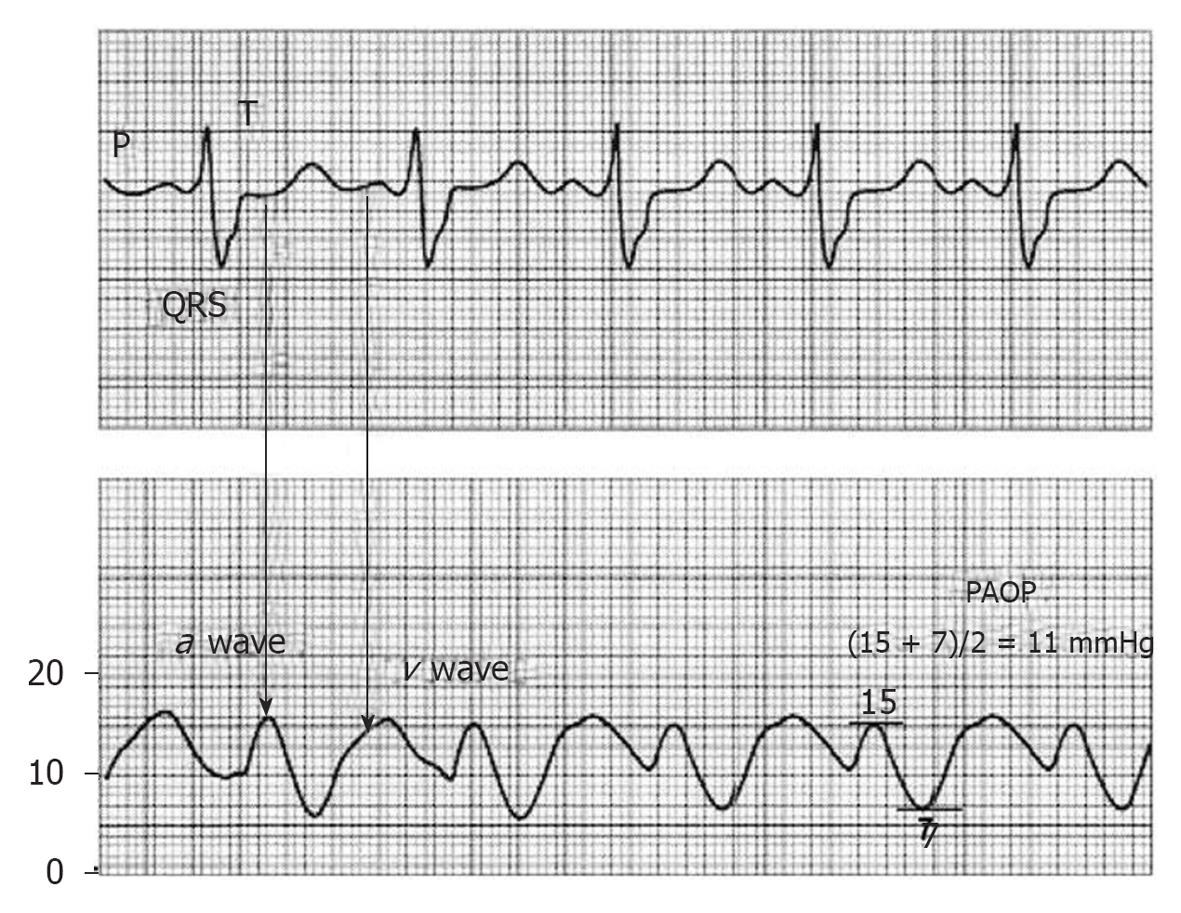
Figure 2 Timing of the pulmonary artery occlusion pressure waves.
PACEP program, http://www.pacep.org.
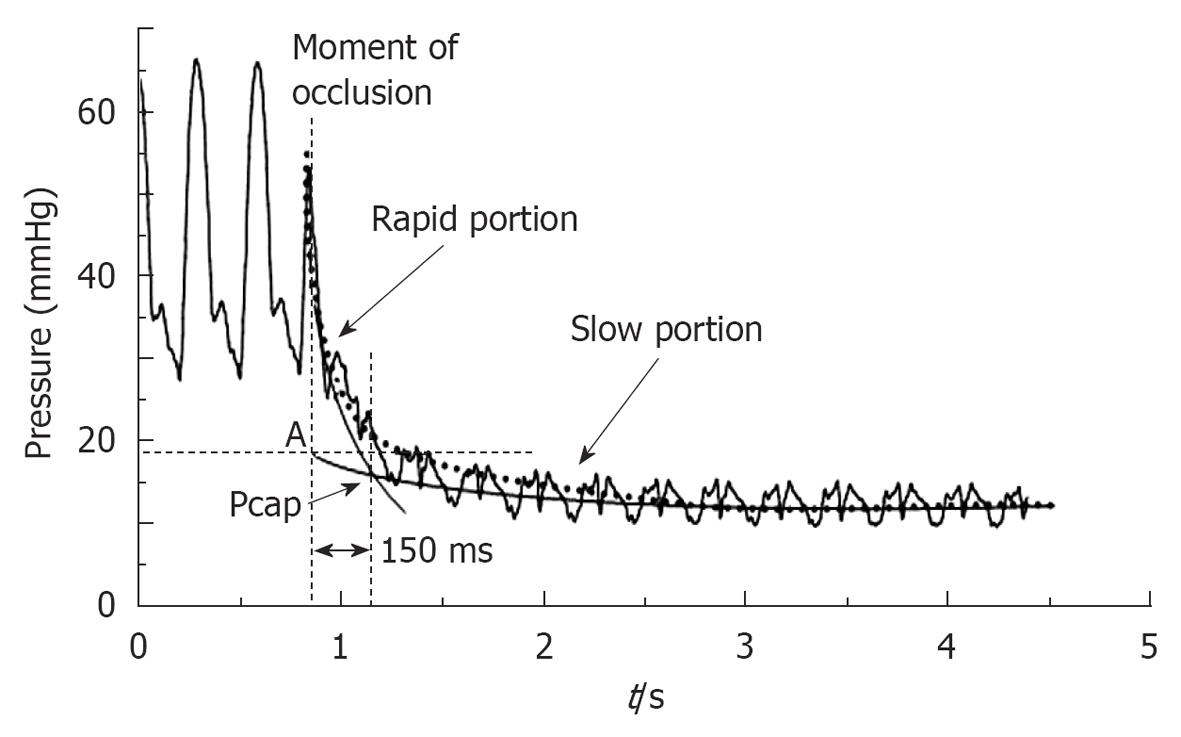
Figure 3 Biexponential curve fitting for estimation of pulmonary capillary pressure (Pcap) by intersection of the fast and the slow components of the pressure decay curve, or by the extrapolation of the exponential fitting of the slow component of the pressure decay curve to the moment of occlusion.
Modified from Souza et al. Critical Care 2005, 9: R132-R138.
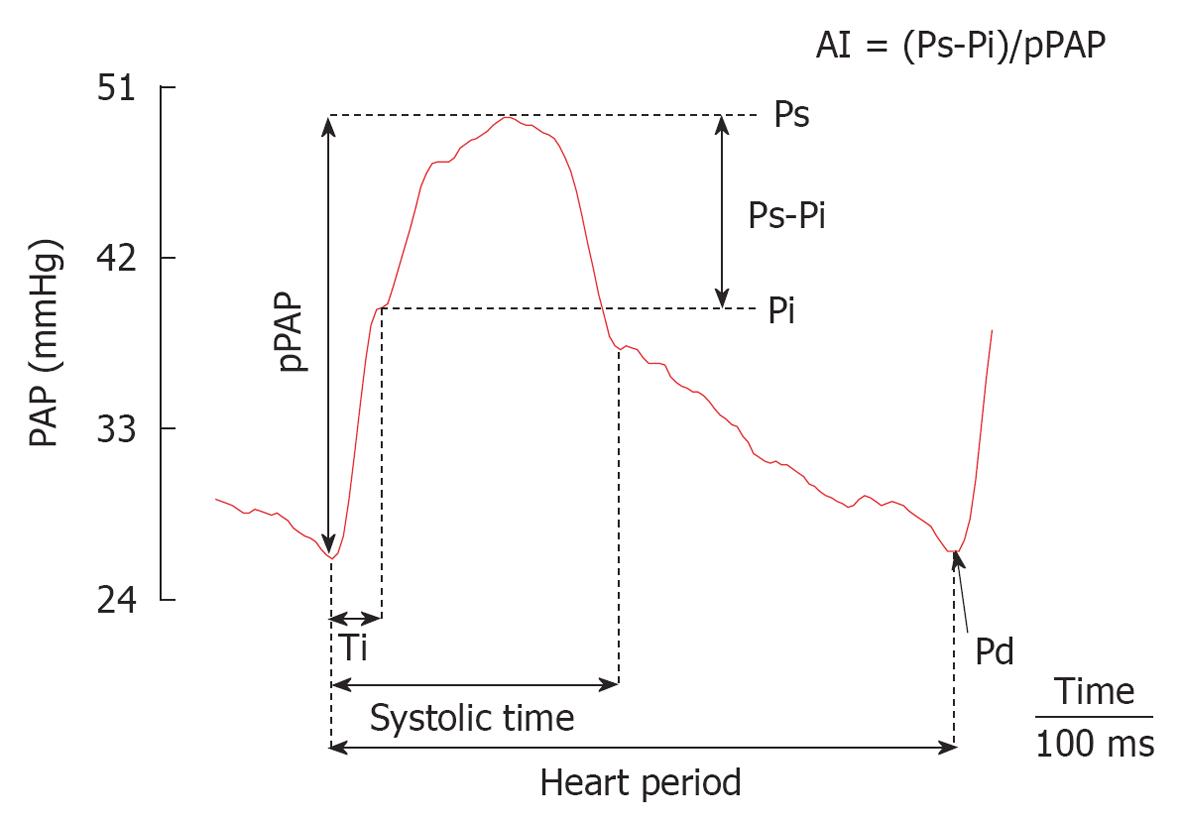
Figure 4 Typical pulmonary artery pressure tracing showing the PA waveform analysis.
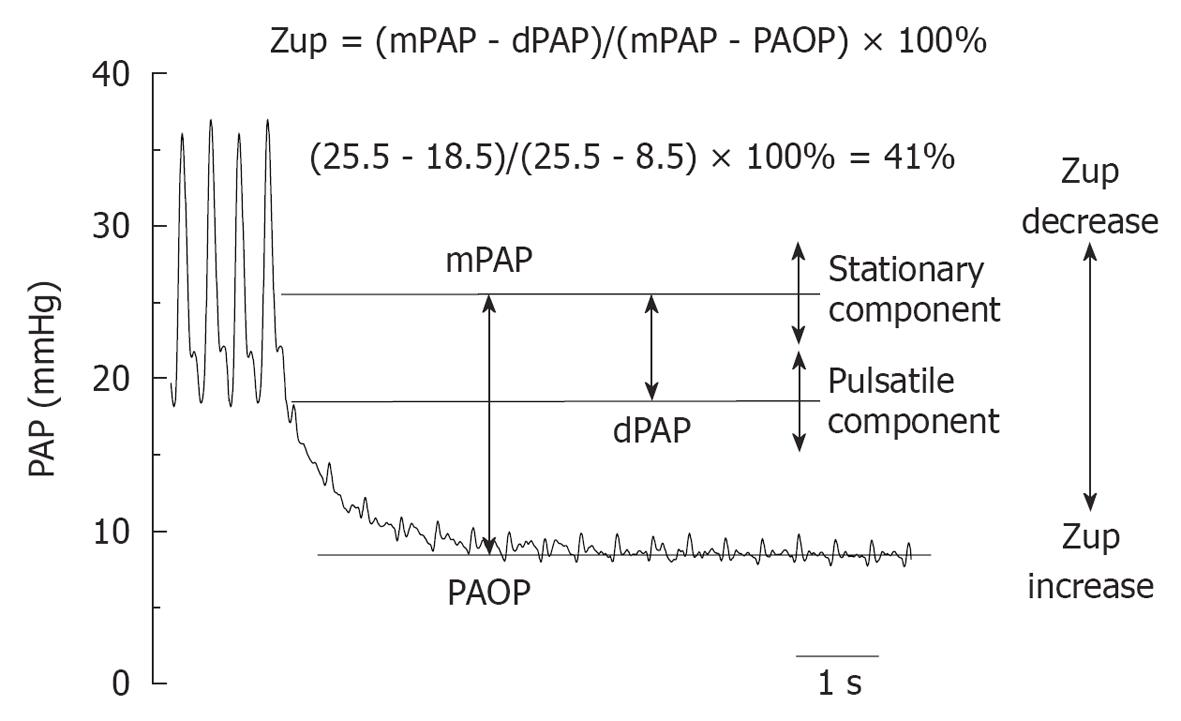
Figure 5 Example of the pulmonary artery decay curve showing the calculus of Zup.
- Citation: Grignola JC. Hemodynamic assessment of pulmonary hypertension. World J Cardiol 2011; 3(1): 10-17
- URL: https://www.wjgnet.com/1949-8462/full/v3/i1/10.htm
- DOI: https://dx.doi.org/10.4330/wjc.v3.i1.10


