©2010 Baishideng Publishing Group Co.
World J Cardiol. Jul 26, 2010; 2(7): 163-170
Published online Jul 26, 2010. doi: 10.4330/wjc.v2.i7.163
Published online Jul 26, 2010. doi: 10.4330/wjc.v2.i7.163
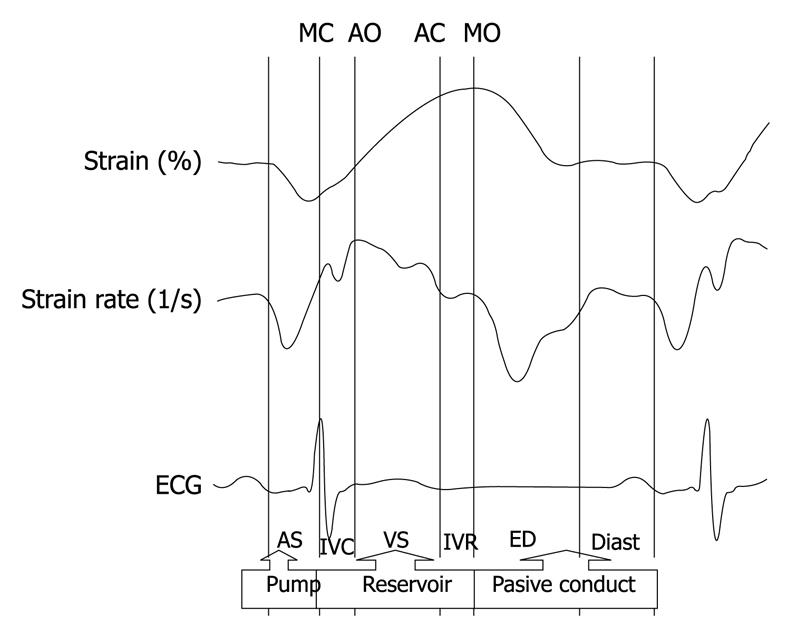
Figure 1 Atrial strain and strain rate during the phases of the cardiac cycle.
MC: Mitral closure; AO: Aortic opening; AC: Aortic closure; MO: Mitral opening; AS: Atrial systole; IVC: Isovolumic contraction; VS: Ventricular systole; IVR: Isovolumic relaxation; ED: Early diastole; Diast: Diastasis.
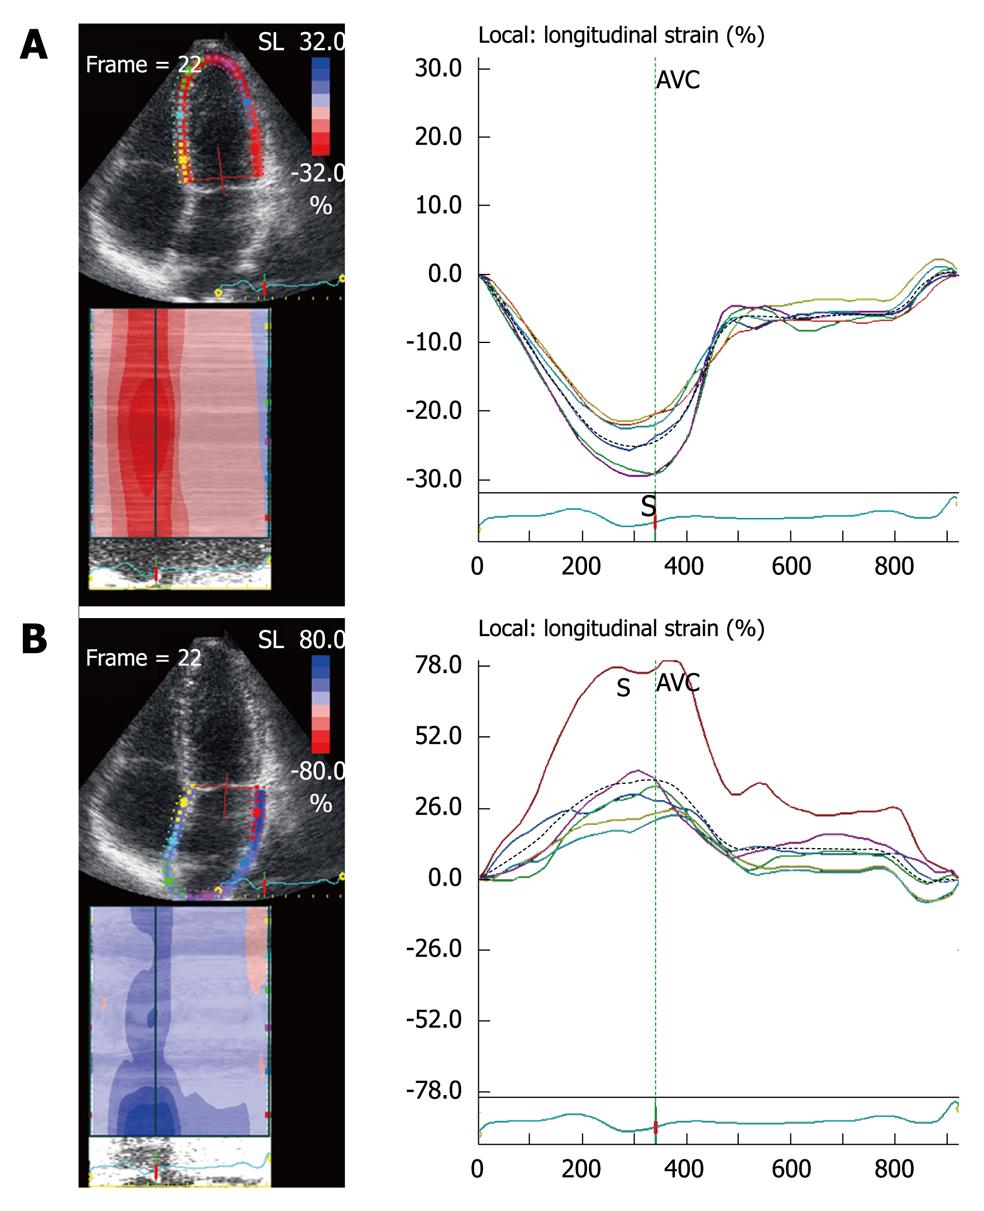
Figure 2 Ventricular strain (A) and atrial strain (B).
Due to the fact that the atria relax while the ventricles contract, during ventricular systole, ventricular strain curves are negative, while atrial strain curves are positive. AVC: Aortic valve closure.
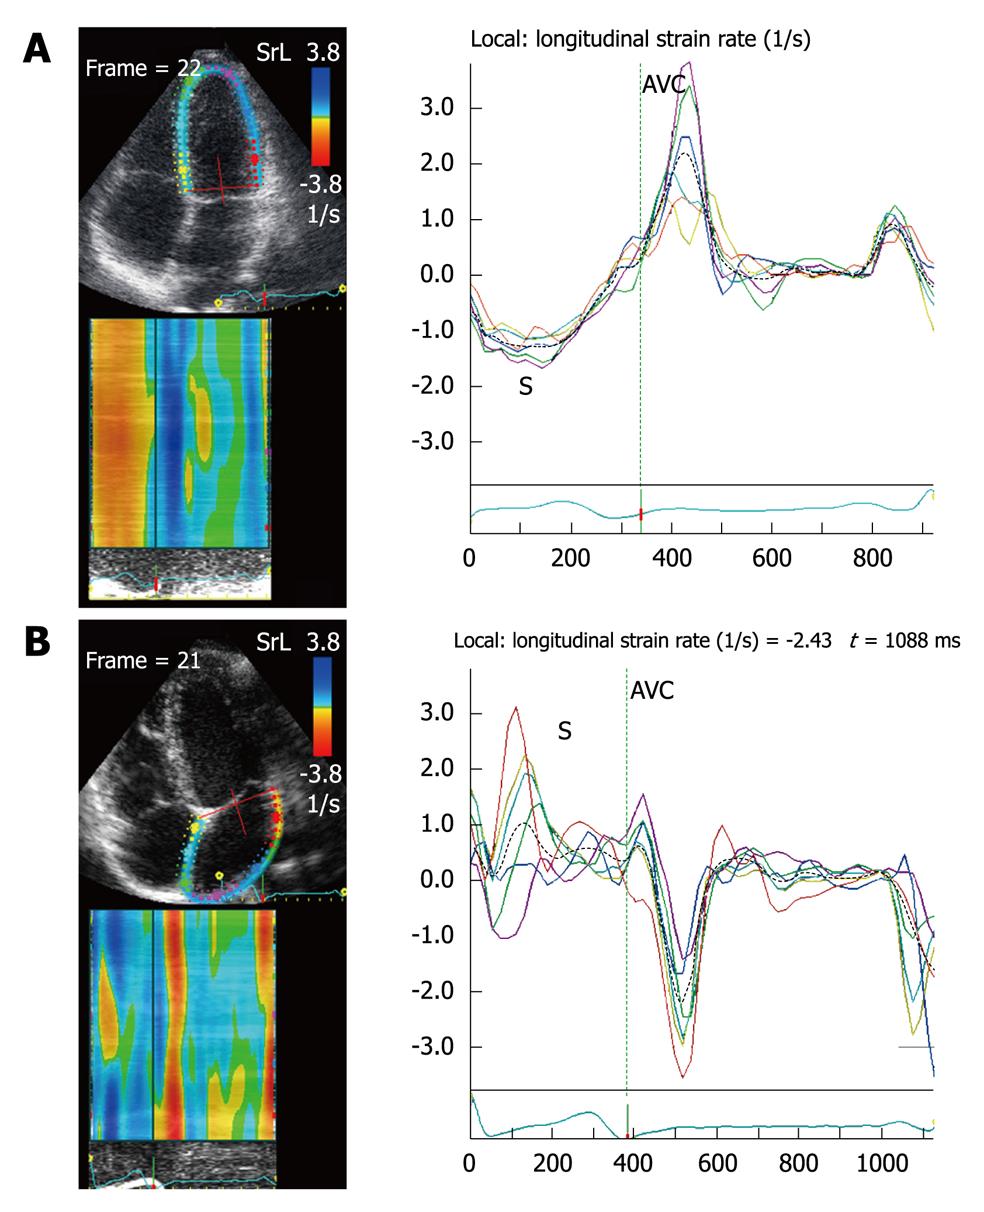
Figure 3 Ventricular strain rate (A) and atrial strain rate (B).
Due to the fact that the atria relax while the ventricles contract, during ventricular systole, ventricular strain rate (SR) is negative, whereas atrial SR is positive. AVC: Aortic valve closure.
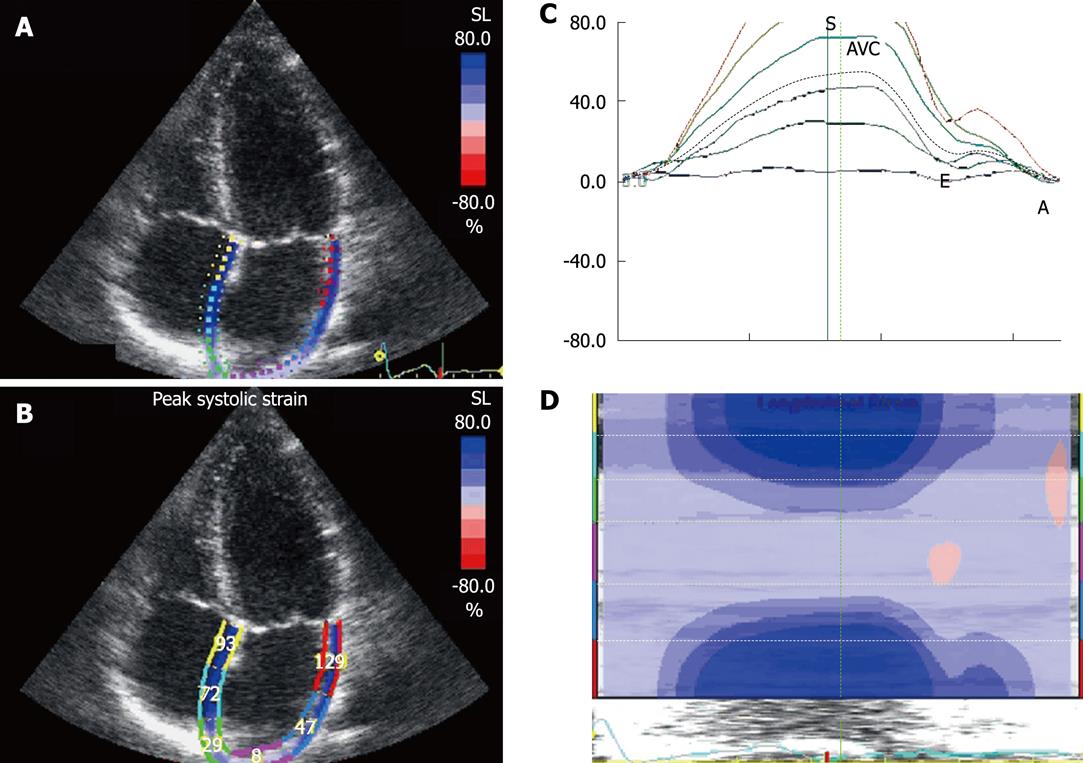
Figure 4 Measurement of 2D longitudinal atrial strain with speckle tracking.
Quad view. A: Once the atrial endocardial border is traced, atrial thickness is traced automatically; B: Strain value of the reservoir in the six atrial walls; C: Longitudinal strain curves of the six atrial segments. The dotted line represents average atrial longitudinal strain. During the period in which the atrium acts as a reservoir (includes isovolumic contraction, ejection and isovolumic relaxation phases), atrial strain increases, reaching a peak (S) at the end of filling from pulmonary vein flow, just before mitral opening. During the conduit atrial phase, atrial strain decreases (E), with a plateau during diastasis and a negative peak at the end of atrial contraction (A); D: Curved anatomical M-mode: the light blue color indicates that atrial roof strain is lower than that of the rest of the walls, colored in blue. AVC: Aortic valve closure.
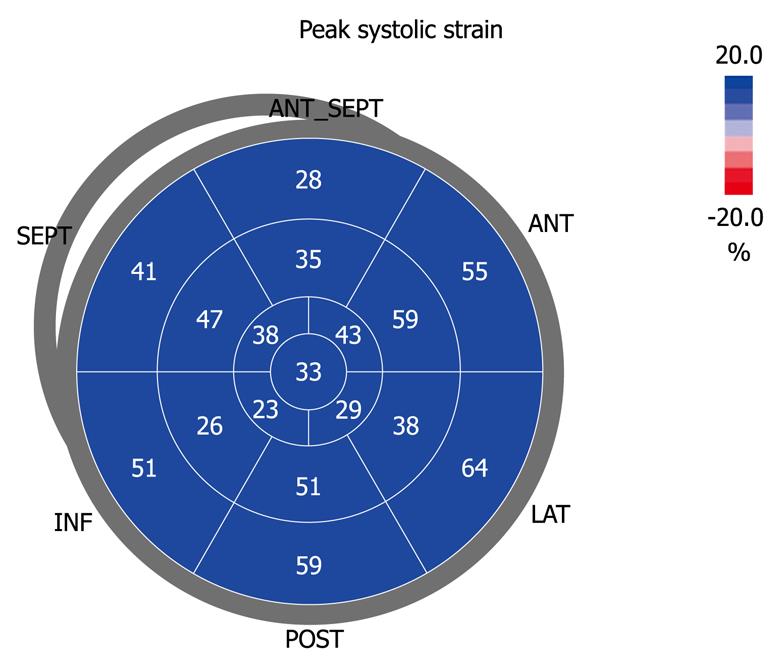
Figure 5 Bull’s eye view of the 2D strain of the left atrial reservoir in a normal subject.
Bull’s eye with the longitudinal 2D strain values of the left atrium. It is colored blue because it represents the atrial strain of the reservoir phase, which increases during ventricular systole. Note that basal values are higher than medial values and further reduced at the center, which represents the atrial roof strain. Values of the antero-septal wall should be excluded, because they correspond to the ascending aorta.
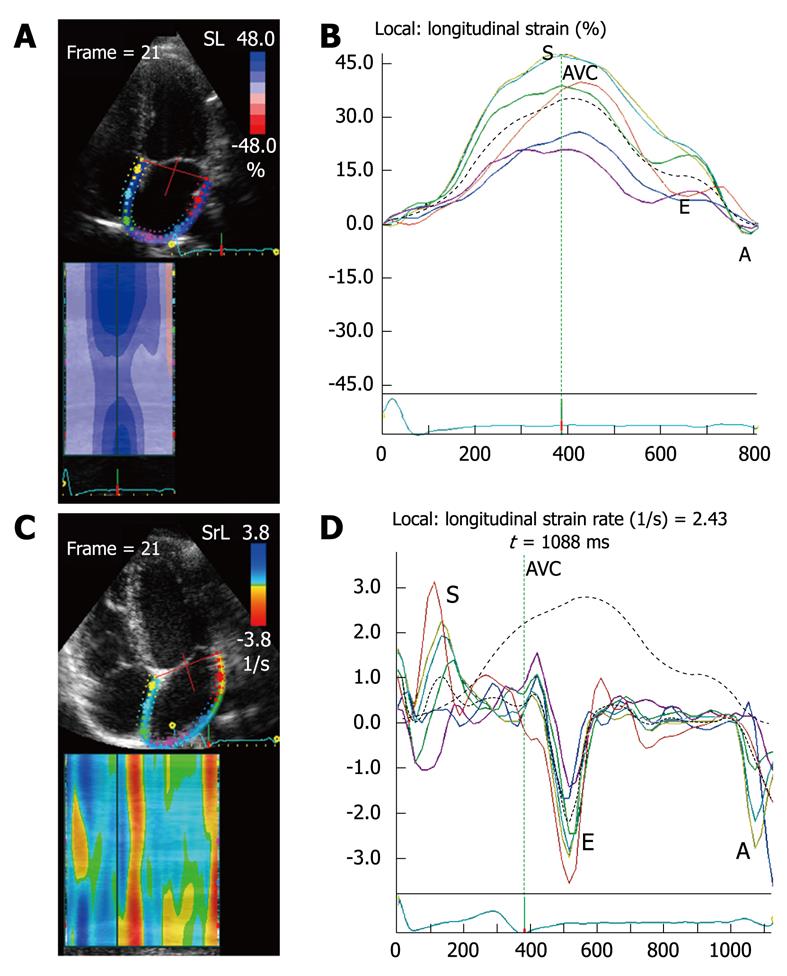
Figure 6 2D longitudinal strain and strain rate of the left atrium obtained from the apical four-chamber view in a normal subject.
Quad view. A: Left atrial speckle tracking and curved anatomical M-mode of atrial strain during the whole cardiac cycle; B: Atrial strain curves depicted with different colors in the six segments (the dotted line indicates average strain). Positive curves indicate the atrial strain of the reservoir during ventricular systole (S), which coincides with aortic valve closure; Negative curves represent atrial strain during early diastole (E), and peak atrial contraction (A) occurs just after the P wave of the ECG; C and D: Similar to A and B: showing the left atrial longitudinal strain rate (SR) (the dotted line indicates the average SR). Positive curves (S), indicate atrial lengthening (relaxation) during the periods of: isovolumic contraction, ventricular ejection and isovolumic relaxation (reservoir SR). Negative curves indicate atrial SR during rapid ventricular filling (E) and atrial systolic SR (A) is seen after the P wave of the ECG. AVC: Aortic valve closure.
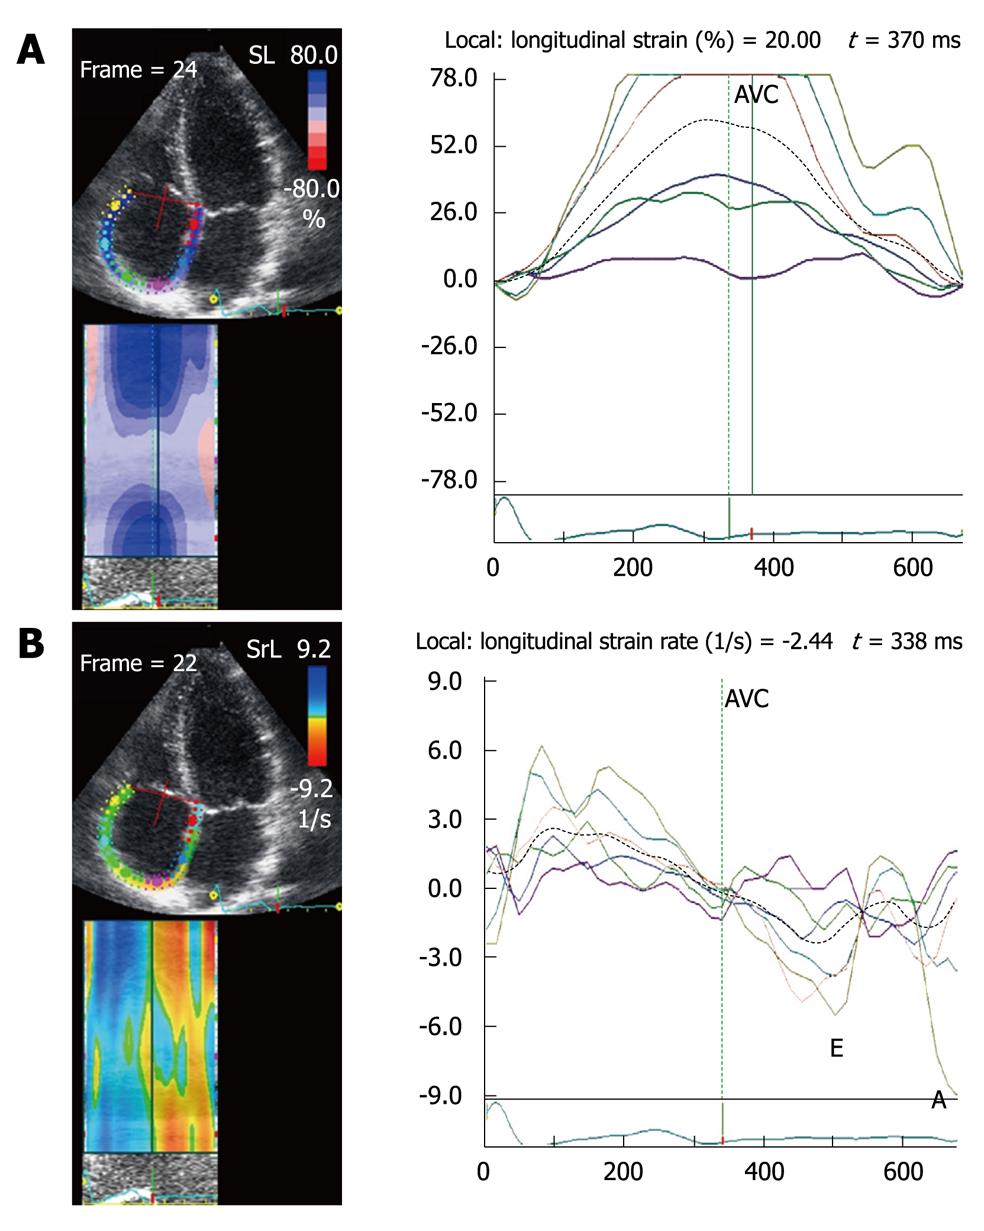
Figure 7 Right atrial strain and strain rate.
Longitudinal 2D strain is obtained from the apical four-chamber view in a normal subject. A: Right atrial strain; B: Right atrial strain rate. Explanation as in Figure 6B. AVC: Aortic valve closure.
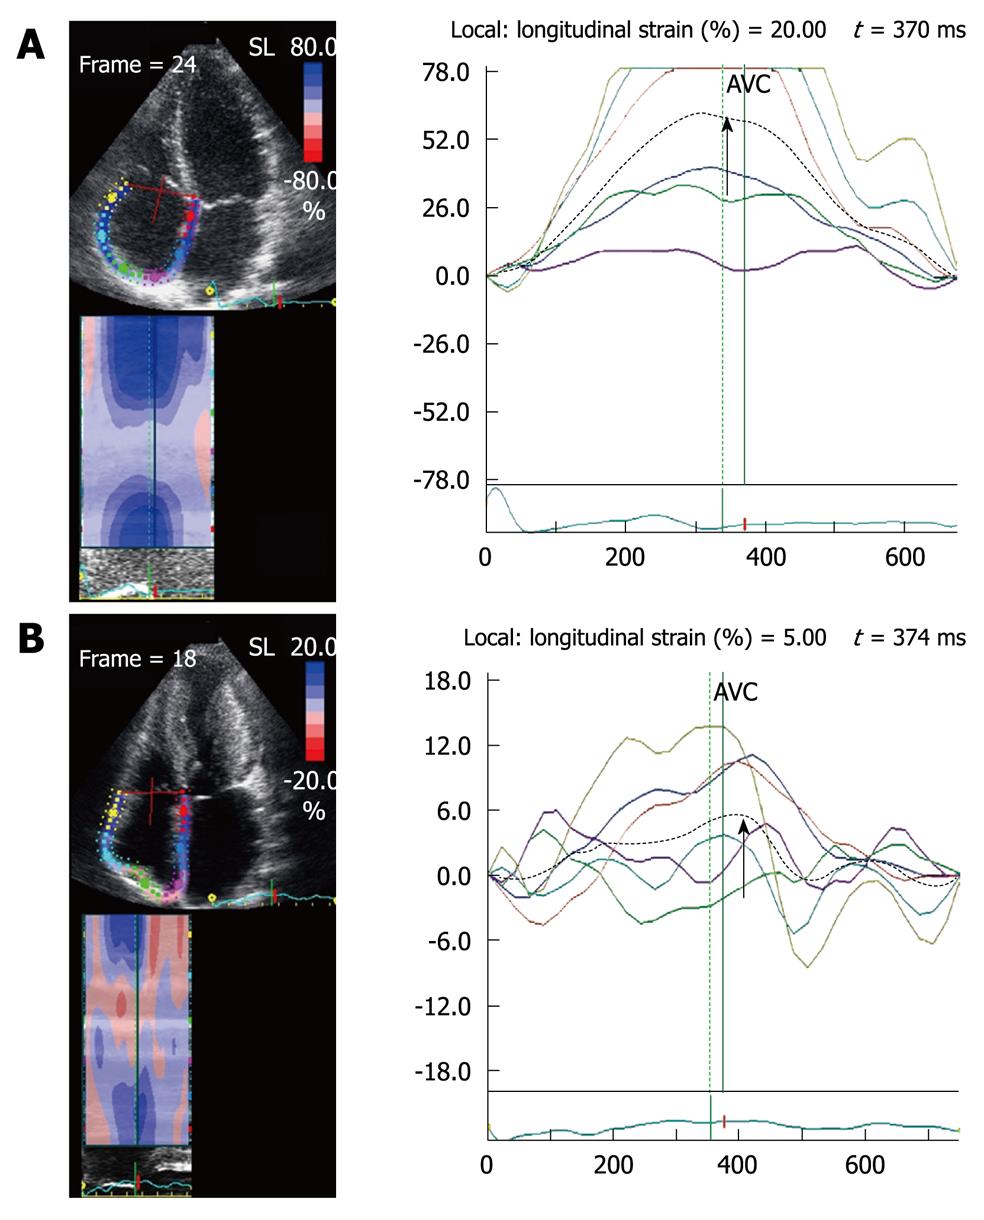
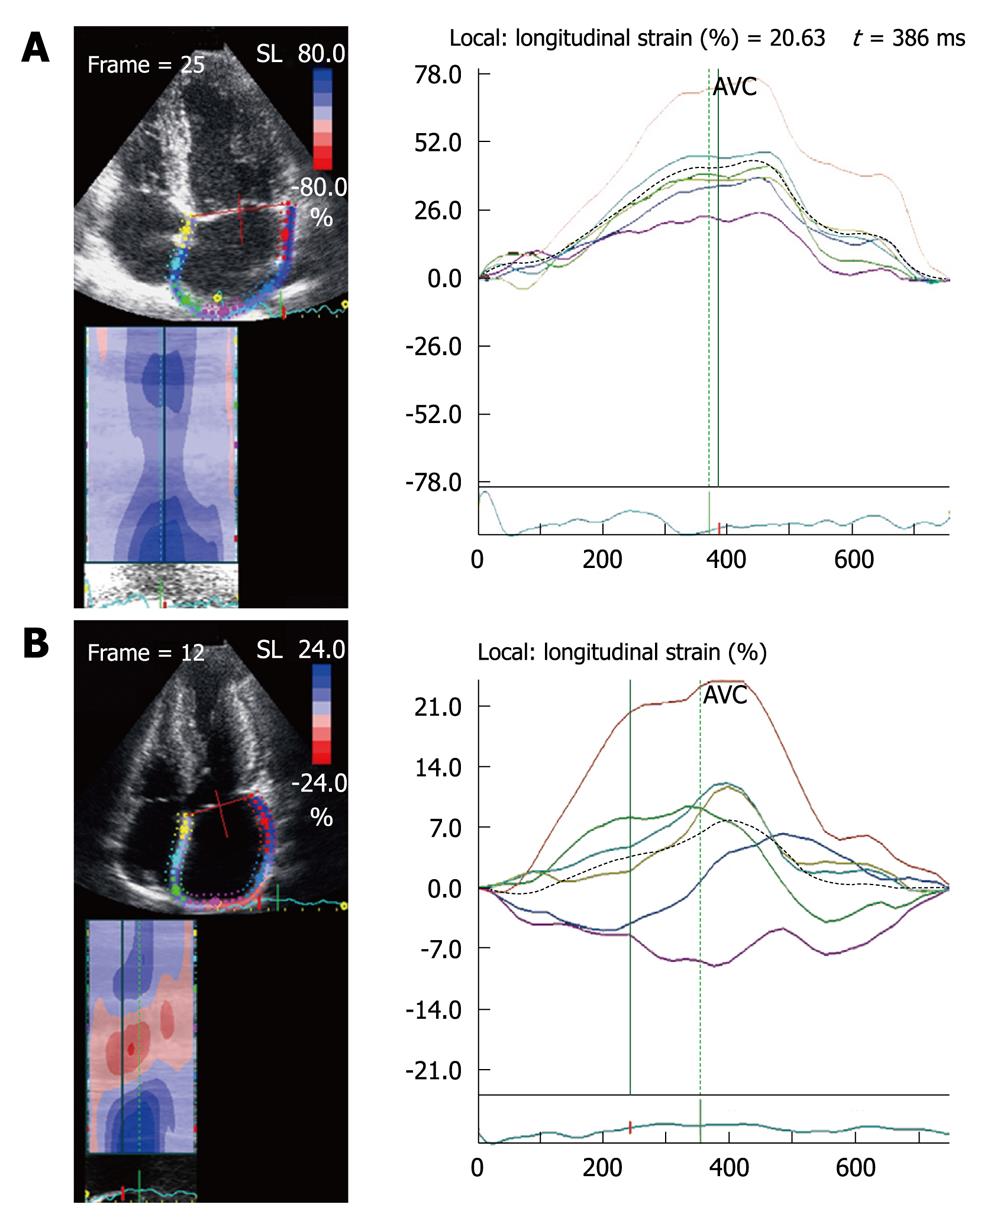
Figure 8 Average 2D longitudinal strain (dotted line) of the right atrium during the reservoir phase (arrow) in a normal subject (A), which is 60%, whereas in a patient with hypertrophic cardiomyopathy with right atrial hypertrophy (B), it is reduced to 6%.
AVC: Aortic valve closure.
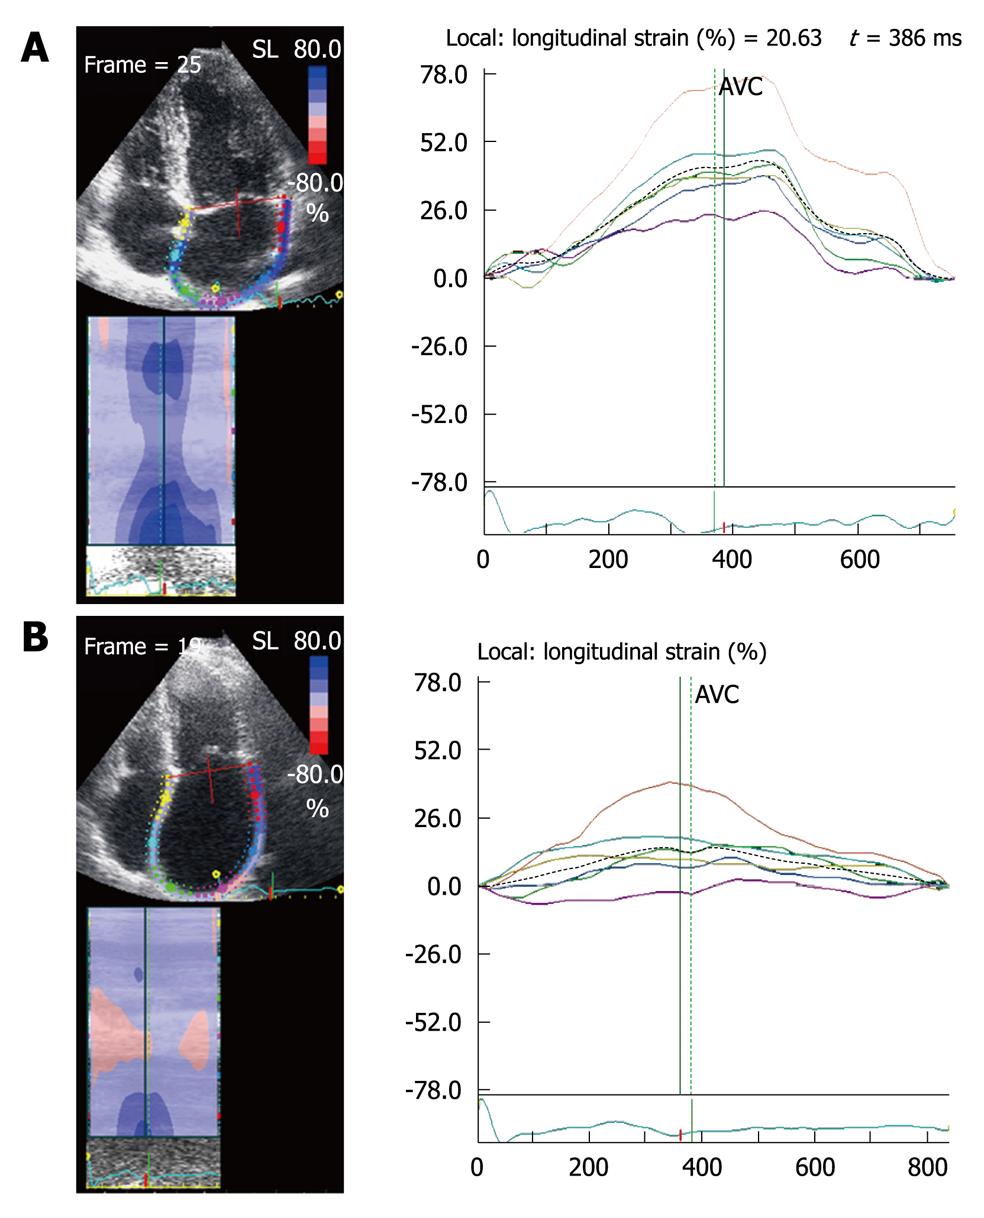
Figure 9 Left atrial 2D longitudinal strain during the reservoir phase in a normal subject (A) and in a patient with atrial fibrillation (B).
Note that peak strain (dotted line) is 40% in the normal subject and 7% in the patient with atrial fibrillation. AVC: Aortic valve closure.
Figure 10 Left atrial 2D longitudinal strain during the reservoir phase in a normal subject (A) with an average reservoir strain (dotted line) of 40%, and in a patient with mitral stenosis (B) with a marked reduction in strain (13%).
AVC: Aortic valve closure.
- Citation: Cianciulli TF, Saccheri MC, Lax JA, Bermann AM, Ferreiro DE. Two-dimensional speckle tracking echocardiography for the assessment of atrial function. World J Cardiol 2010; 2(7): 163-170
- URL: https://www.wjgnet.com/1949-8462/full/v2/i7/163.htm
- DOI: https://dx.doi.org/10.4330/wjc.v2.i7.163


