
















Copyright: ©Author(s) 2026.
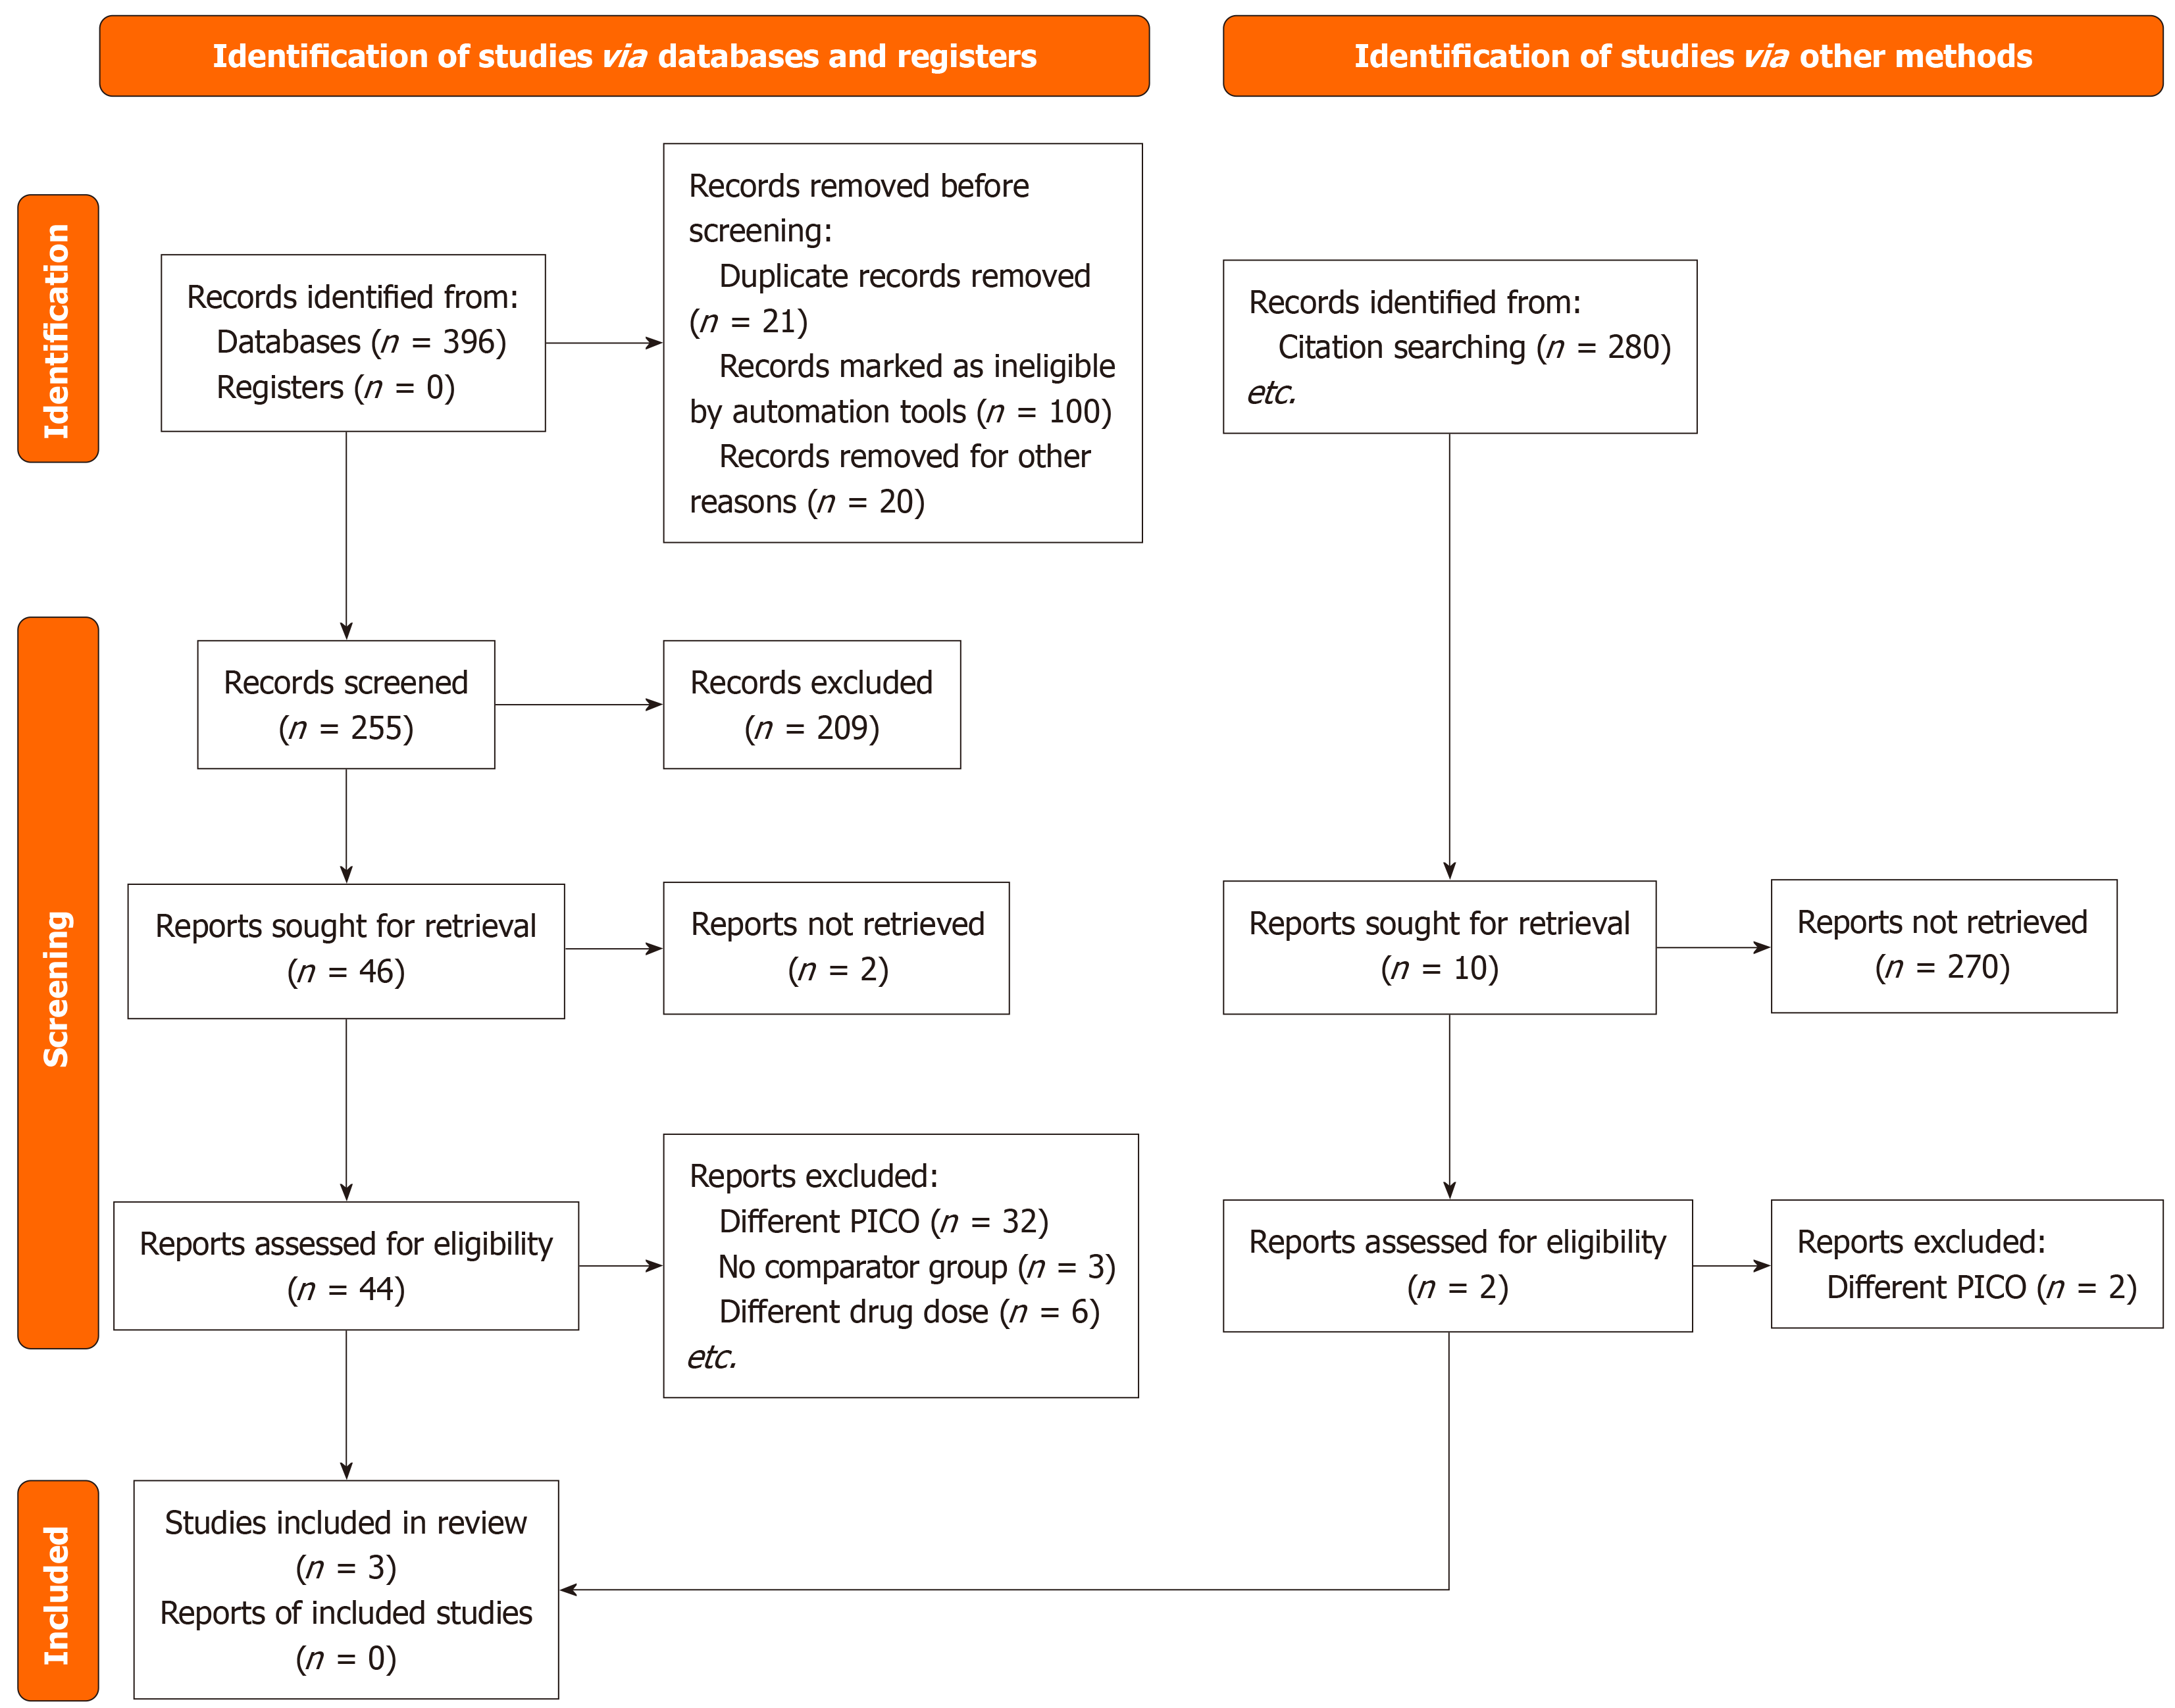
Figure 1 PRISMA flow diagram representing breakdown of screened and included studies.
PICO: Population, intervention, comparator, and outcome.
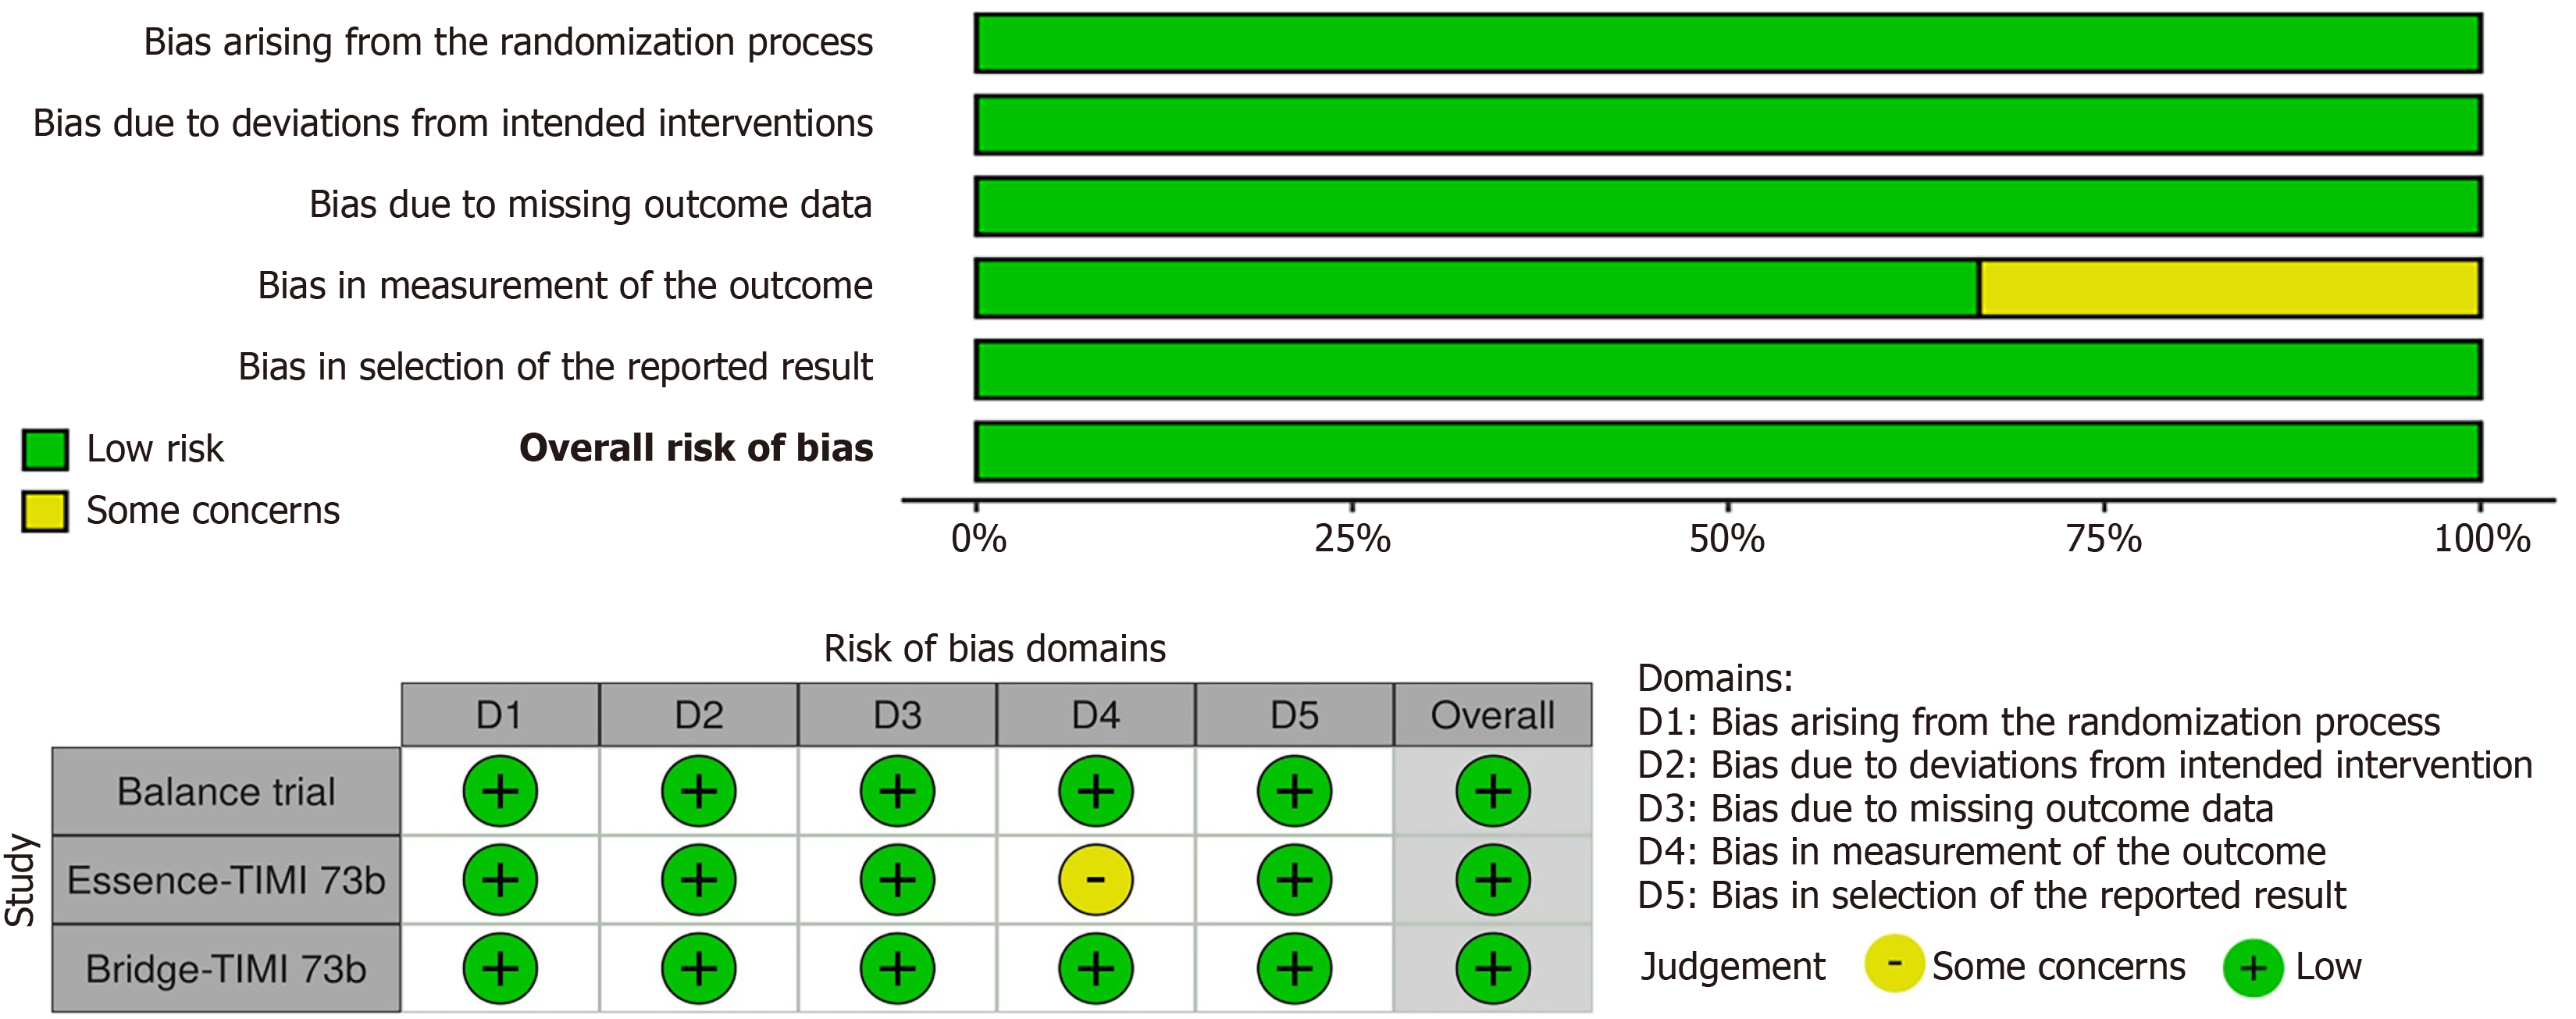
Figure 2 Risk of bias assessment of included randomized controlled trials.
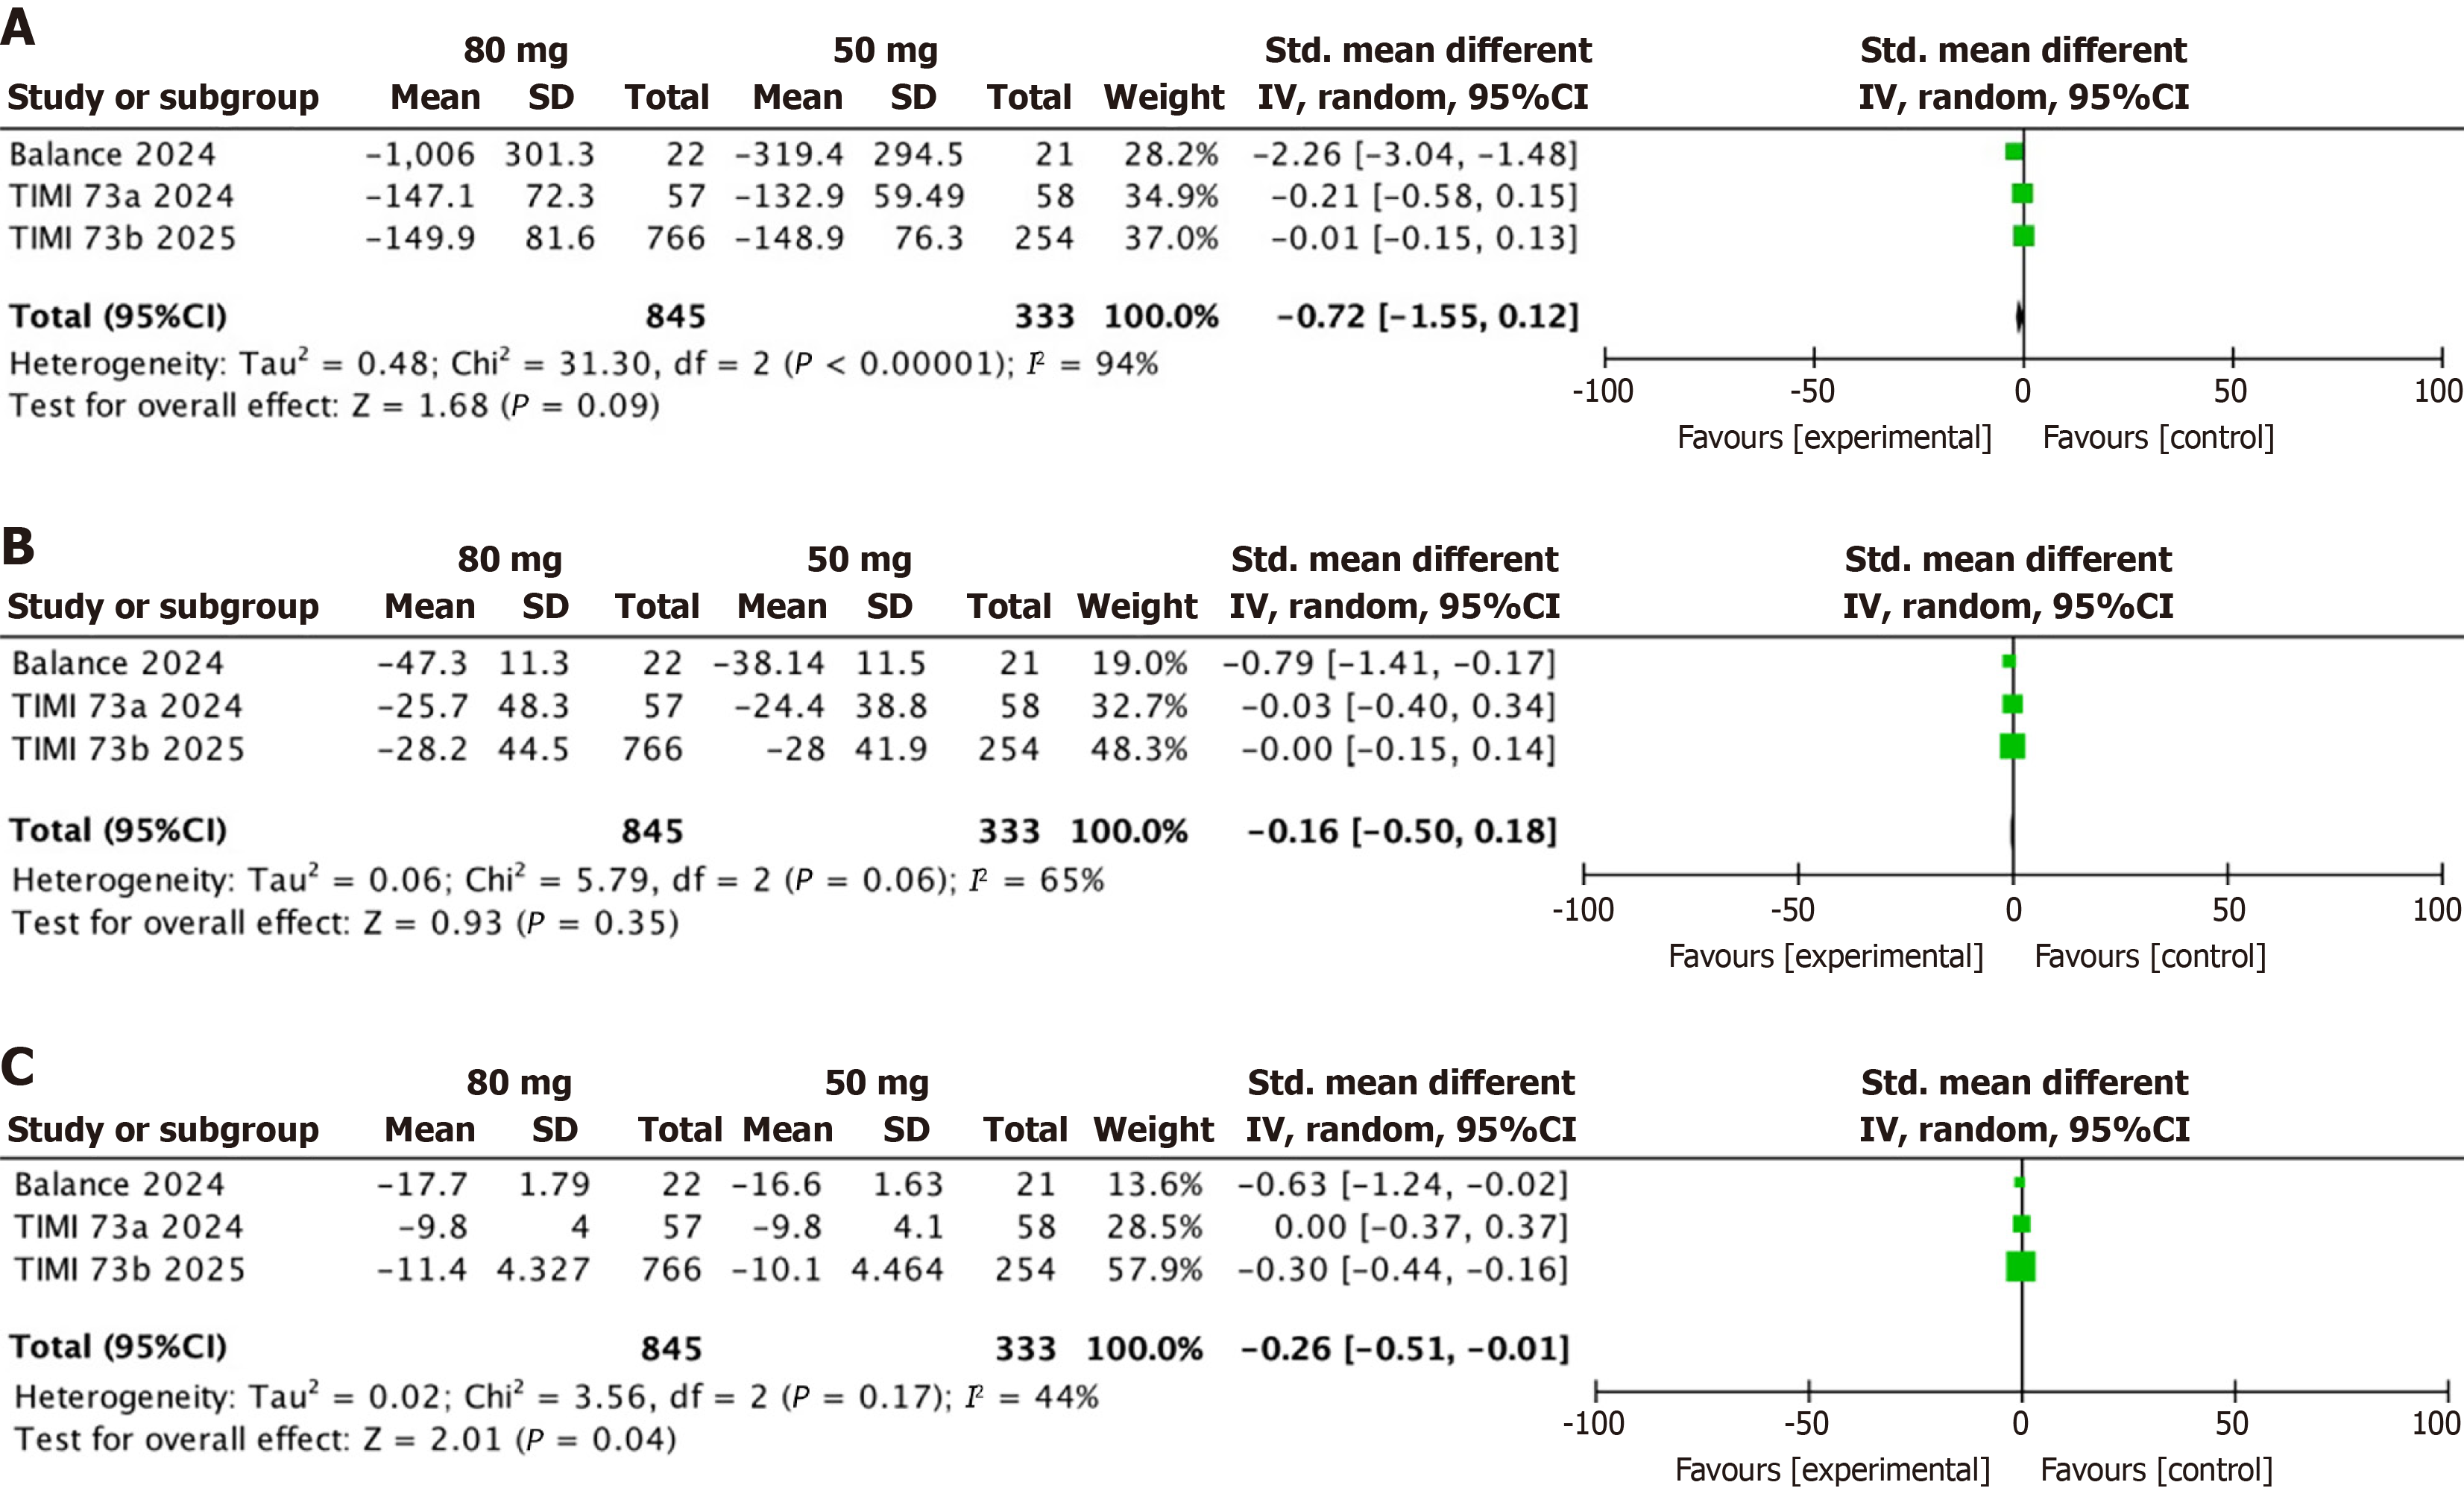
Figure 3 Primary efficacy outcomes.
A-C: Dose comparison of olezarsen 80 mg vs 50 mg in regard to reduction in triglyceride level (A), non-high-density lipoproteins cholesterol level (B), and apolipoprotein C-III level (C).
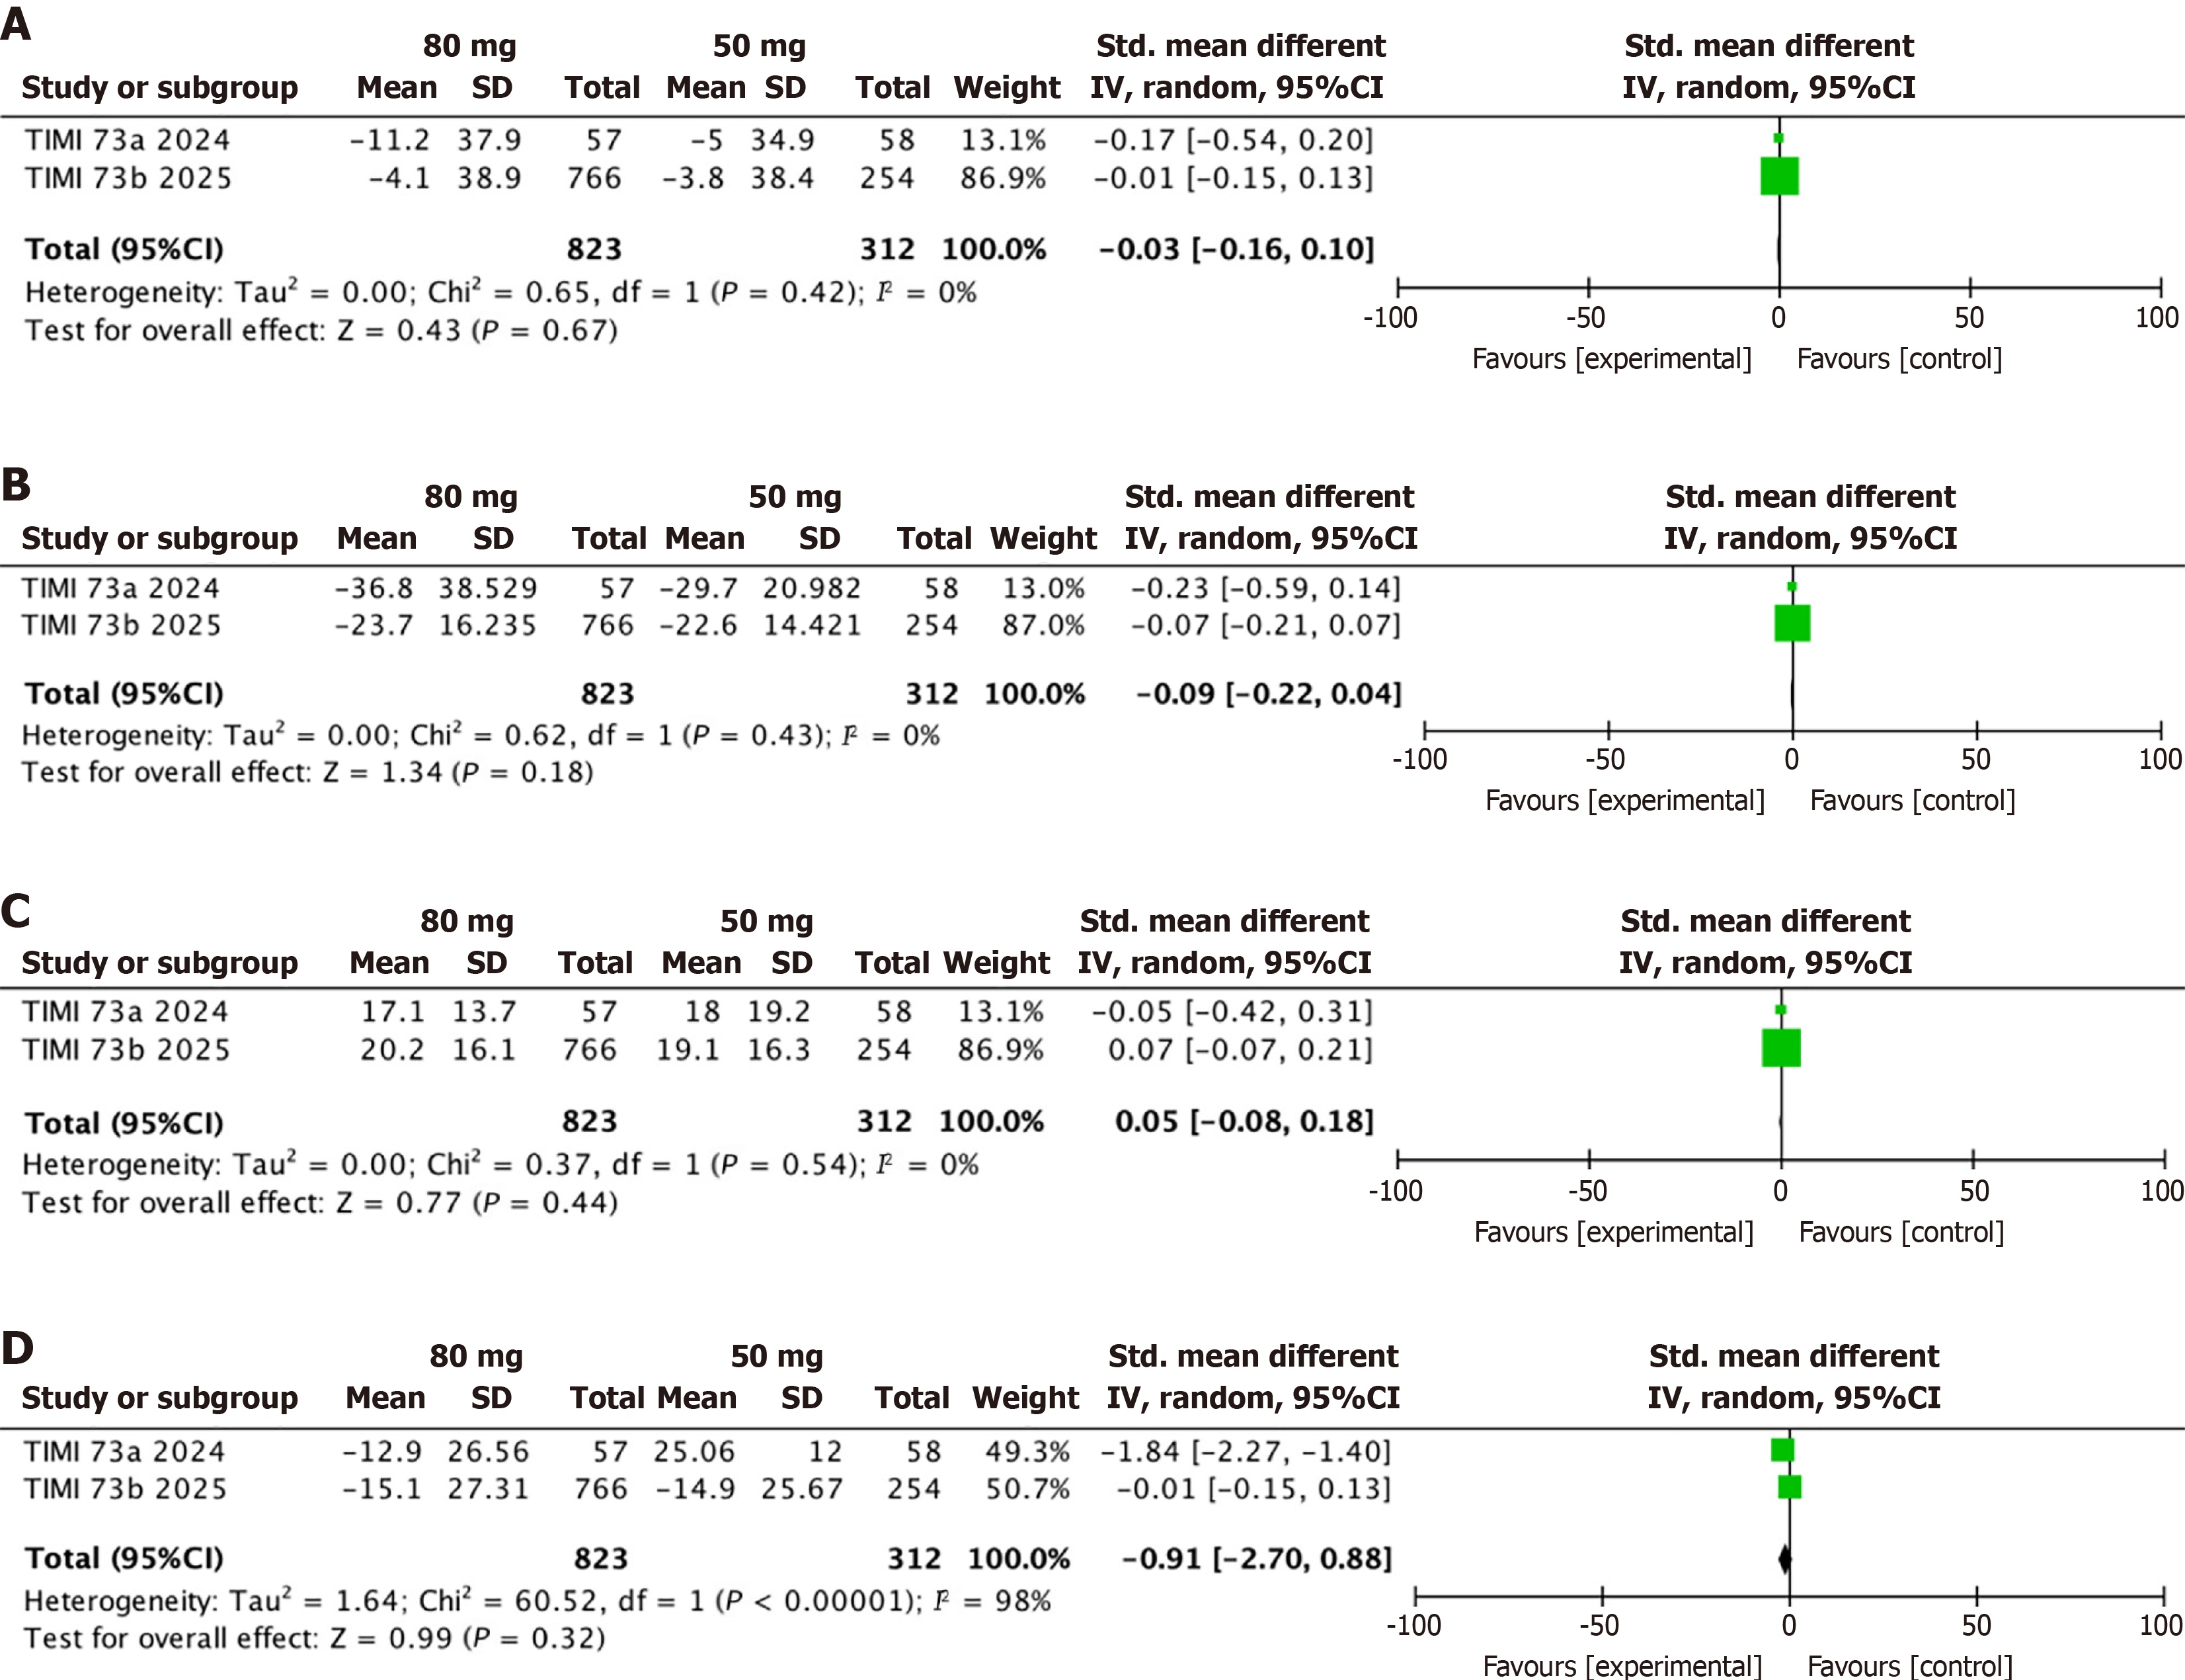
Figure 4 Secondary lipid outcomes.
A-D: Dose comparison of olezarsen 80 mg vs 50 mg in regard to reduction in low density lipoproteins level (A), very low-density lipoproteins level (B), high-density lipoproteins level (C) and apolipoprotein B level (D).
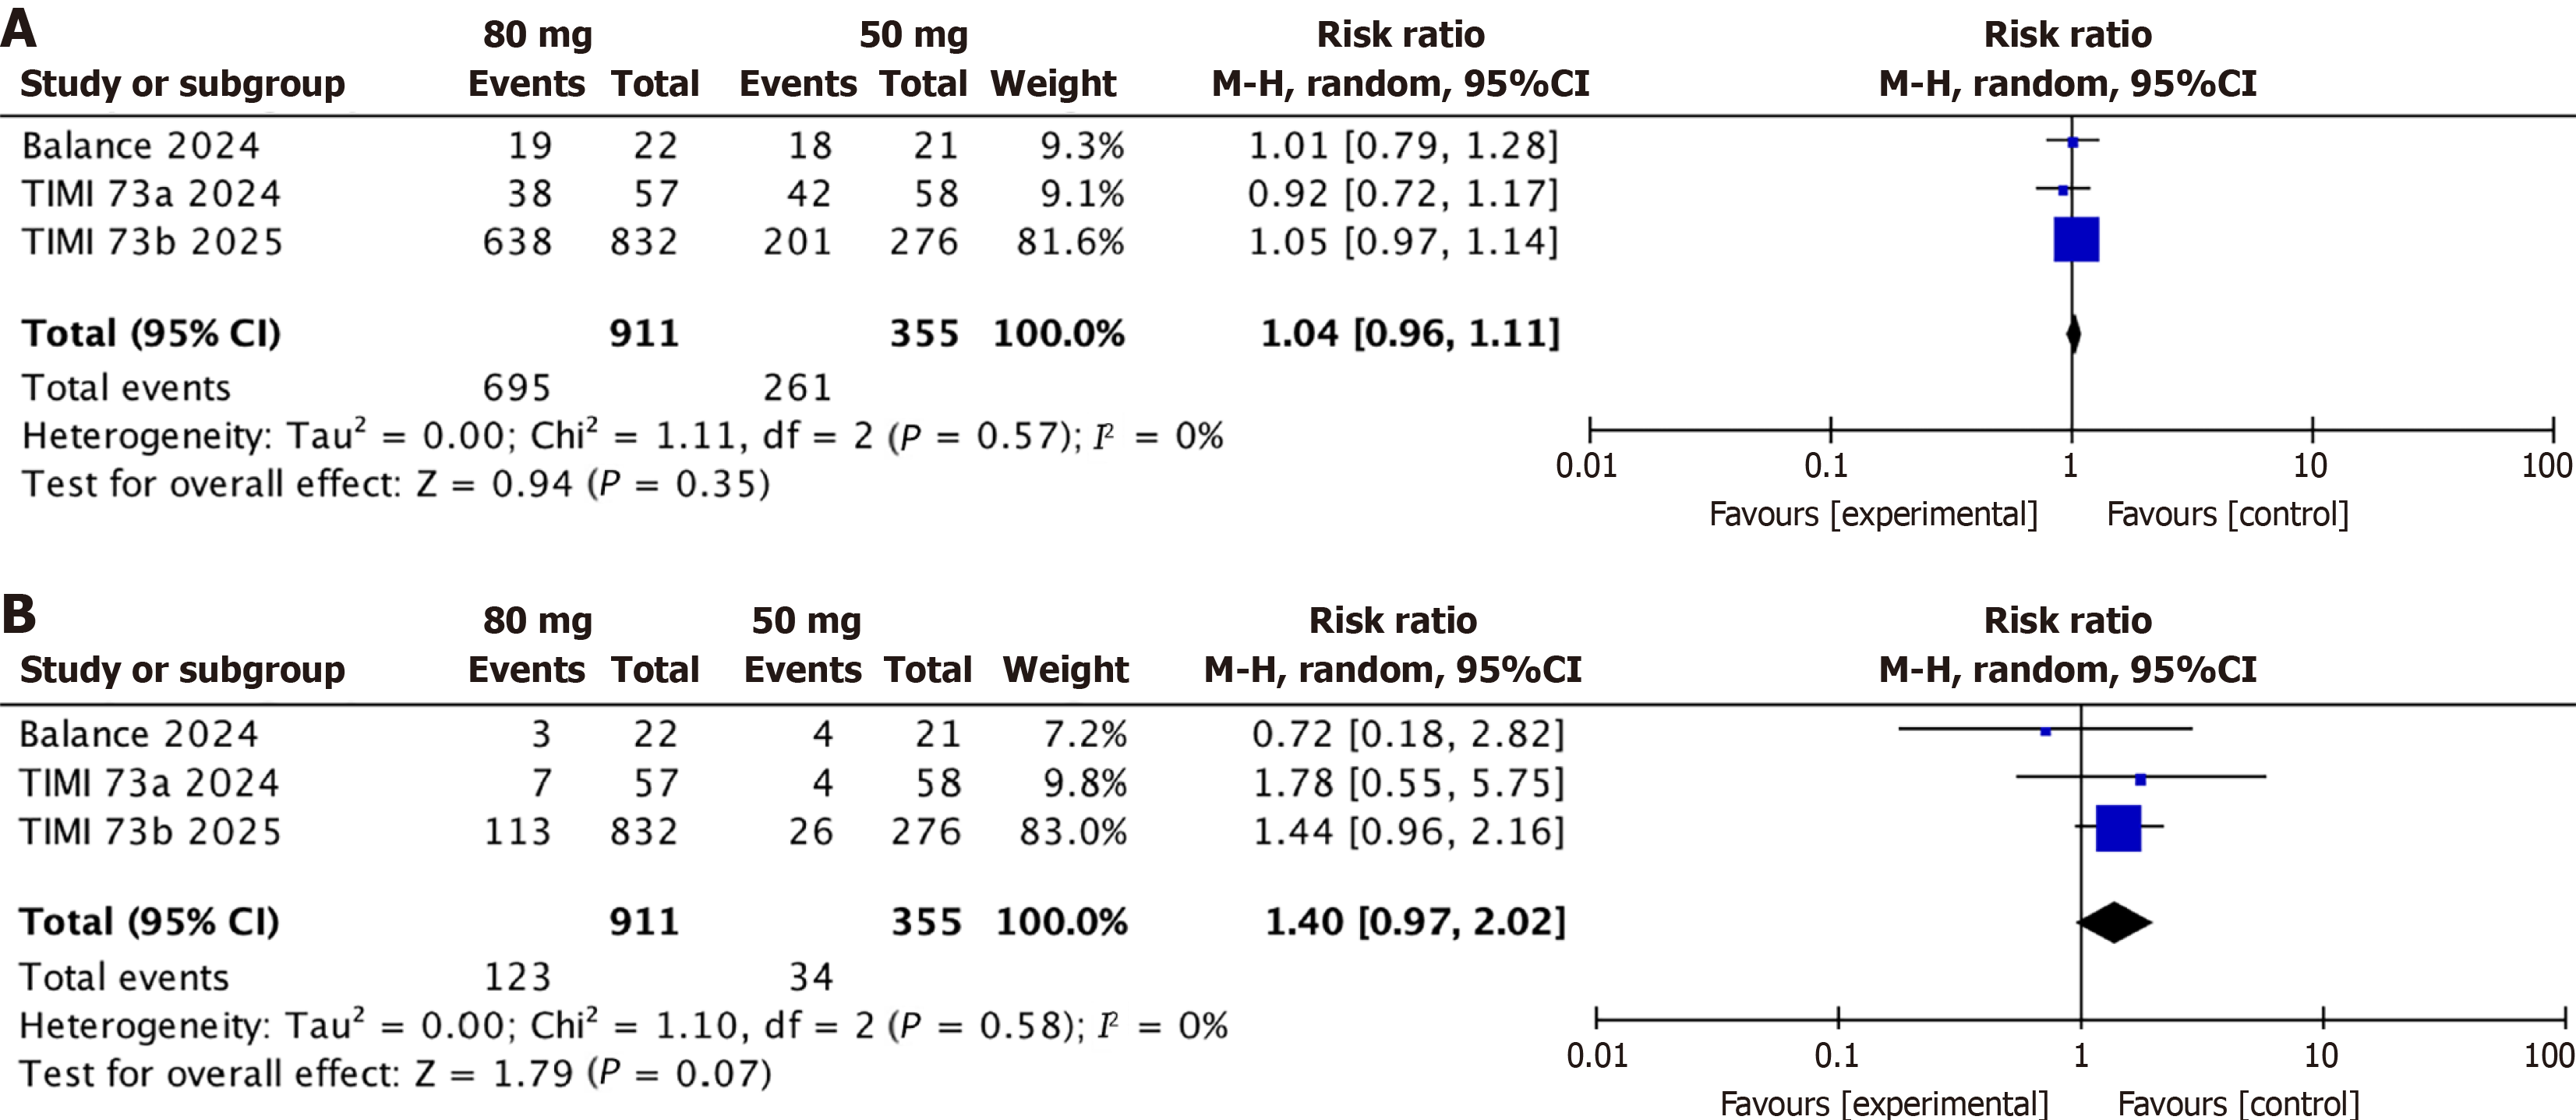
Figure 5 Overall safety outcomes.
A and B: Dose comparison of olezarsen 80 mg vs 50 mg in regard to any adverse events (A) and serious adverse events (B).
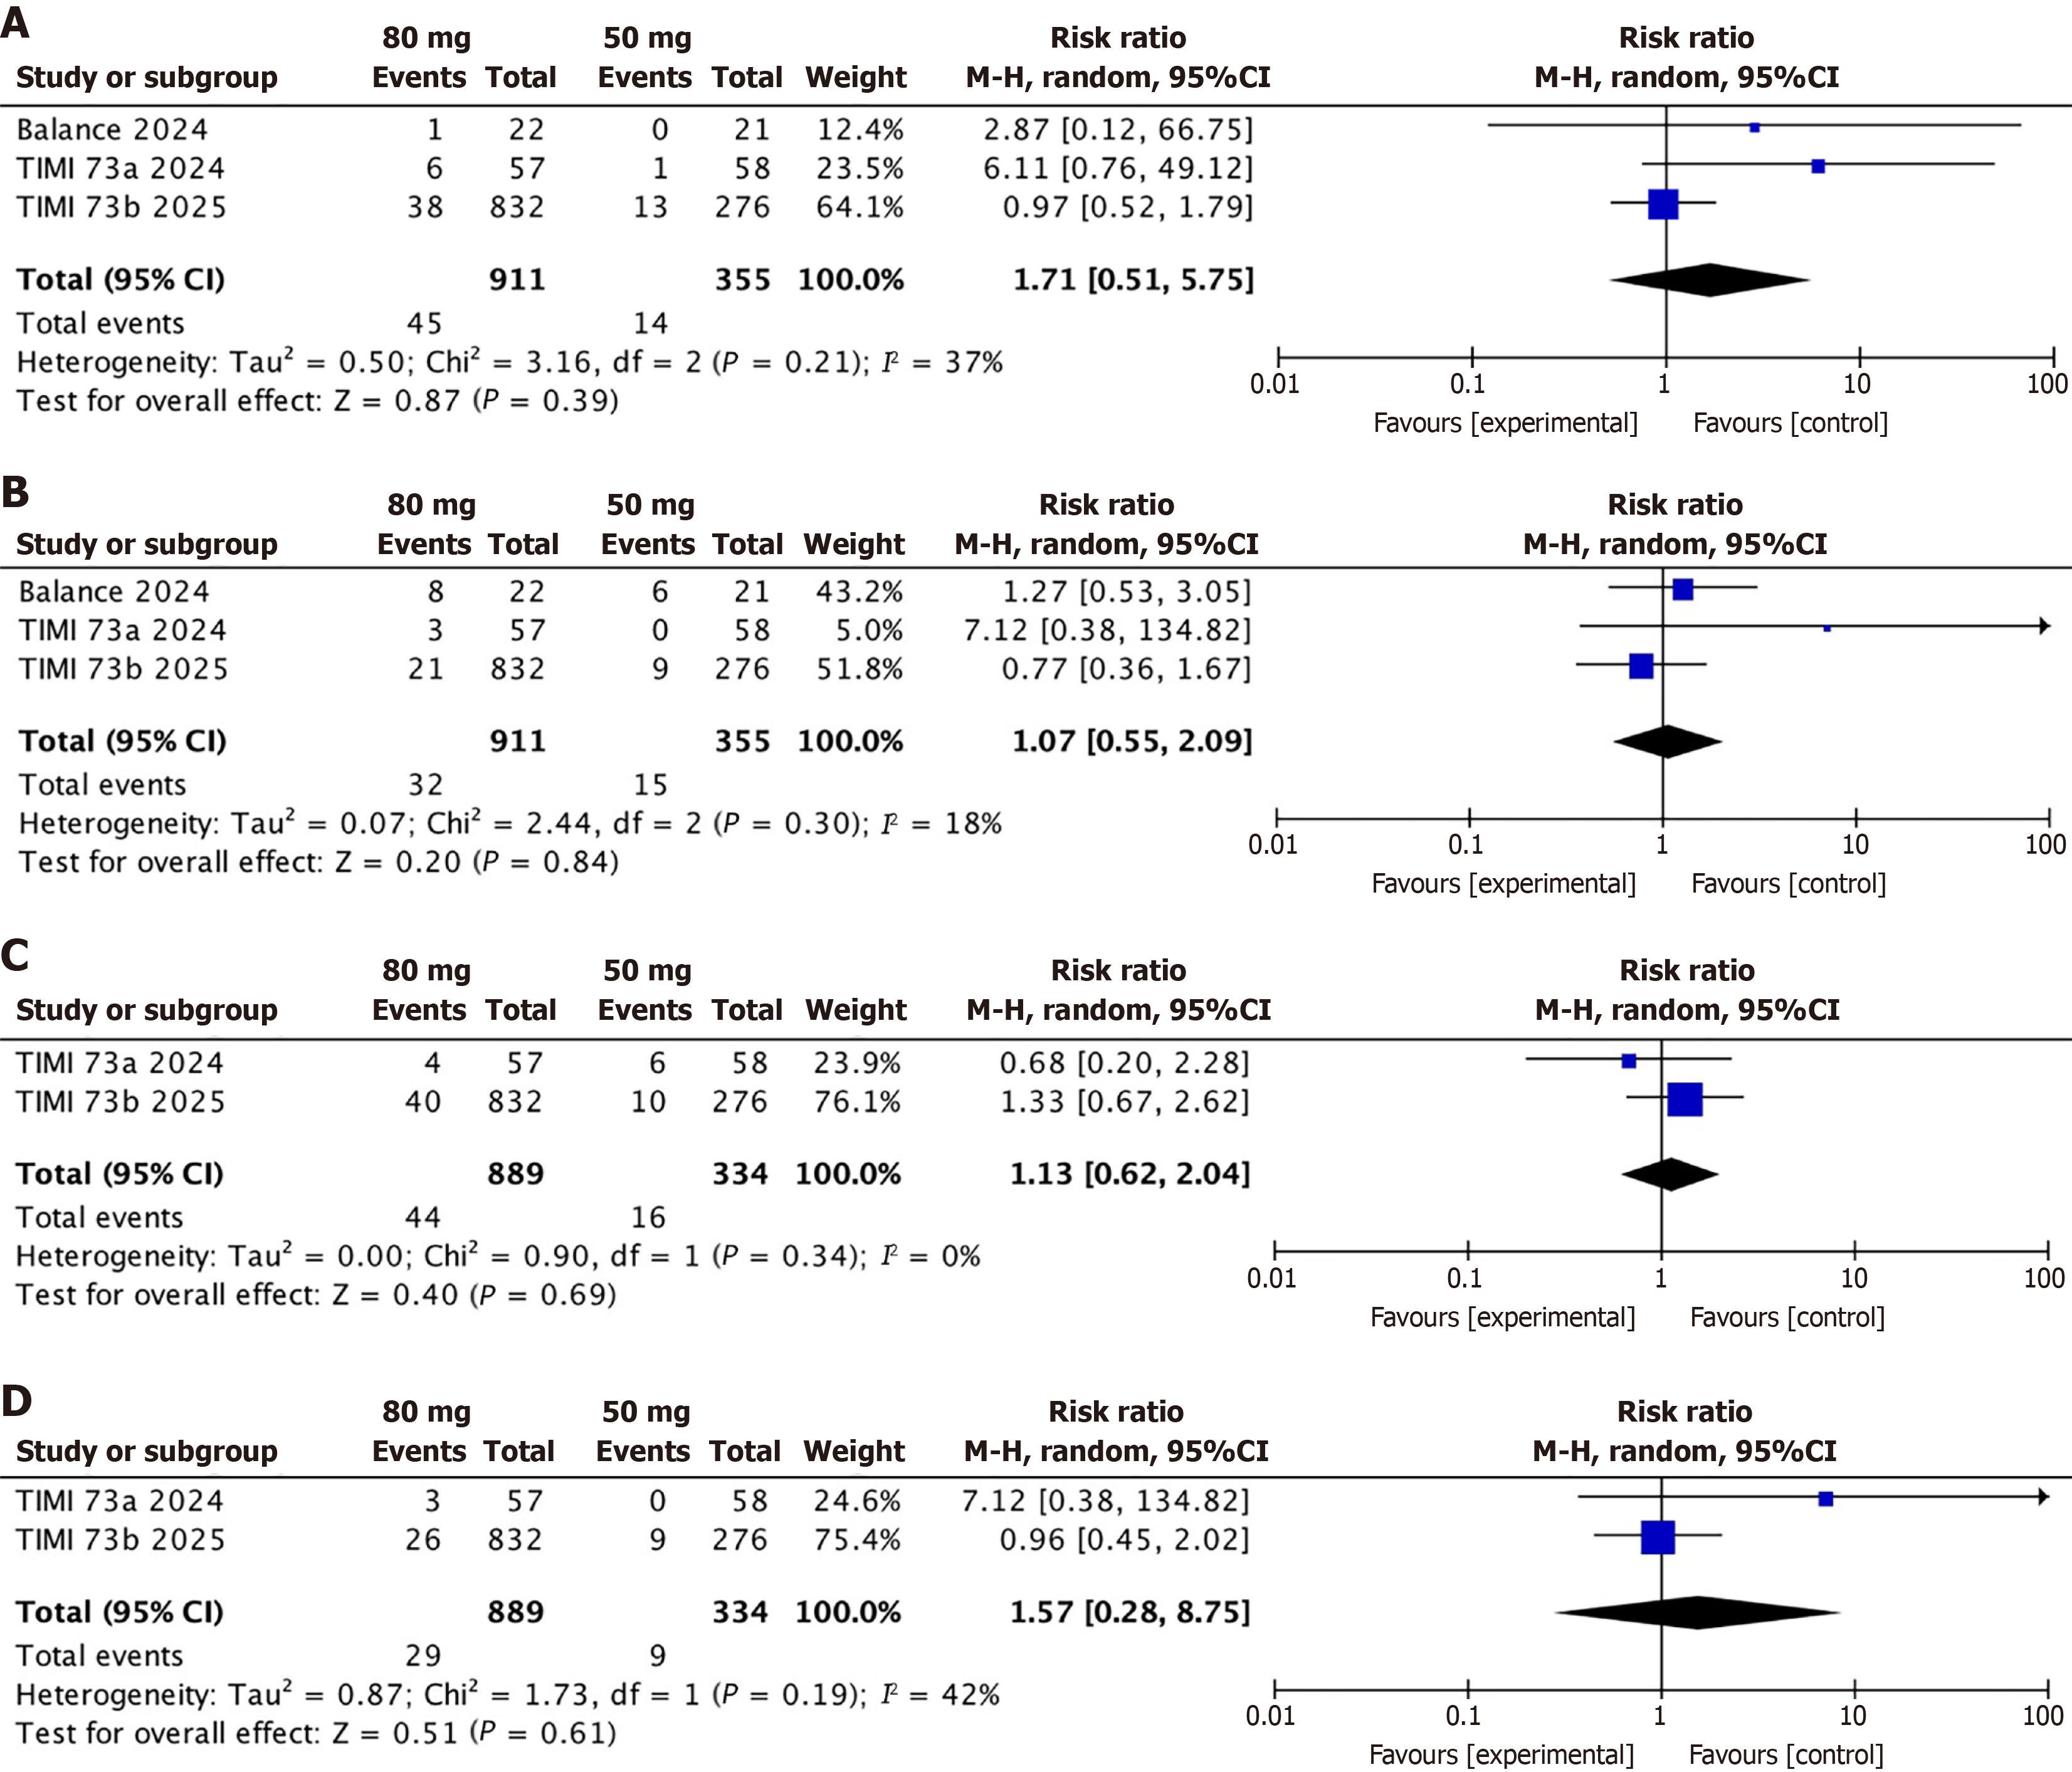
Figure 6 Specific safety outcomes.
A-D: Dose comparison of olezarsen 80 mg vs 50 mg in regard to hypersenstivity reaction (A), hepatic dysfunction (B), renal dysfunction (C) and thrombocytopenia (D).
- Citation: Patel V, Sohail R, Alam M, Chaudhry S, Mehdi S, Patel S, Patel R, Khattak R, Khan Z, Patel M. Dose-dependent efficacy of olezarsen in high-risk hypertriglyceridemia: A meta-analysis. World J Cardiol 2026; 18(7): 121611
- URL: https://www.wjgnet.com/1949-8462/full/v18/i7/121611.htm
- DOI: https://dx.doi.org/10.4330/wjc.121611