Copyright
©The Author(s) 2025.
World J Cardiol. May 26, 2025; 17(5): 104839
Published online May 26, 2025. doi: 10.4330/wjc.v17.i5.104839
Published online May 26, 2025. doi: 10.4330/wjc.v17.i5.104839
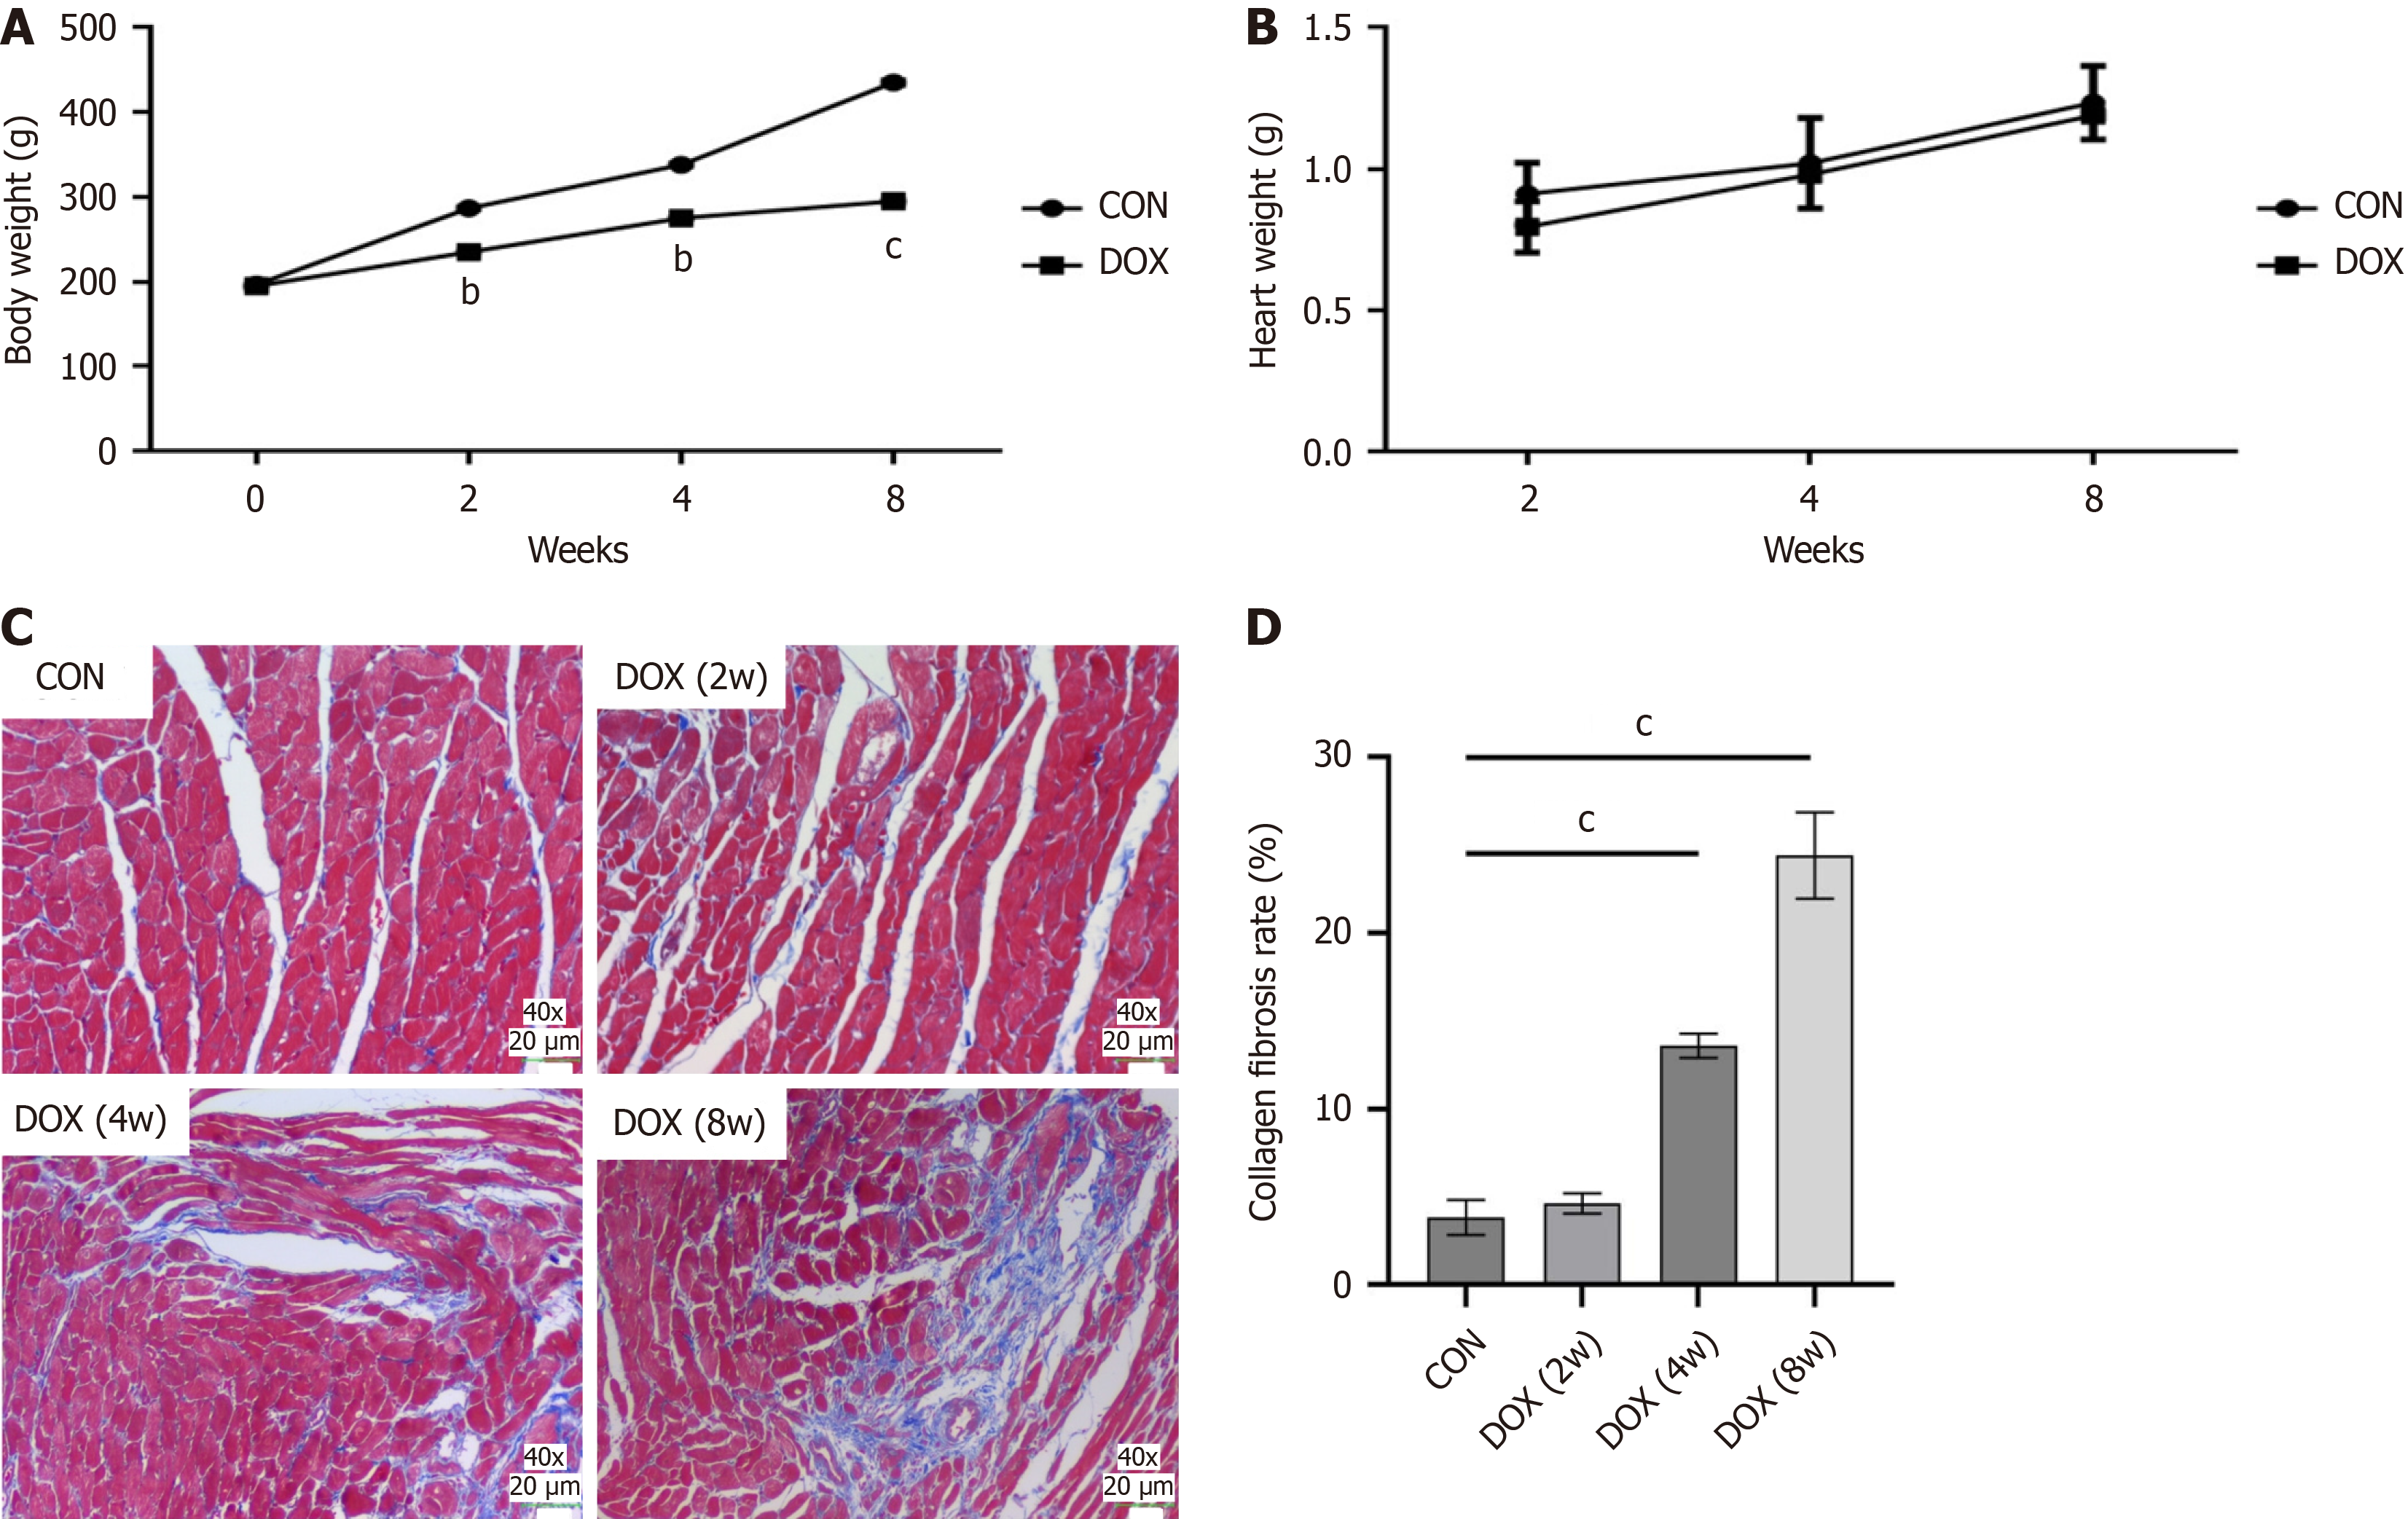
Figure 1 Doxorubicin induced changes.
A: Doxorubicin induced changes in body weight; B: Doxorubicin induced changes in heart weight of rats in each group; C: Doxorubicin caused pathological damage in the myocardium; D: Doxorubicin caused changes in collagen fibrosis rate. The results of Masson staining were observed under a microscope (40 ×) (n = 6). Data are expressed as mean ± SD, bP < 0.01, cP < 0.001 vs control group (n = 6). DOX: Doxorubicin; CON: Control.
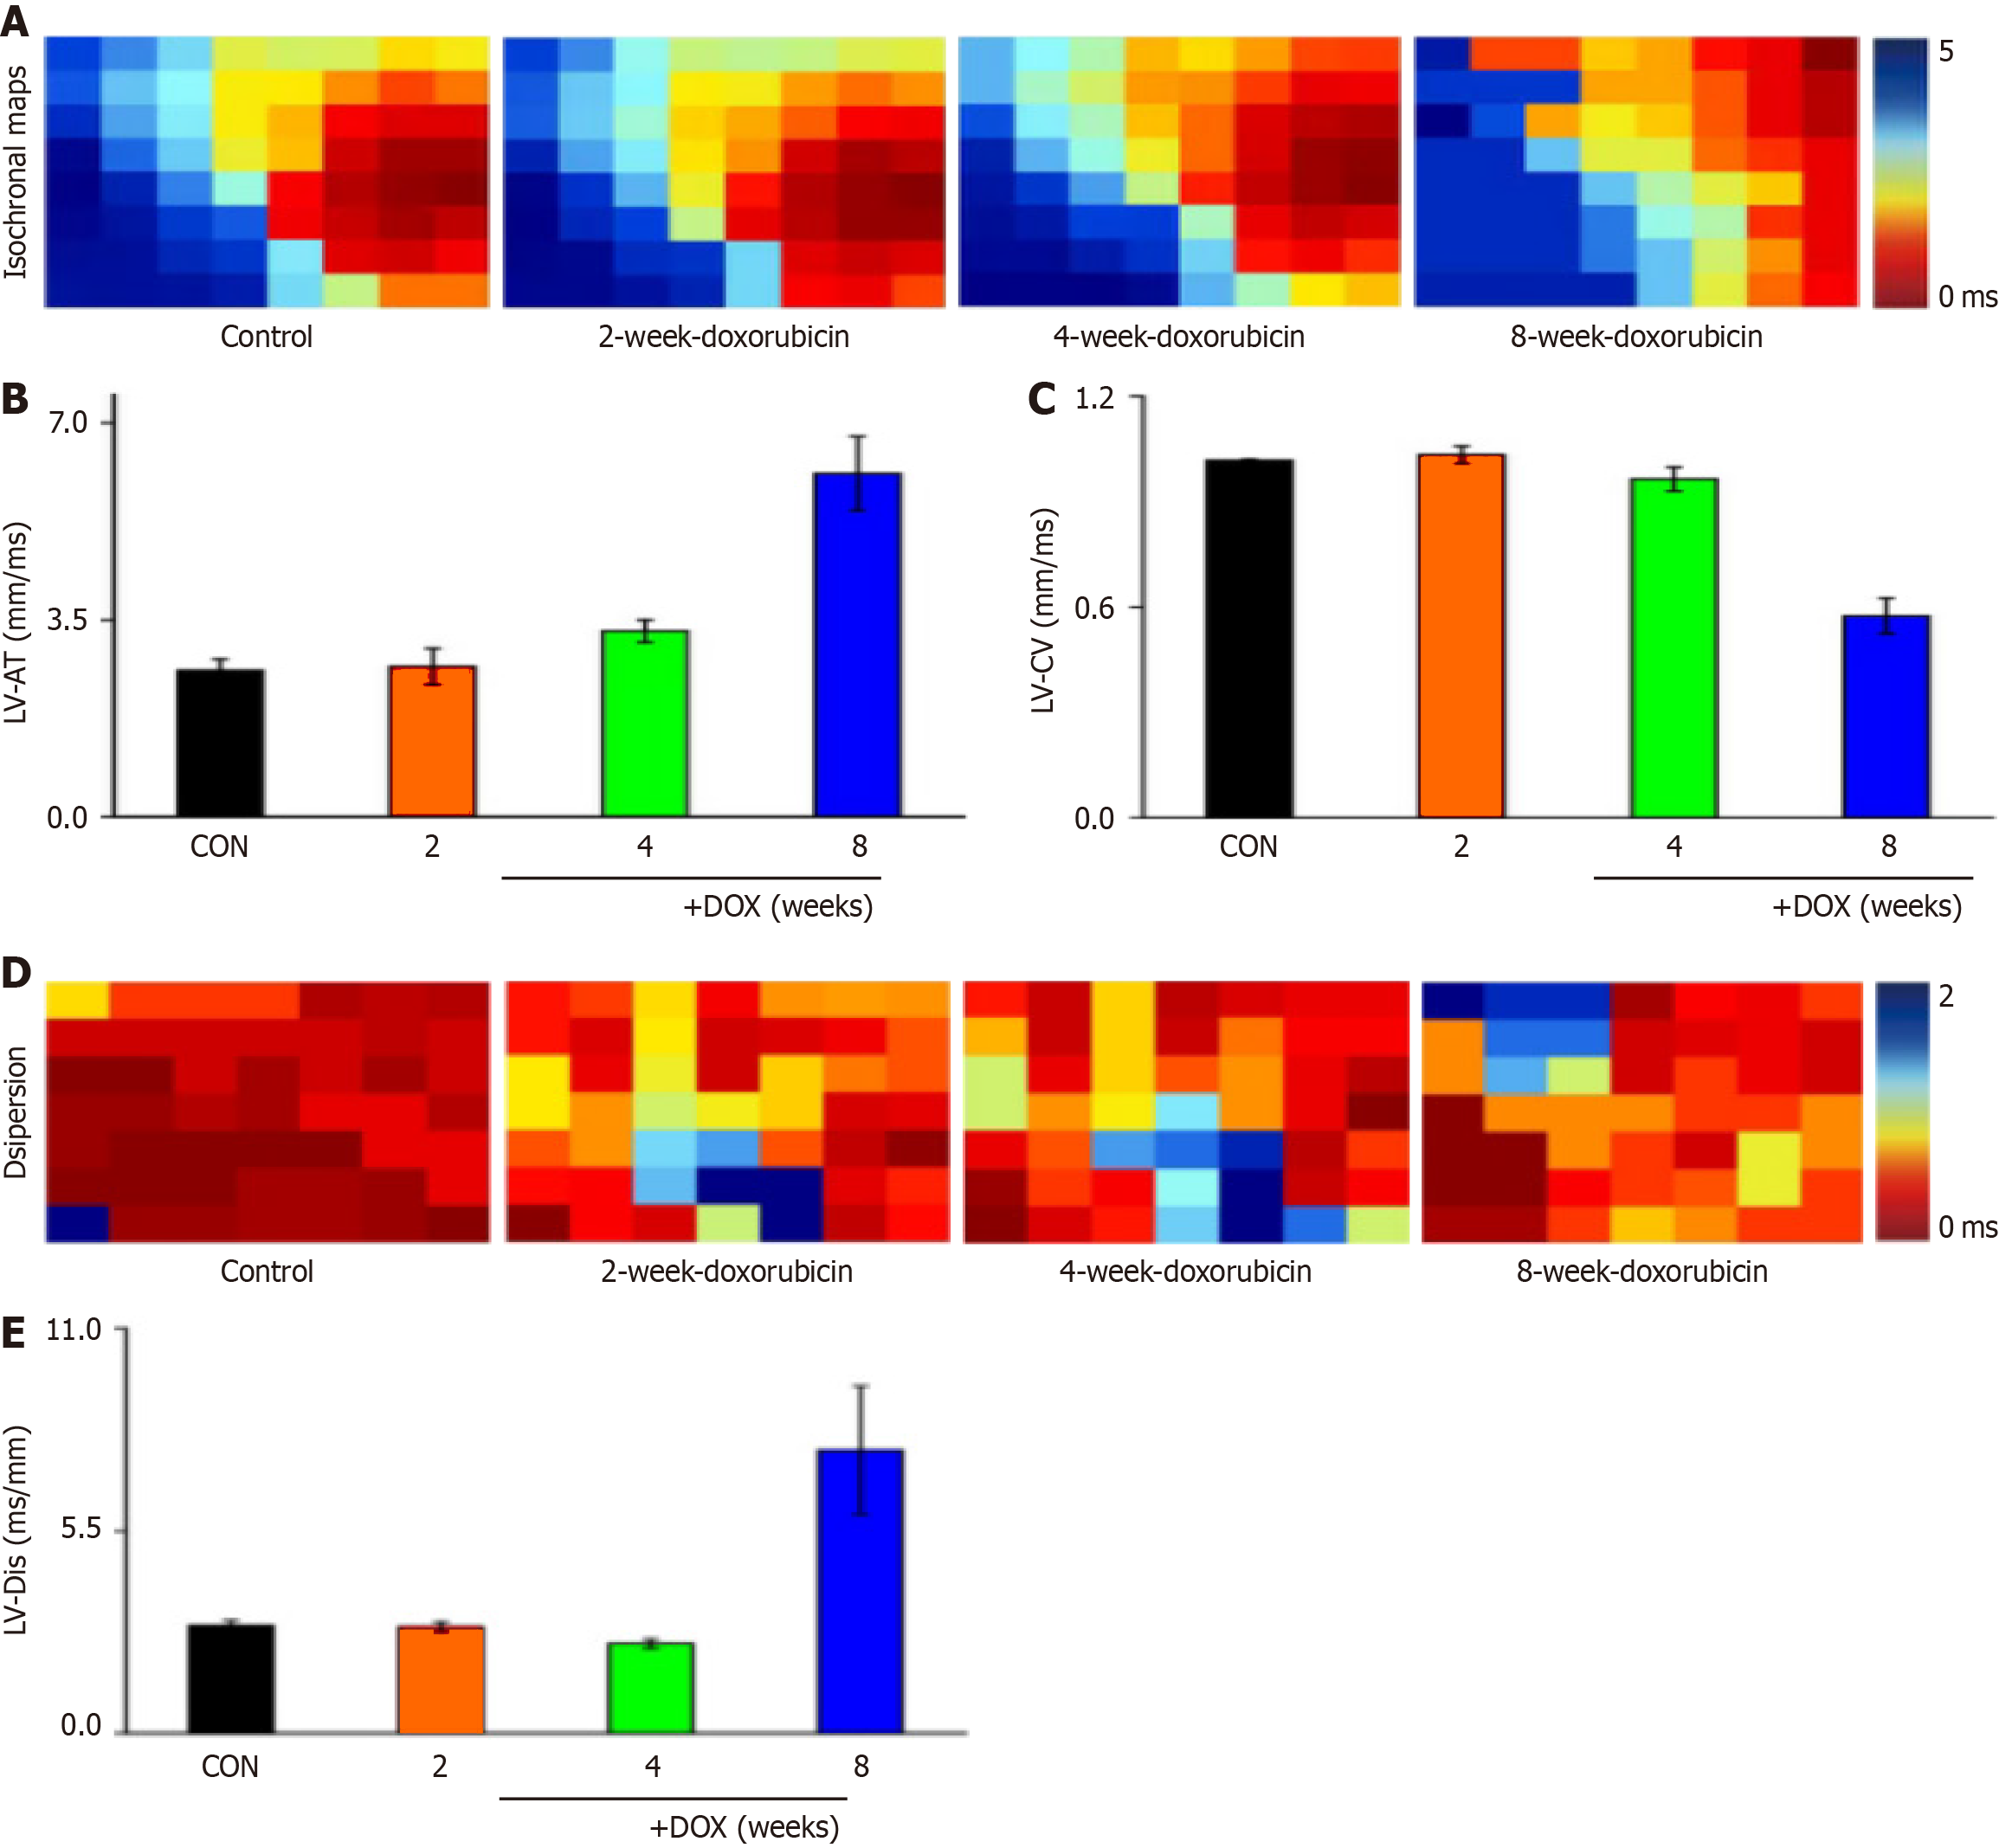
Figure 2 Effects of doxorubicin on cardiac conduction and conduction dispersion.
A: Representative plots of prolonged ventricular conduction time; B: Plot of changes in left ventricular conduction time in sinus conditions; C: Representative graphs of changes in left ventricular conduction velocity; D: Comparison of conduction dispersion maps; E: Comparison of conductance discrete bar charts. DOX: Doxorubicin; CON: Control; LV: Left ventricular.
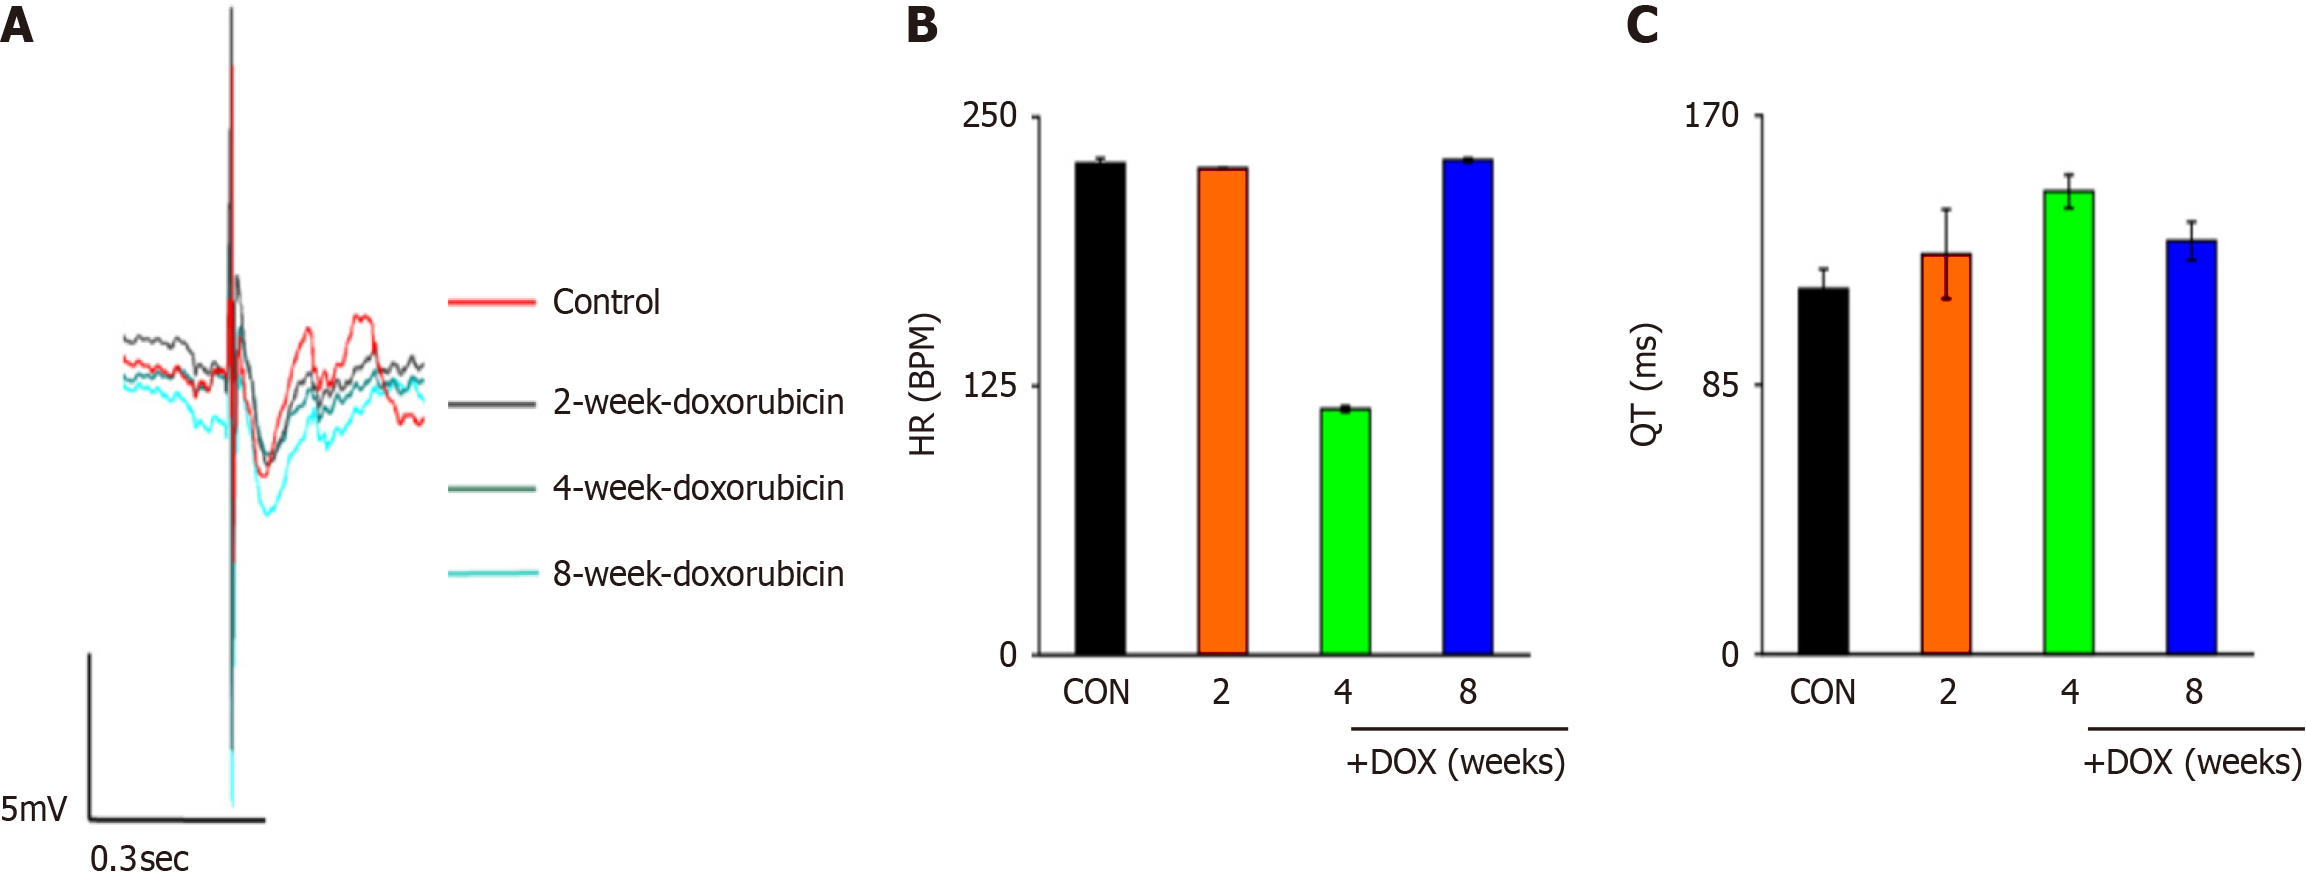
Figure 3 Effect of doxorubicin on the electrocardiogram of rat heart and the expression of connexin 43.
A: Representative graph of left ventricular field potentials; B: Heart rate variability; C: QT variations. DOX: Doxorubicin.
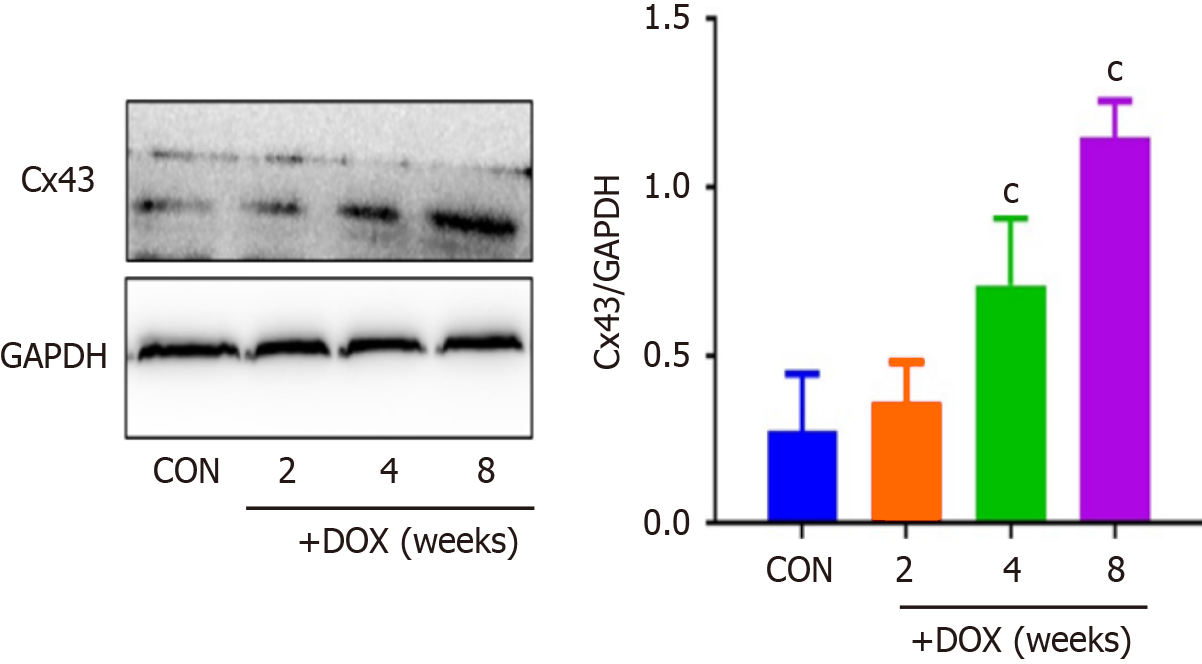
Figure 4 Effect of doxorubicin on expression of connexin 43.
Levels of Cx43 were measured by western blotting. Data are expressed as mean ± SD, cP < 0.001 vs control group (n = 6) and (n = 3). DOX: Doxorubicin; CON: Control.
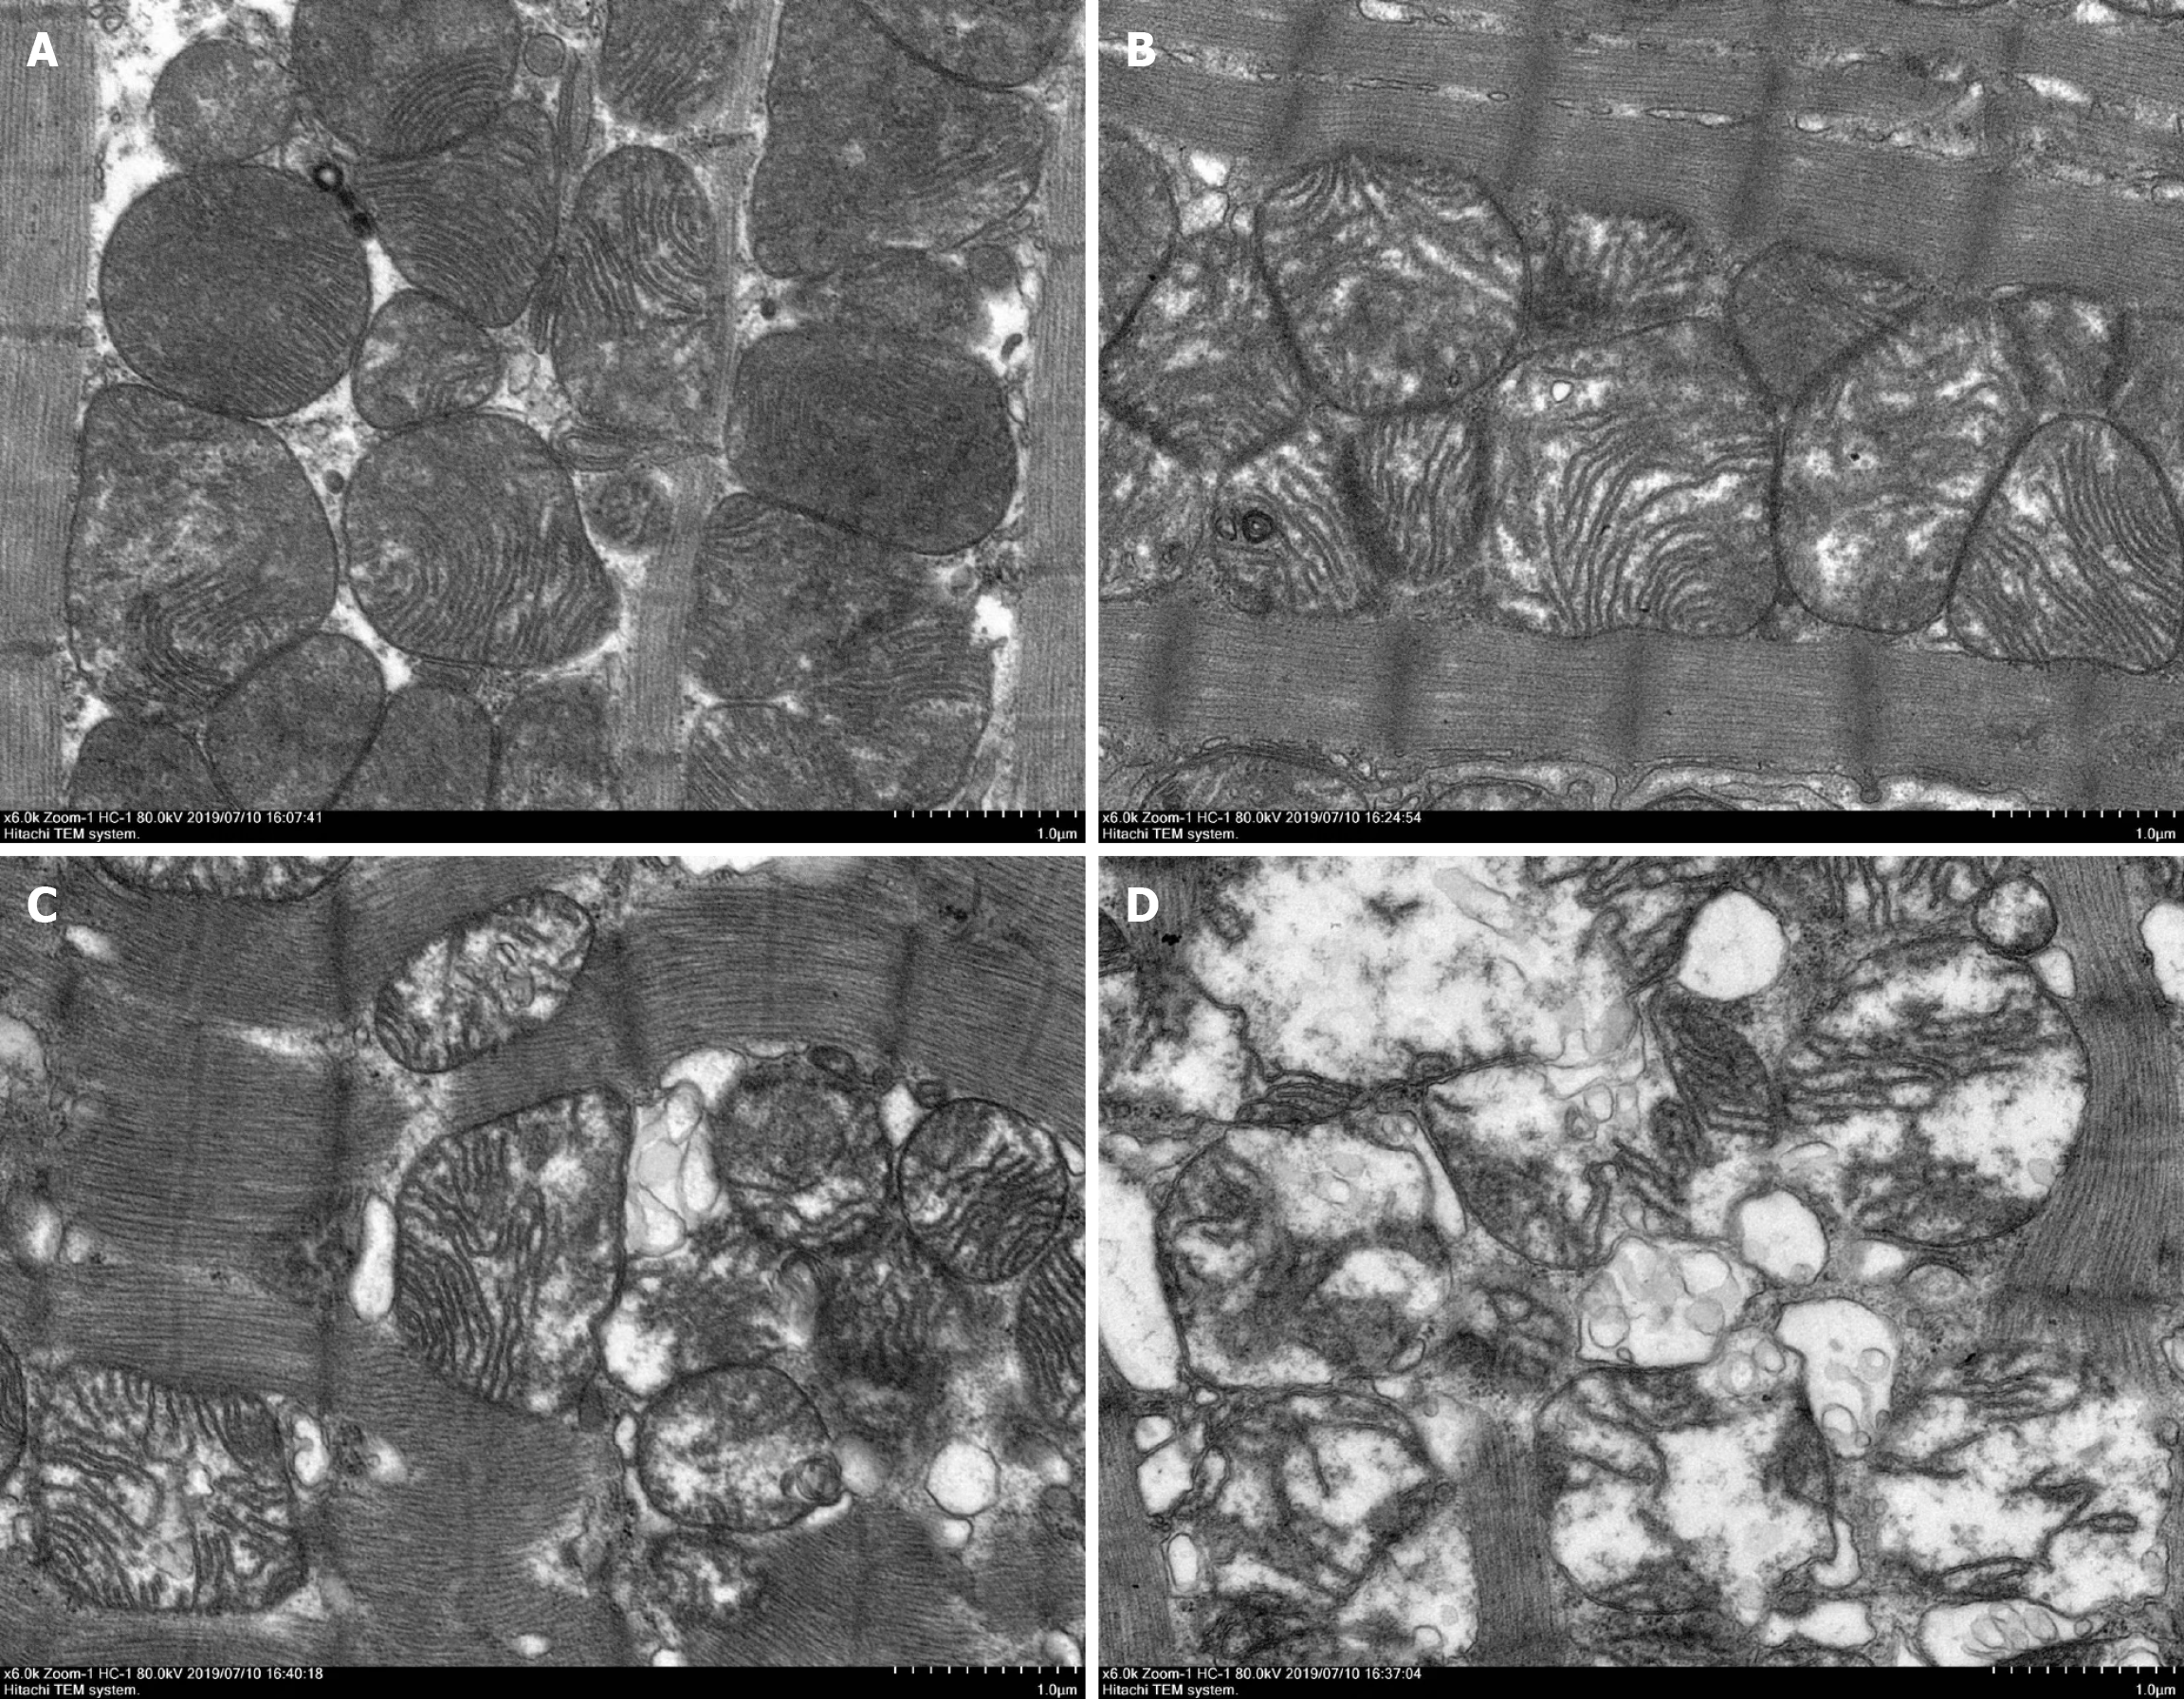
Figure 5 Doxorubicin altered the ultrastructural of myocardial tissue.
Transmission electron microscopy results, and cell morphology under inverted microscope (1.0 μm) (n = 6). A: Control; B: Doxorubicin (DOX) (2w); C: DOX (4w); D: DOX (8w).
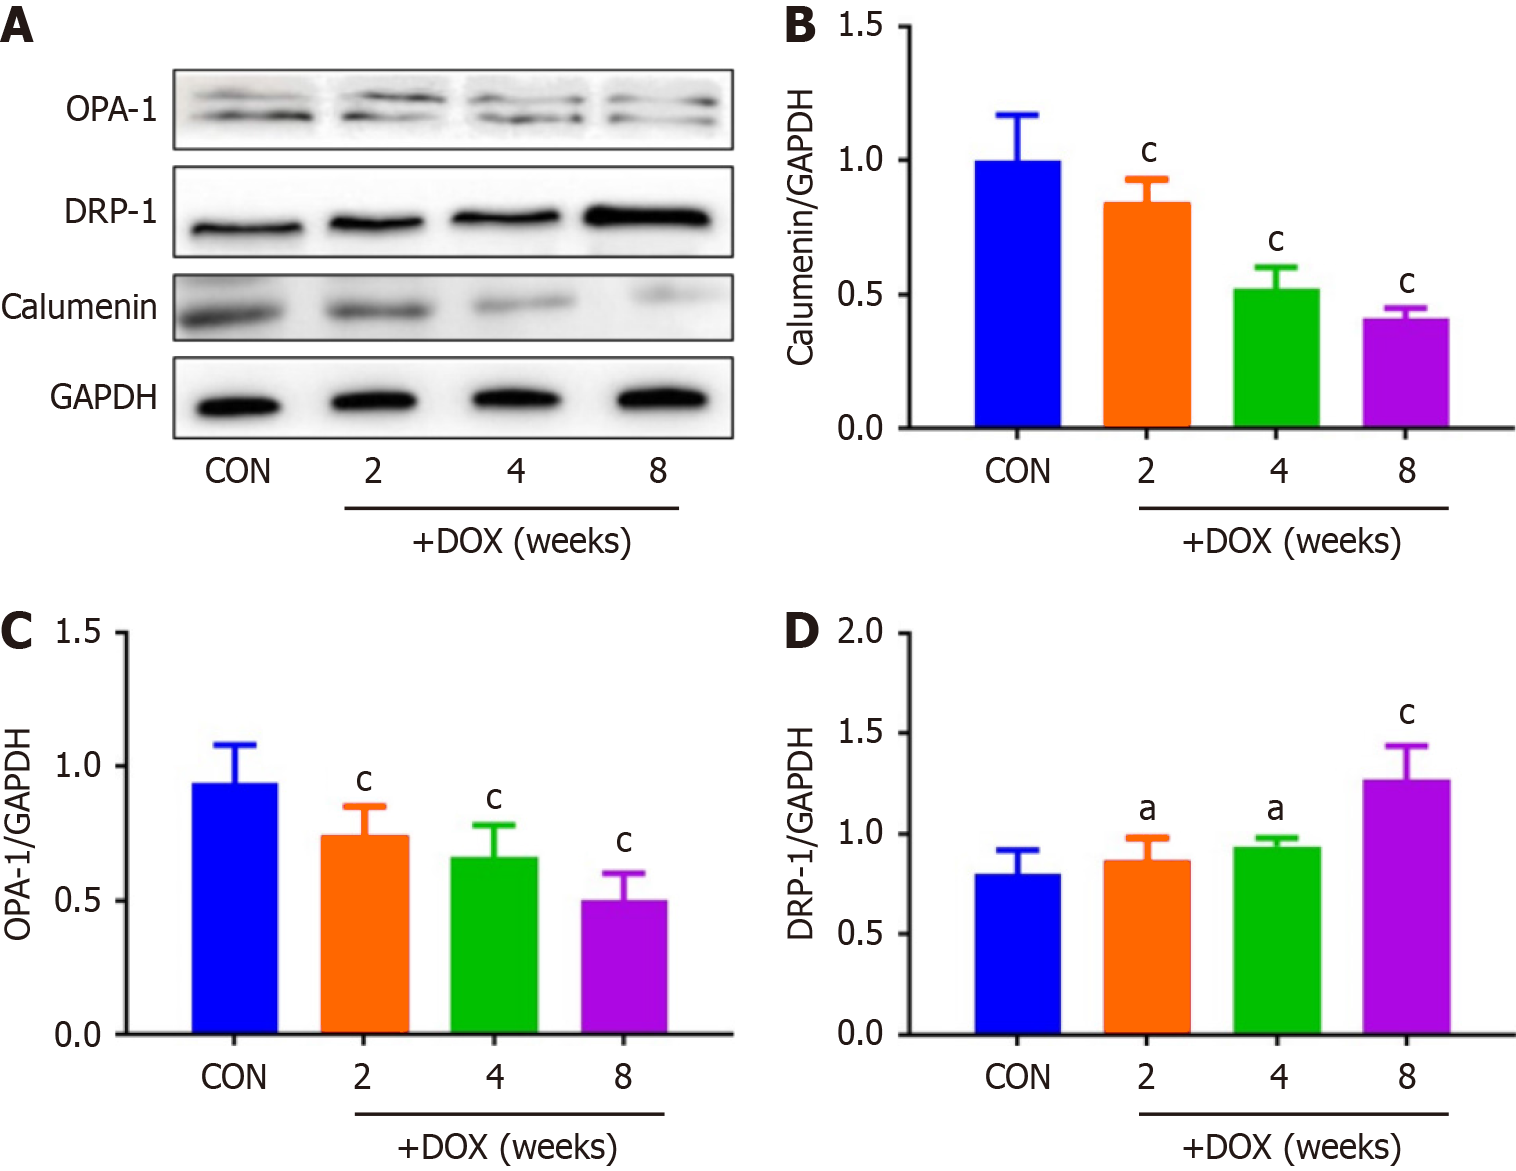
Figure 6 Doxorubicin influenced mitochondrial dynamics related proteins.
A: Protein levels of calumenin, optic atrophy 1 and dynamin-related protein 1 were measured by western blotting; B: Protein levels of calumenin; C: Protein levels of optic atrophy 1; D: Protein levels of dynamin-related protein 1. Data are expressed as mean ± SD, aP < 0.05, bP < 0.01, cP < 0.001 vs control (n = 6) and (n = 3). DOX: Doxorubicin; CON: Control; OPA-1: Optic atrophy 1; DRP-1: Dynamin-related protein 1.
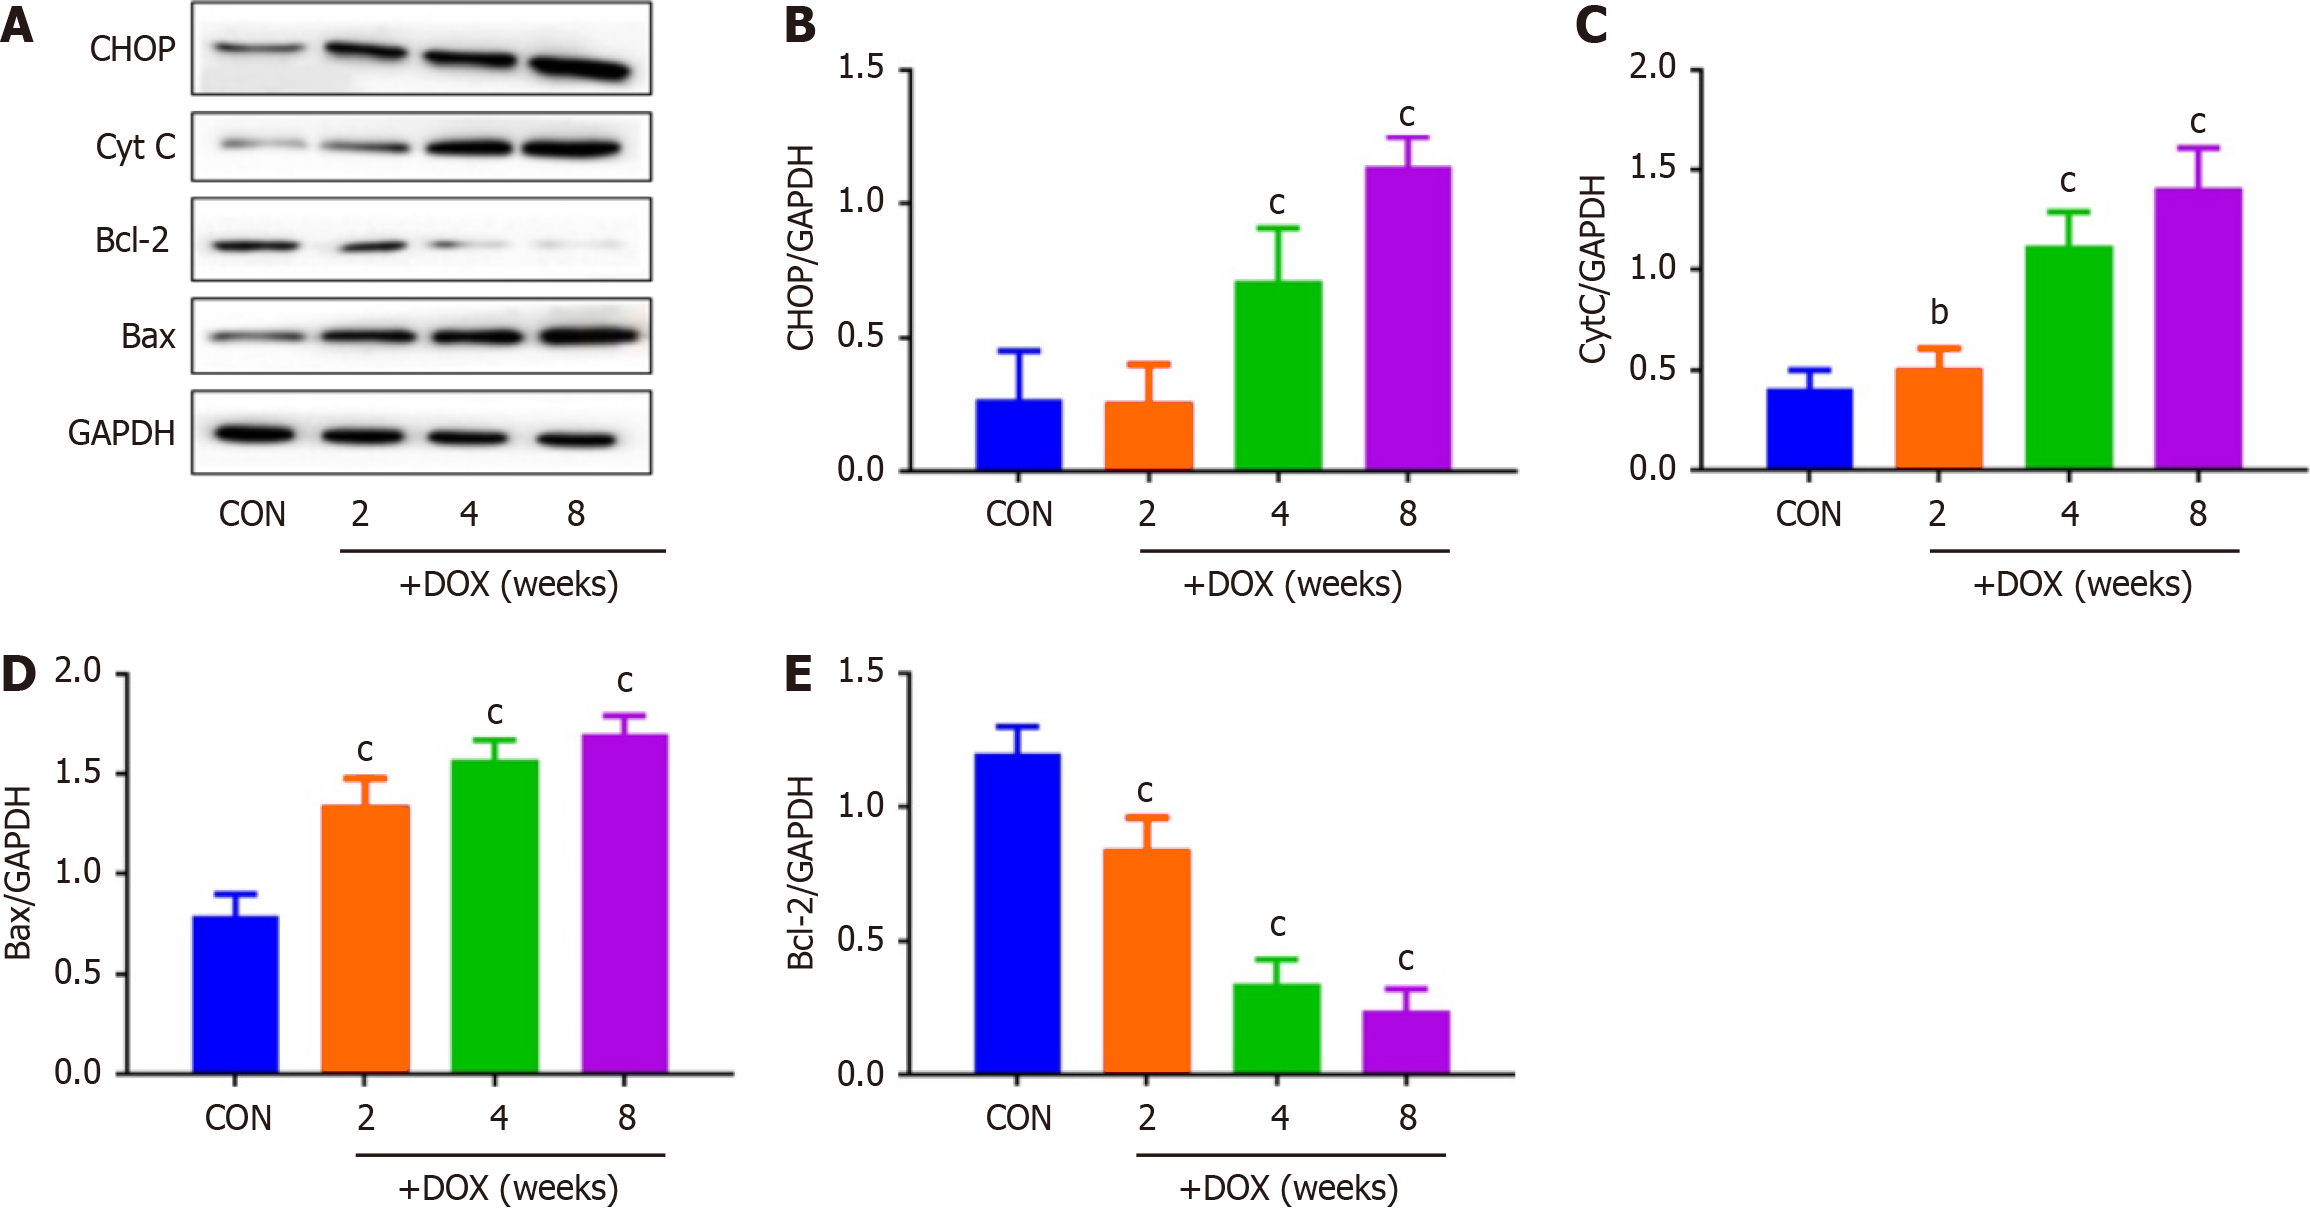
Figure 7 Doxorubicin attenuated myocardial injury by inhibiting mitochondrial induced apoptosis.
A: Protein levels of CHOP, cytochrome C, Bax and Bcl-2 were measured by western blotting; B: Protein levels of CHOP; C: Protein levels of cytochrome C; D: Protein levels of bax; E: Protein levels of Bcl-2. Data are expressed as mean ± SD, aP < 0.05, bP < 0.01, cP < 0.001 vs control group (n = 6) and (n = 3). CytC: Cytochrome C; DOX: Doxorubicin; CON: Control.
- Citation: Shi H, Yang SA, Bai LY, Du JJ, Wu Z, He ZH, Liu H, Cui JY, Zhao M. Mechanism of myocardial damage induced by doxorubicin via calumenin-regulated mitochondrial dynamics and the calcium–Cx43 pathway. World J Cardiol 2025; 17(5): 104839
- URL: https://www.wjgnet.com/1949-8462/full/v17/i5/104839.htm
- DOI: https://dx.doi.org/10.4330/wjc.v17.i5.104839


