©The Author(s) 2020.
World J Cardiol. Jan 26, 2020; 12(1): 55-66
Published online Jan 26, 2020. doi: 10.4330/wjc.v12.i1.55
Published online Jan 26, 2020. doi: 10.4330/wjc.v12.i1.55
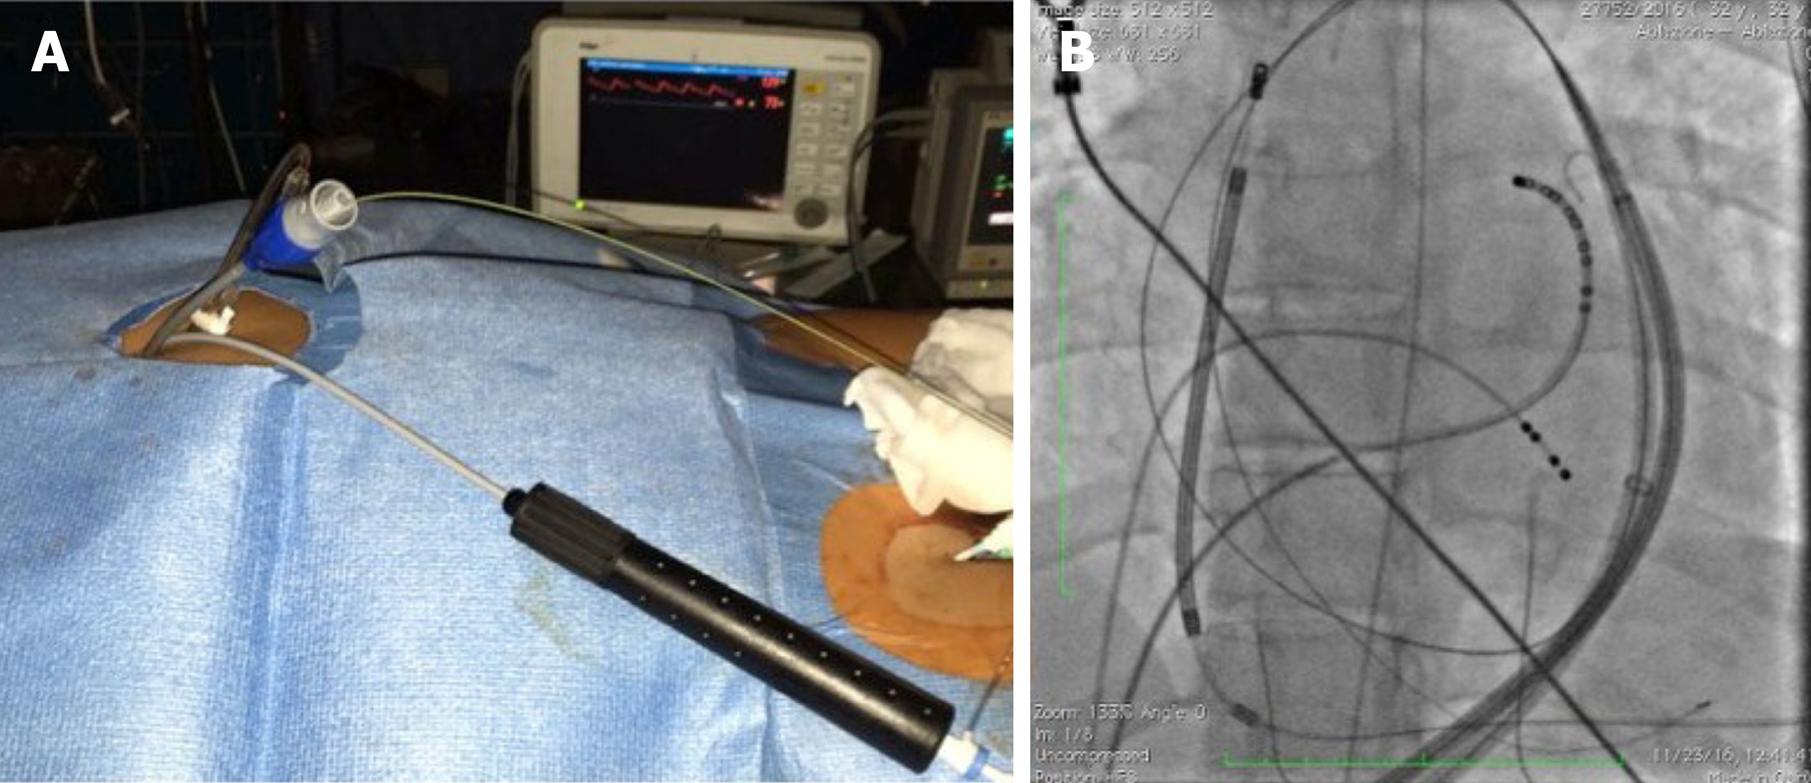
Figure 1 Epicardial access to insert a 12F introducer sheath with a hydrophilic coating.
A: Secondary epicardial access and introduction of 12F introducer sheath with a hydrophilic coating; B: Fluoroscopy image of the second wire and introducer in the epicardial space.
Figure 2 Patient 1: The vascular balloon was inflated to displace the phrenic nerve.
A: Right anterior oblique 30 degrees; B: Left anterior oblique 30 degrees.
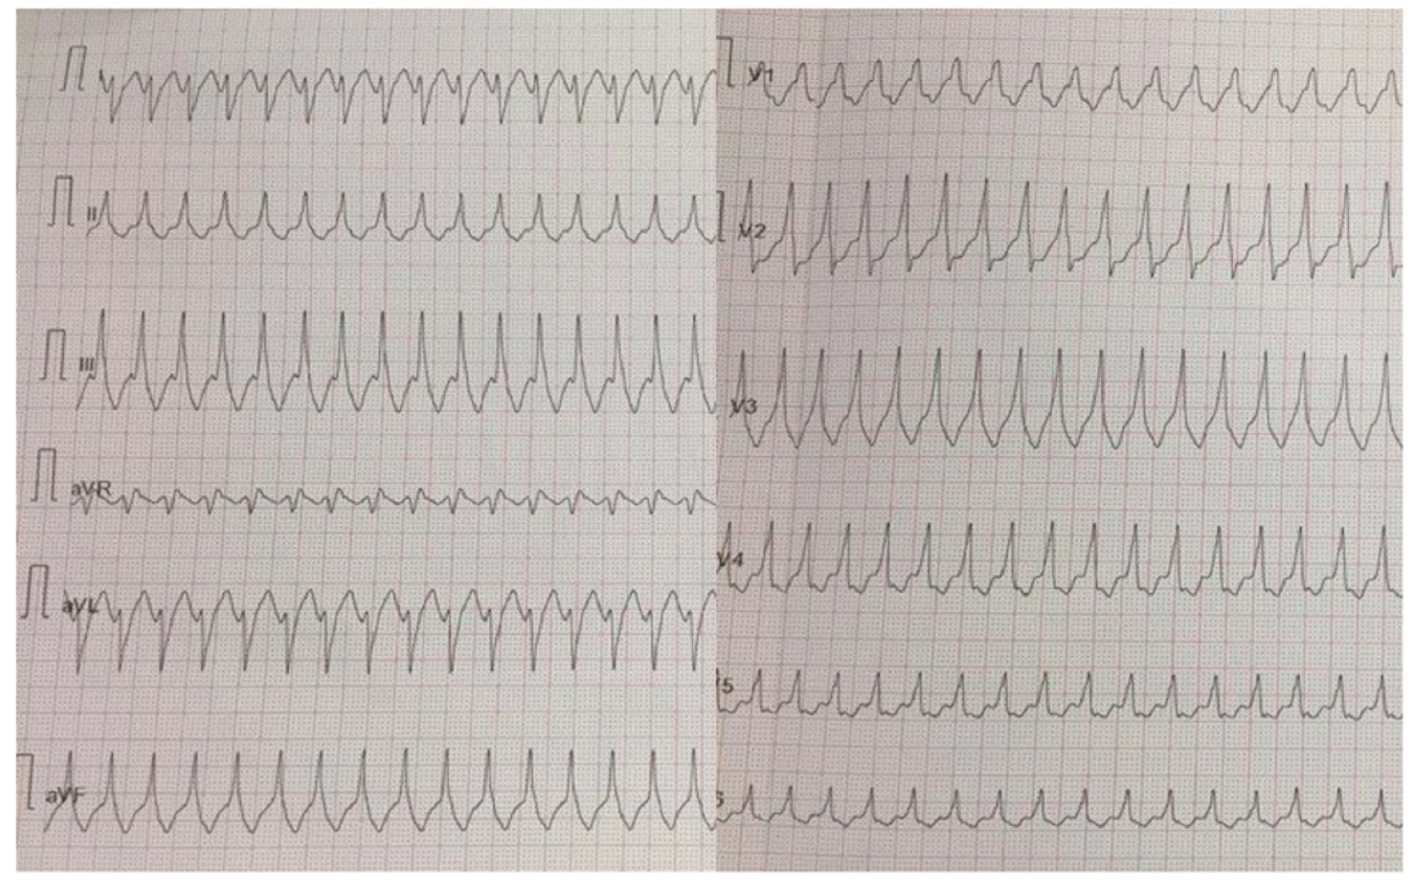
Figure 3 Patient 1: 12-lead ECG of ventricular tachycardia with a right bundle inferior axis morphology.
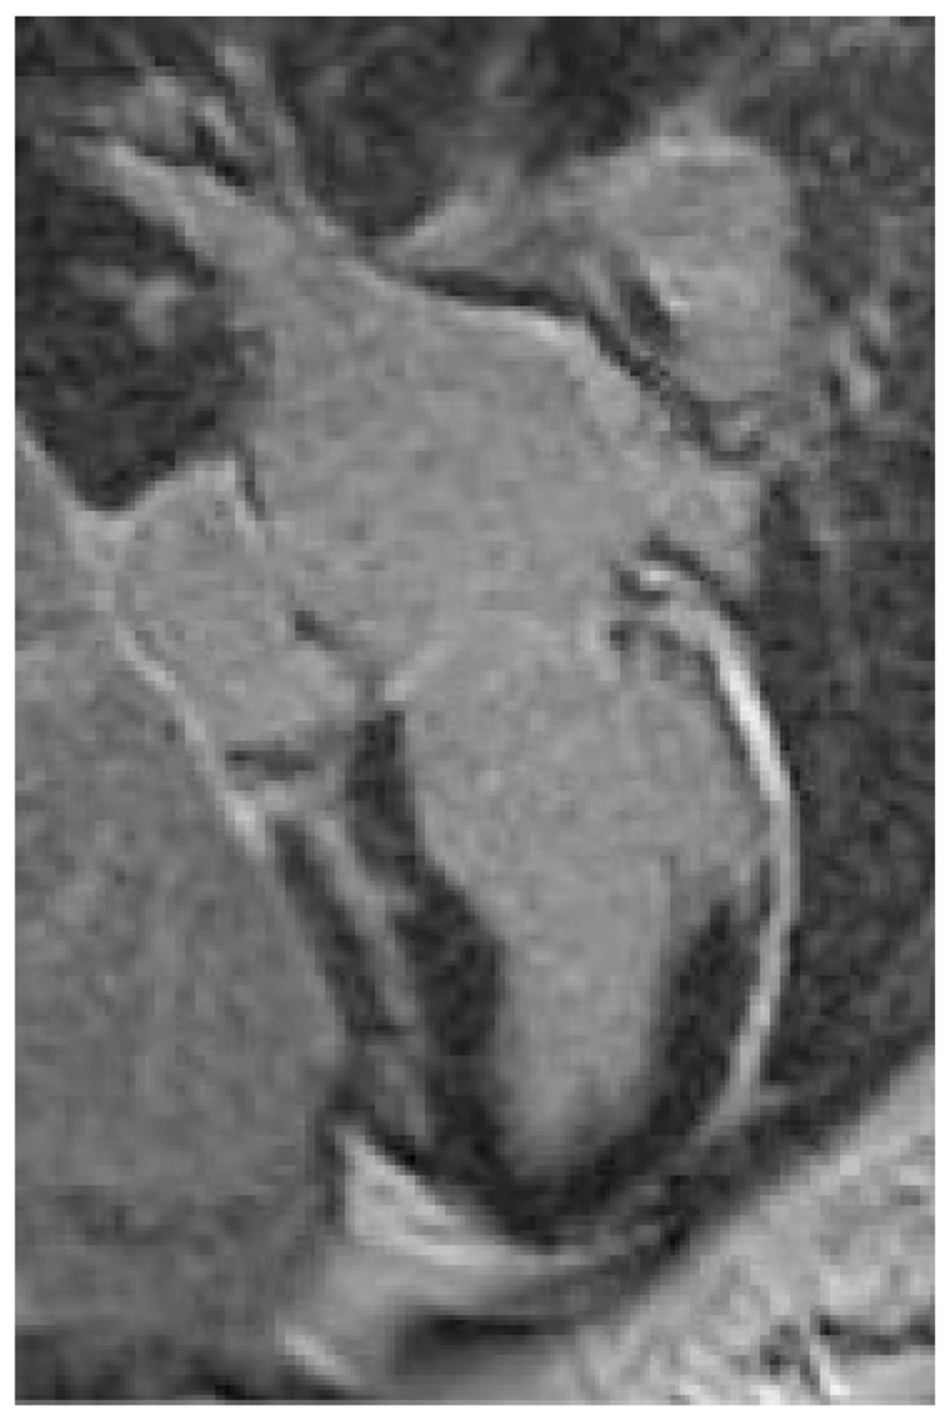
Figure 4 Patient 1: Cardiac magnetic resonance imaging showing intramural and transmural late-gadolinium enhancement in the basal anterolateral left ventricular wall and sub-epicardial late-gadolinium enhancement in the mid-basal lateral wall.
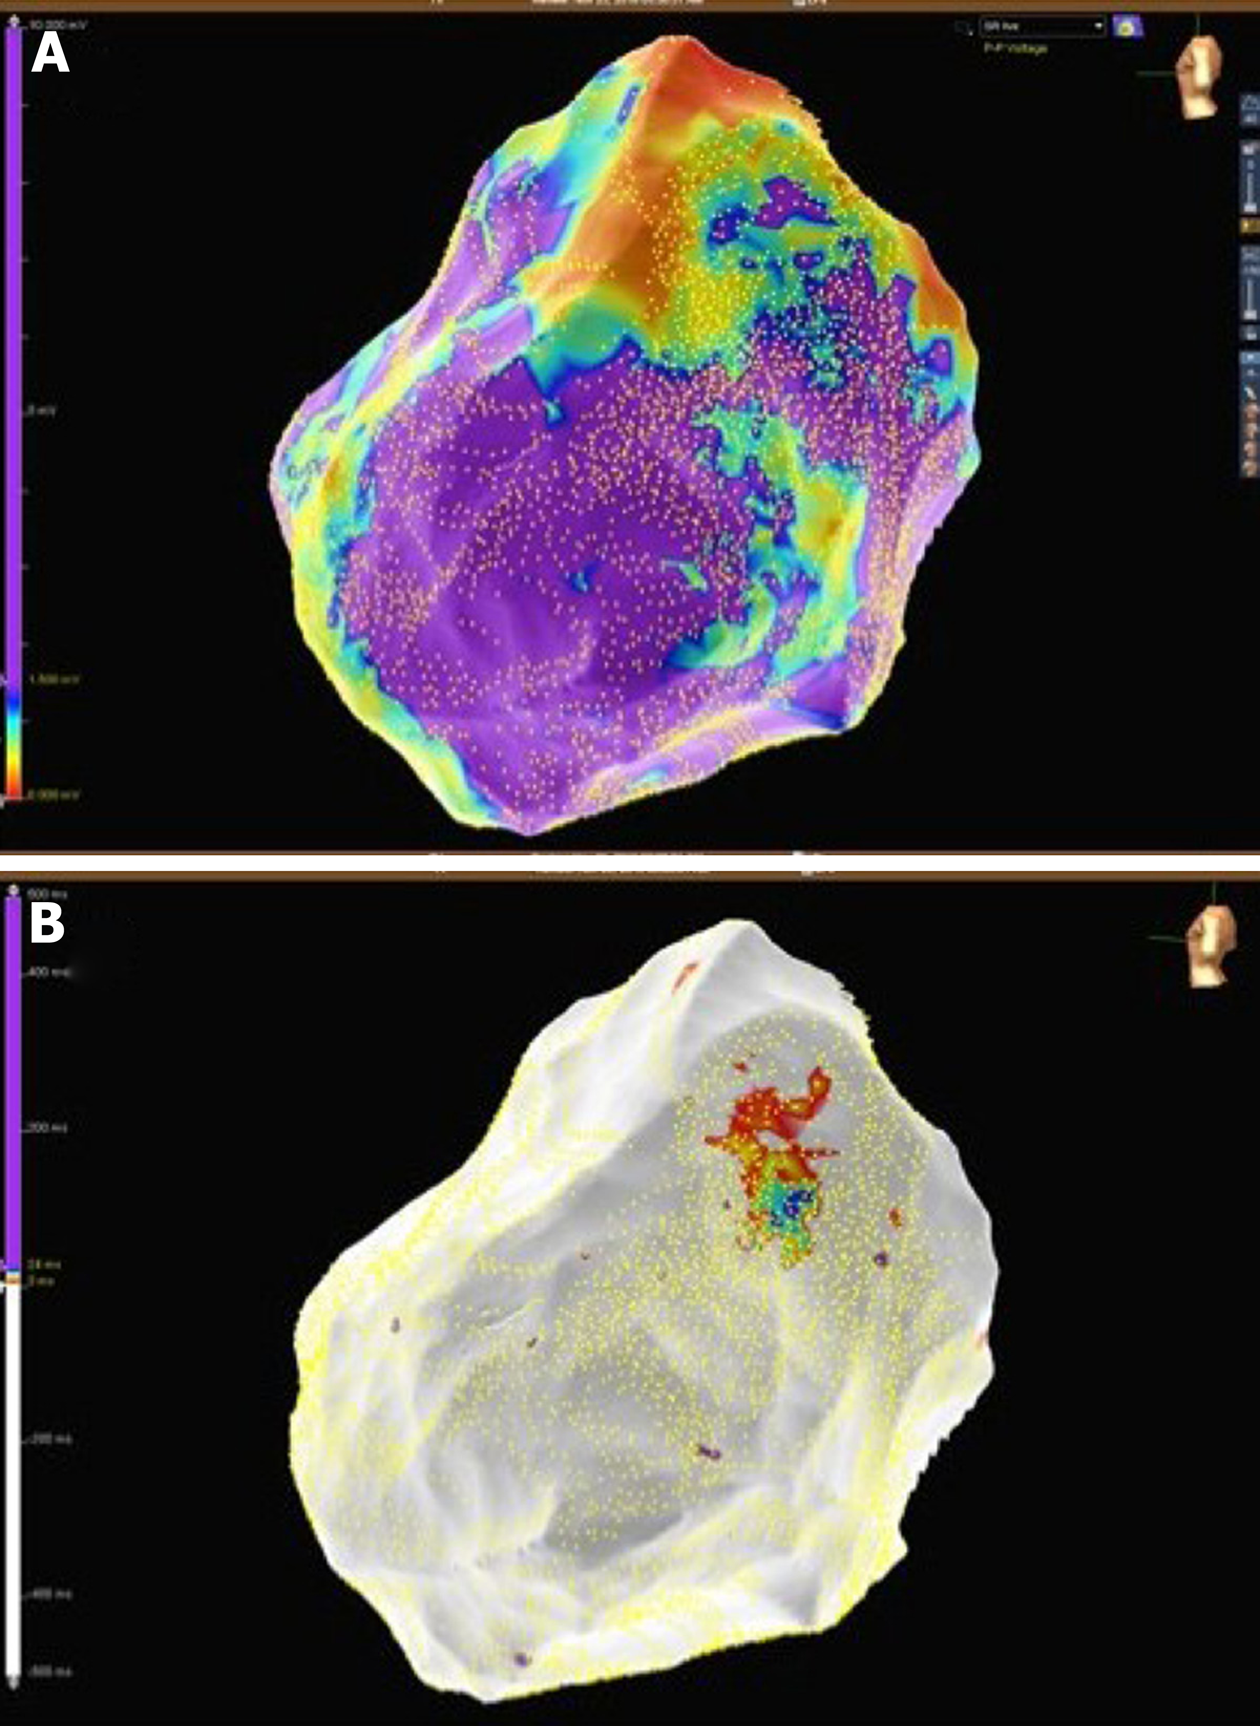
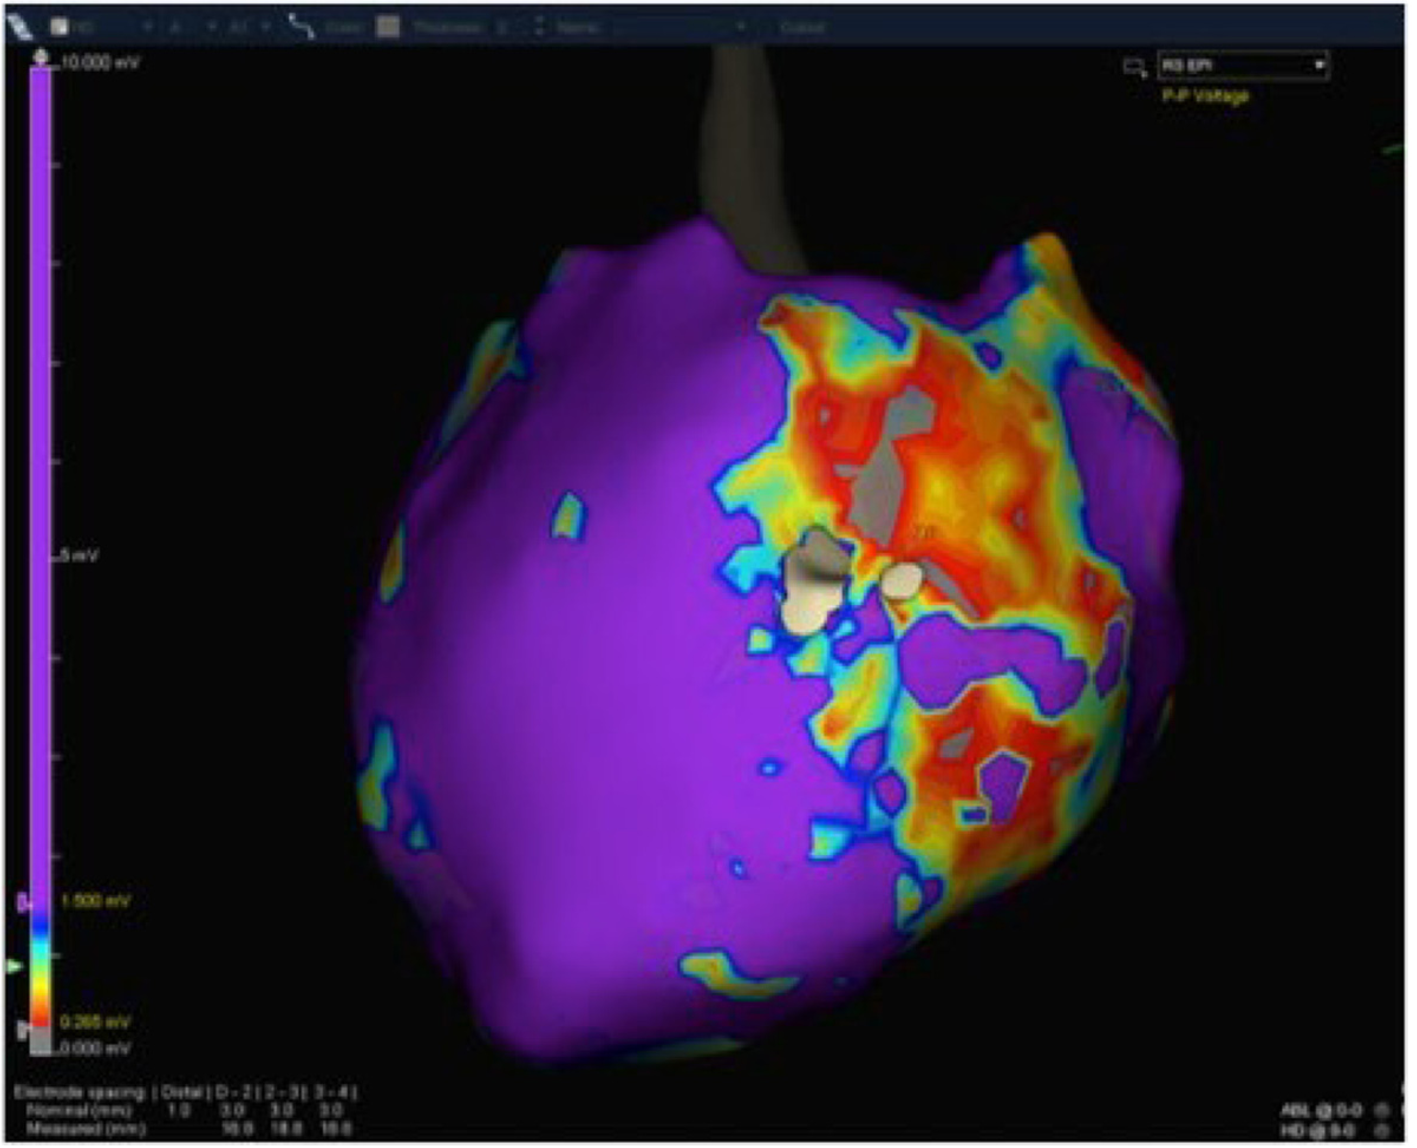
Figure 5 Patient 1: Mid-basal lateral epicardial scar and late potentials were identified within the epicardial scar.
A: Epicardial substrate map showing a basal lateral scar in the left ventricle; B: Epicardial late potentials map at the border zone of the epicardial scar.
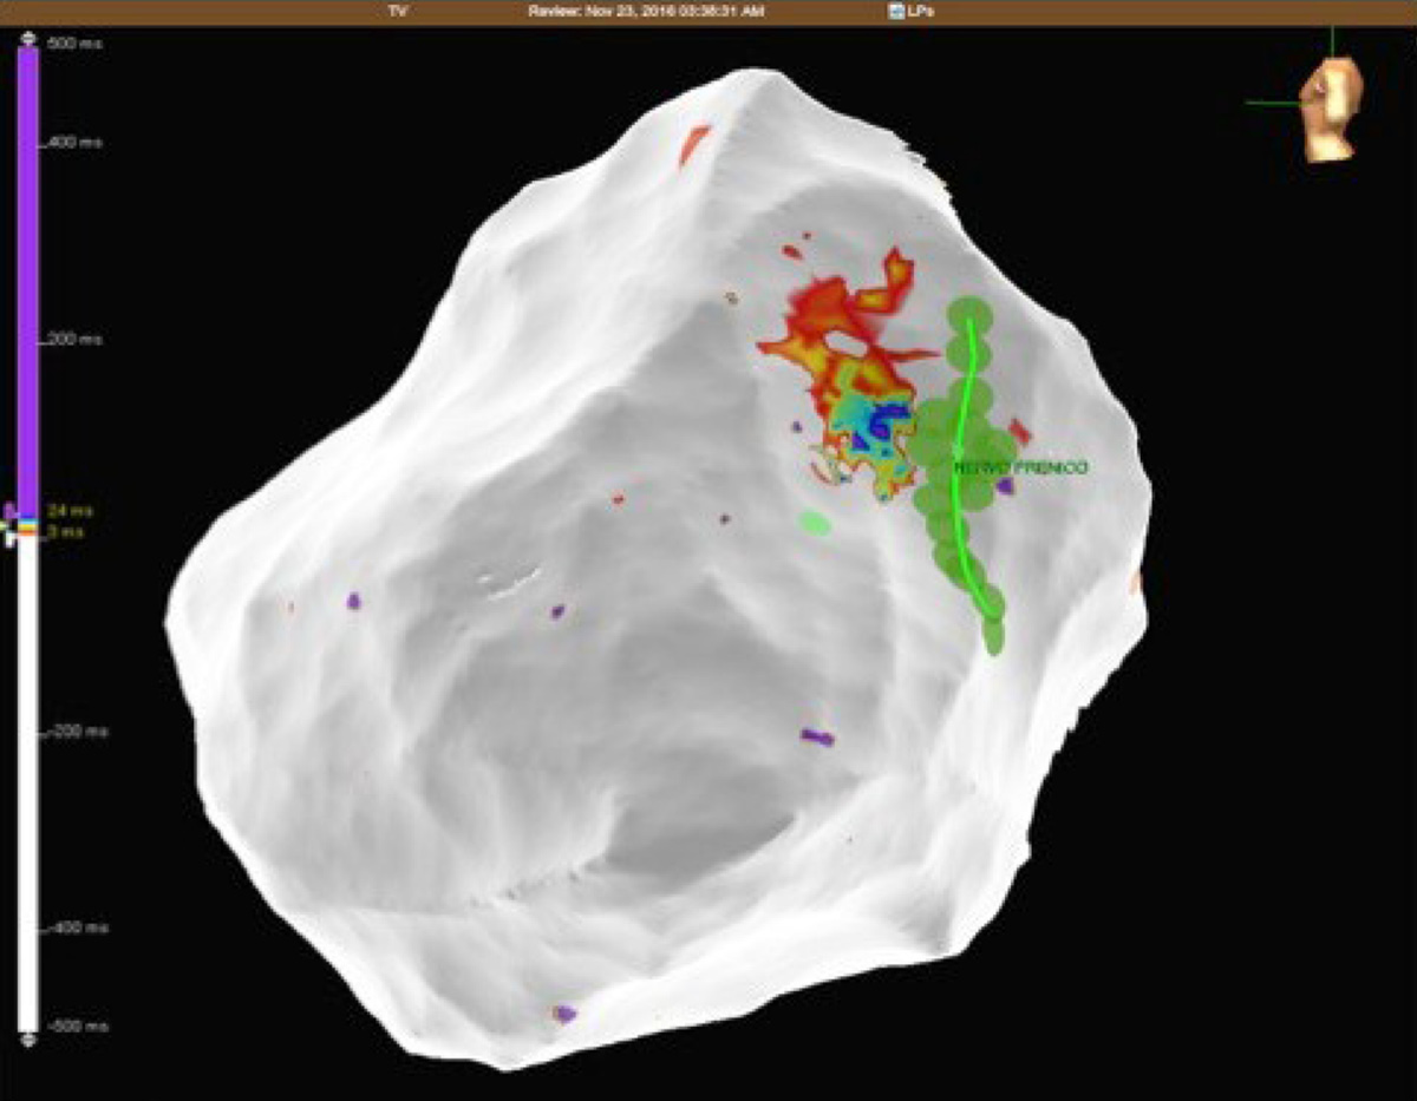
Figure 6 Patient 1: Epicardial late potentials map of the basal lateral segment of the left ventricle.
The phrenic nerve course is represented with green dots.
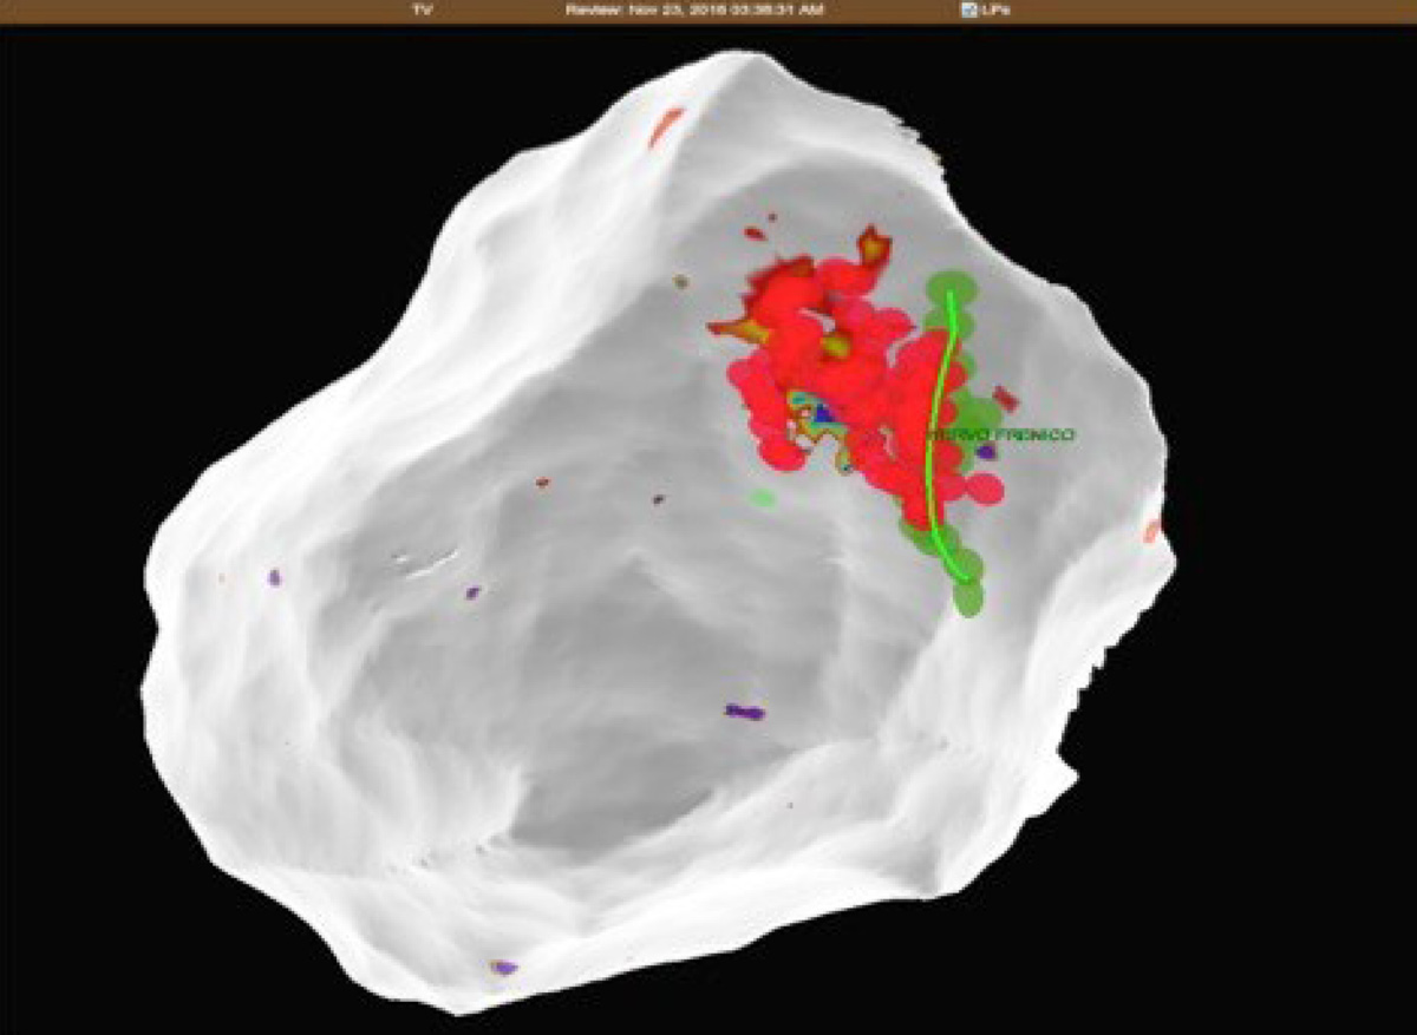
Figure 7 Patient 1: The close relationship between radiofrequency ablation points (red dots) and the phrenic nerve course (green dots and line).
Figure 8 Patient 2: 12-lead ECG of ventricular tachycardia with a right bundle inferior axis morphology.
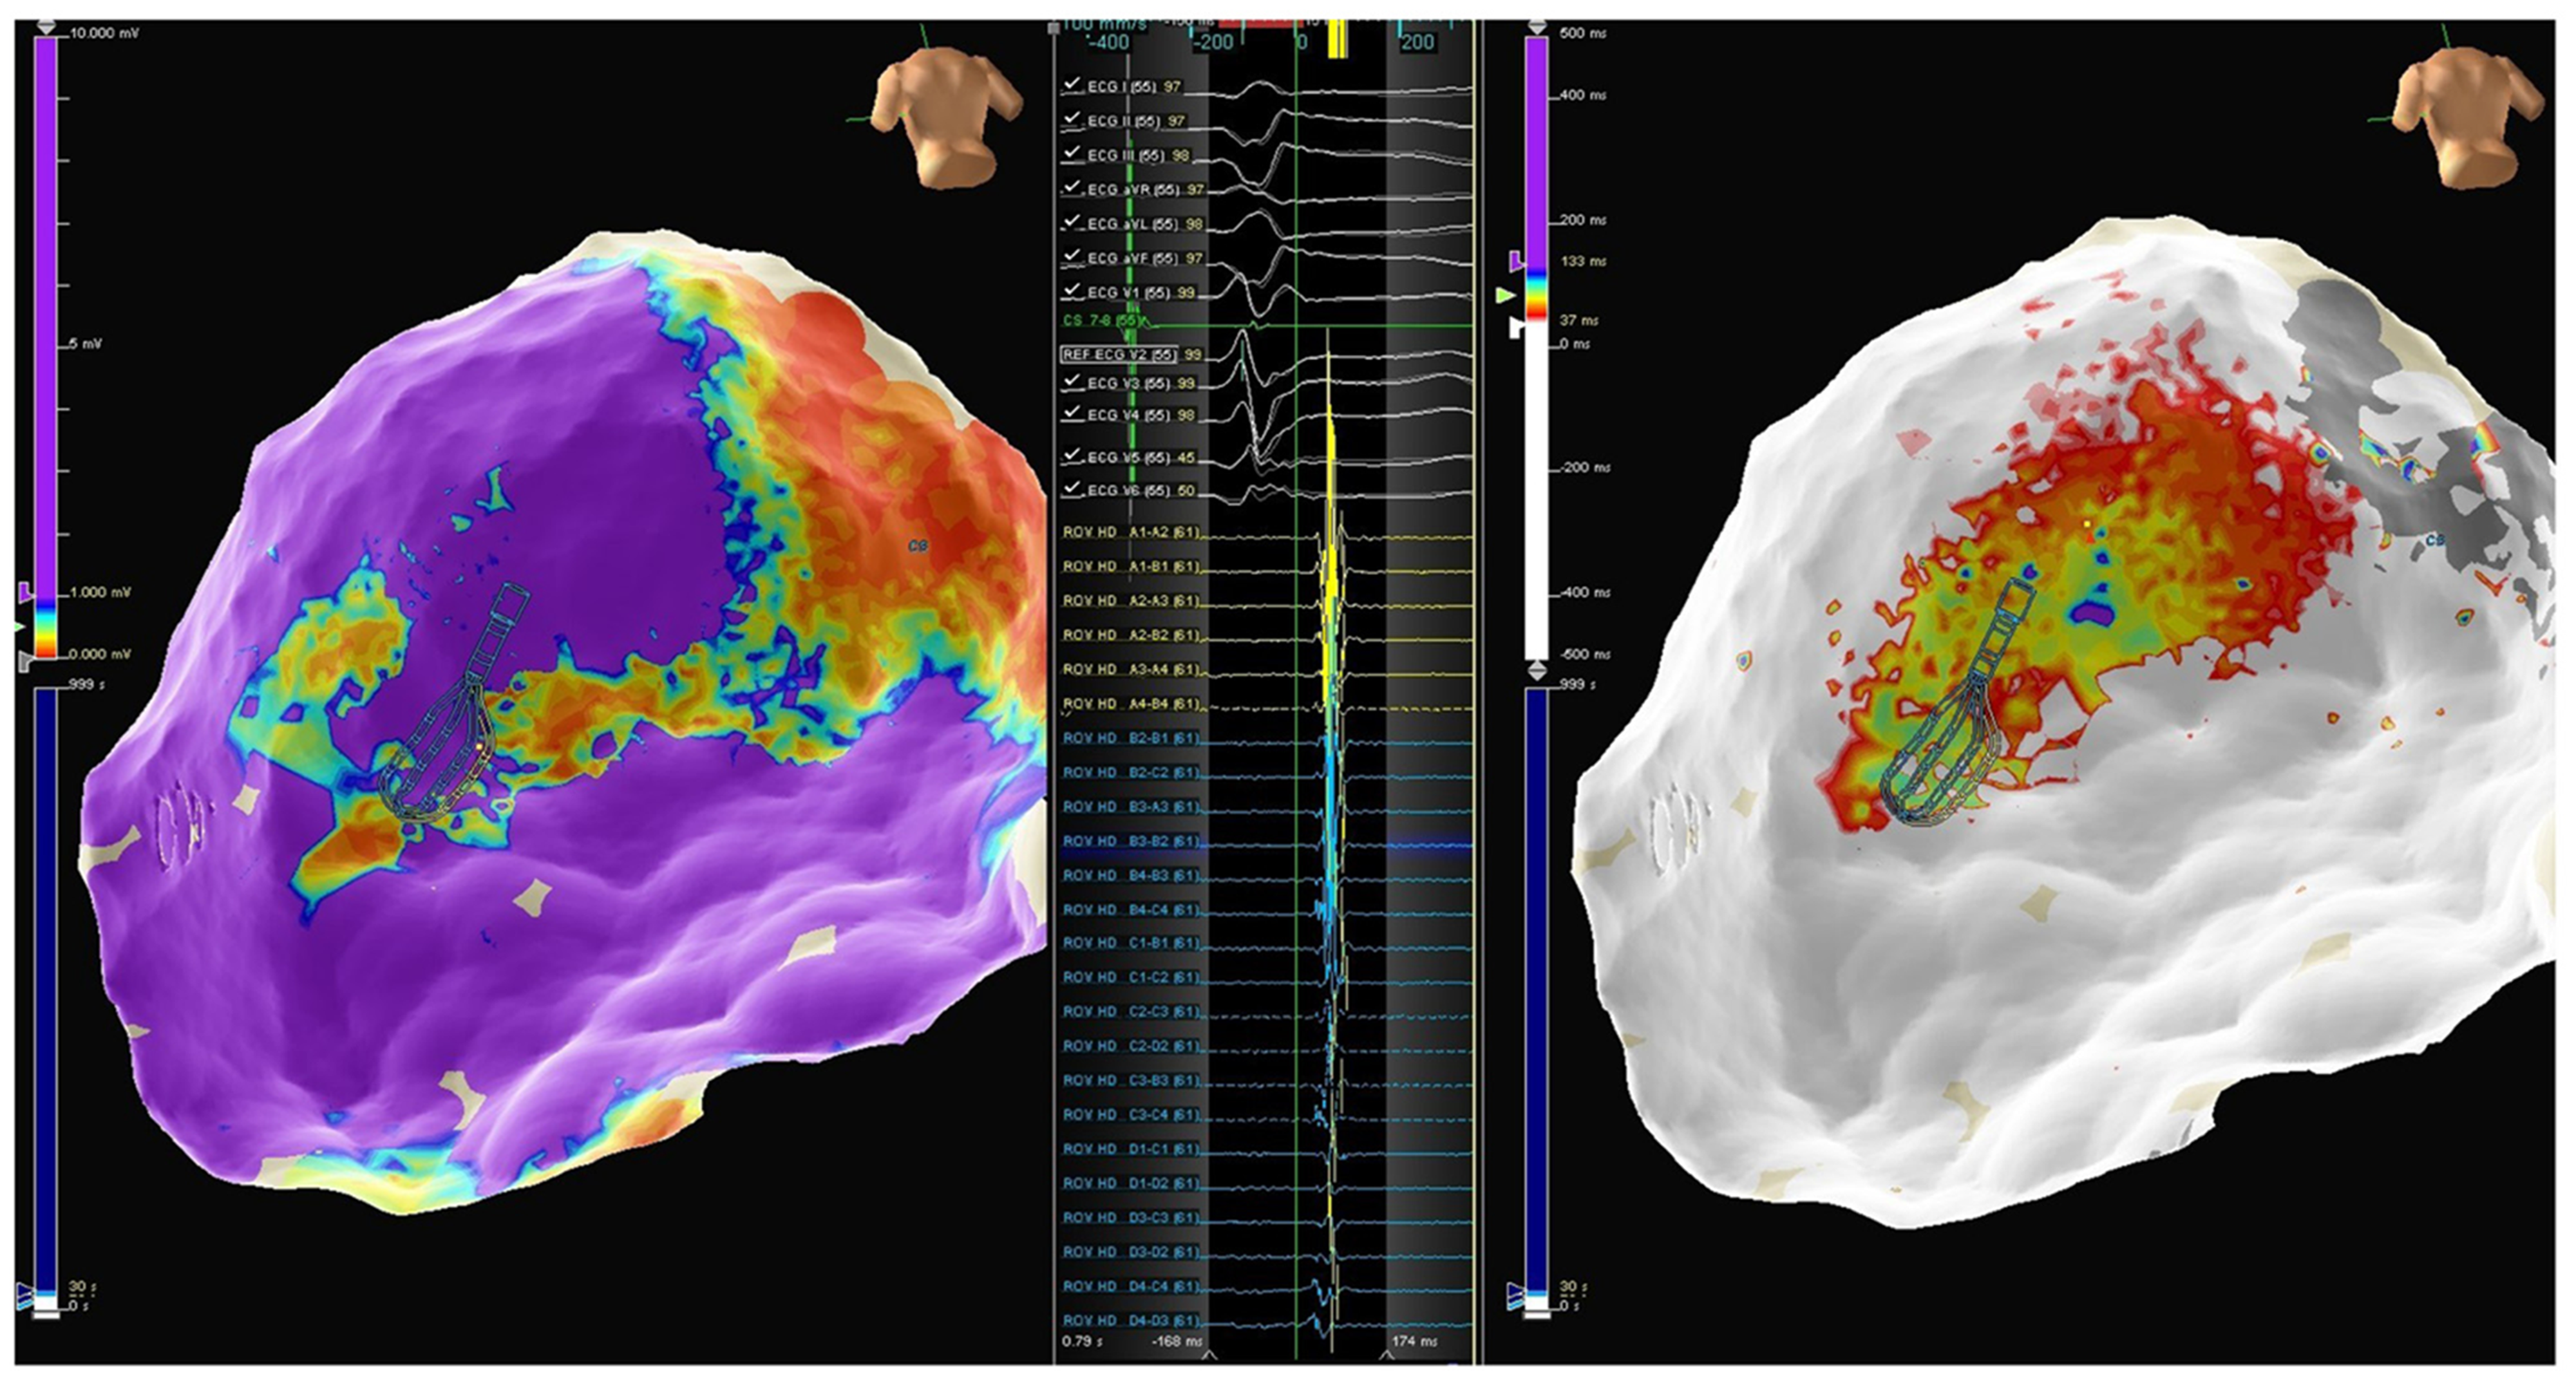
Figure 9 Patient 2: A basal posterolateral epicardial scar with late potentials.
Left panel: Epicardial activation map showing late potentials on the posterolateral left ventricular wall; Middle panel: Late potentials mapped using the LiveWire mapping catheter; Right panel: Epicardial substrate map showing the basal posterolateral scar.
Figure 10 Patient 3: Epicardial substrate map showing a wide scar extending from the basal lateral to the mid-posterolateral left ventricle wall.
Figure 11 Patient 3: The vascular balloon has been inflated to displace the phrenic nerve (Left anterior oblique 35 degrees).
Figure 12 Patient 4.
Left panel: Epicardial map showing an infero-postero-lateral mid-basal scar; Middle panel: Late potentials mapped using the Advisor HD Grid; Right panel: Epicardial activation map in sinus rhythm showing late potential around the superior aspect of the scar.
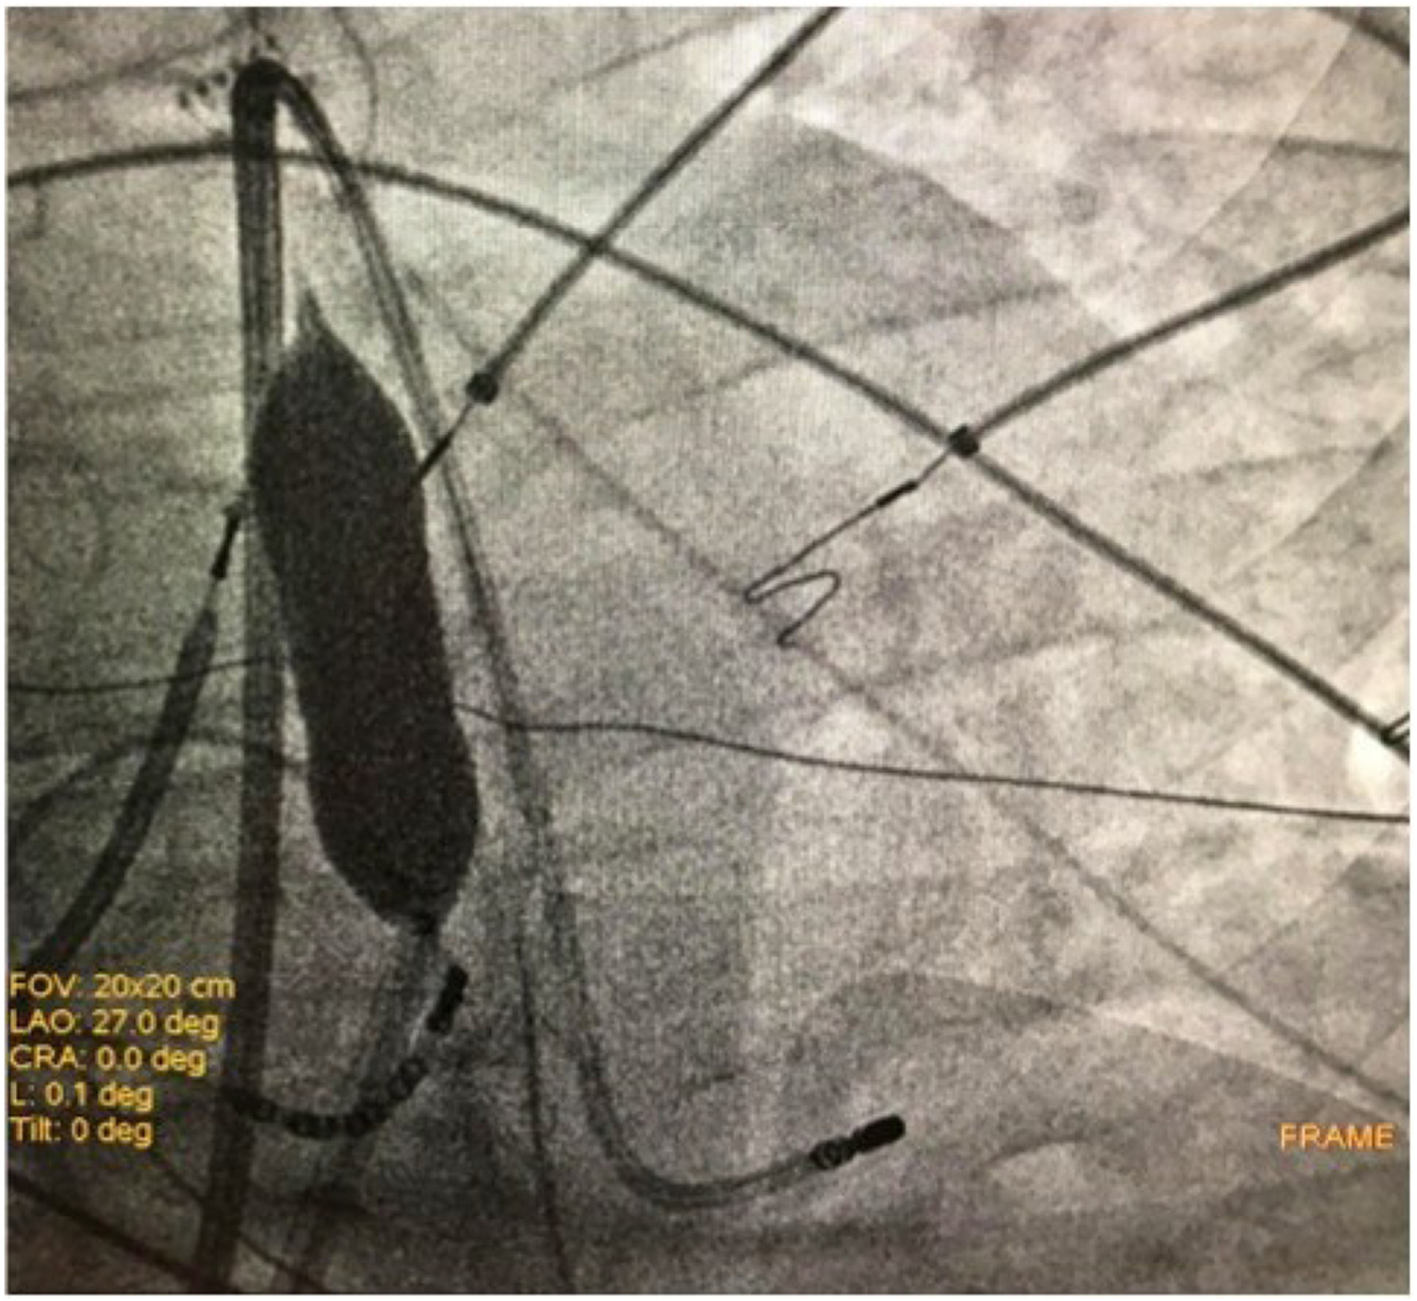
Figure 13 Patient 4: Inflation of the vascular balloon in the posterior epicardial space (Left anterior oblique 27 degrees).
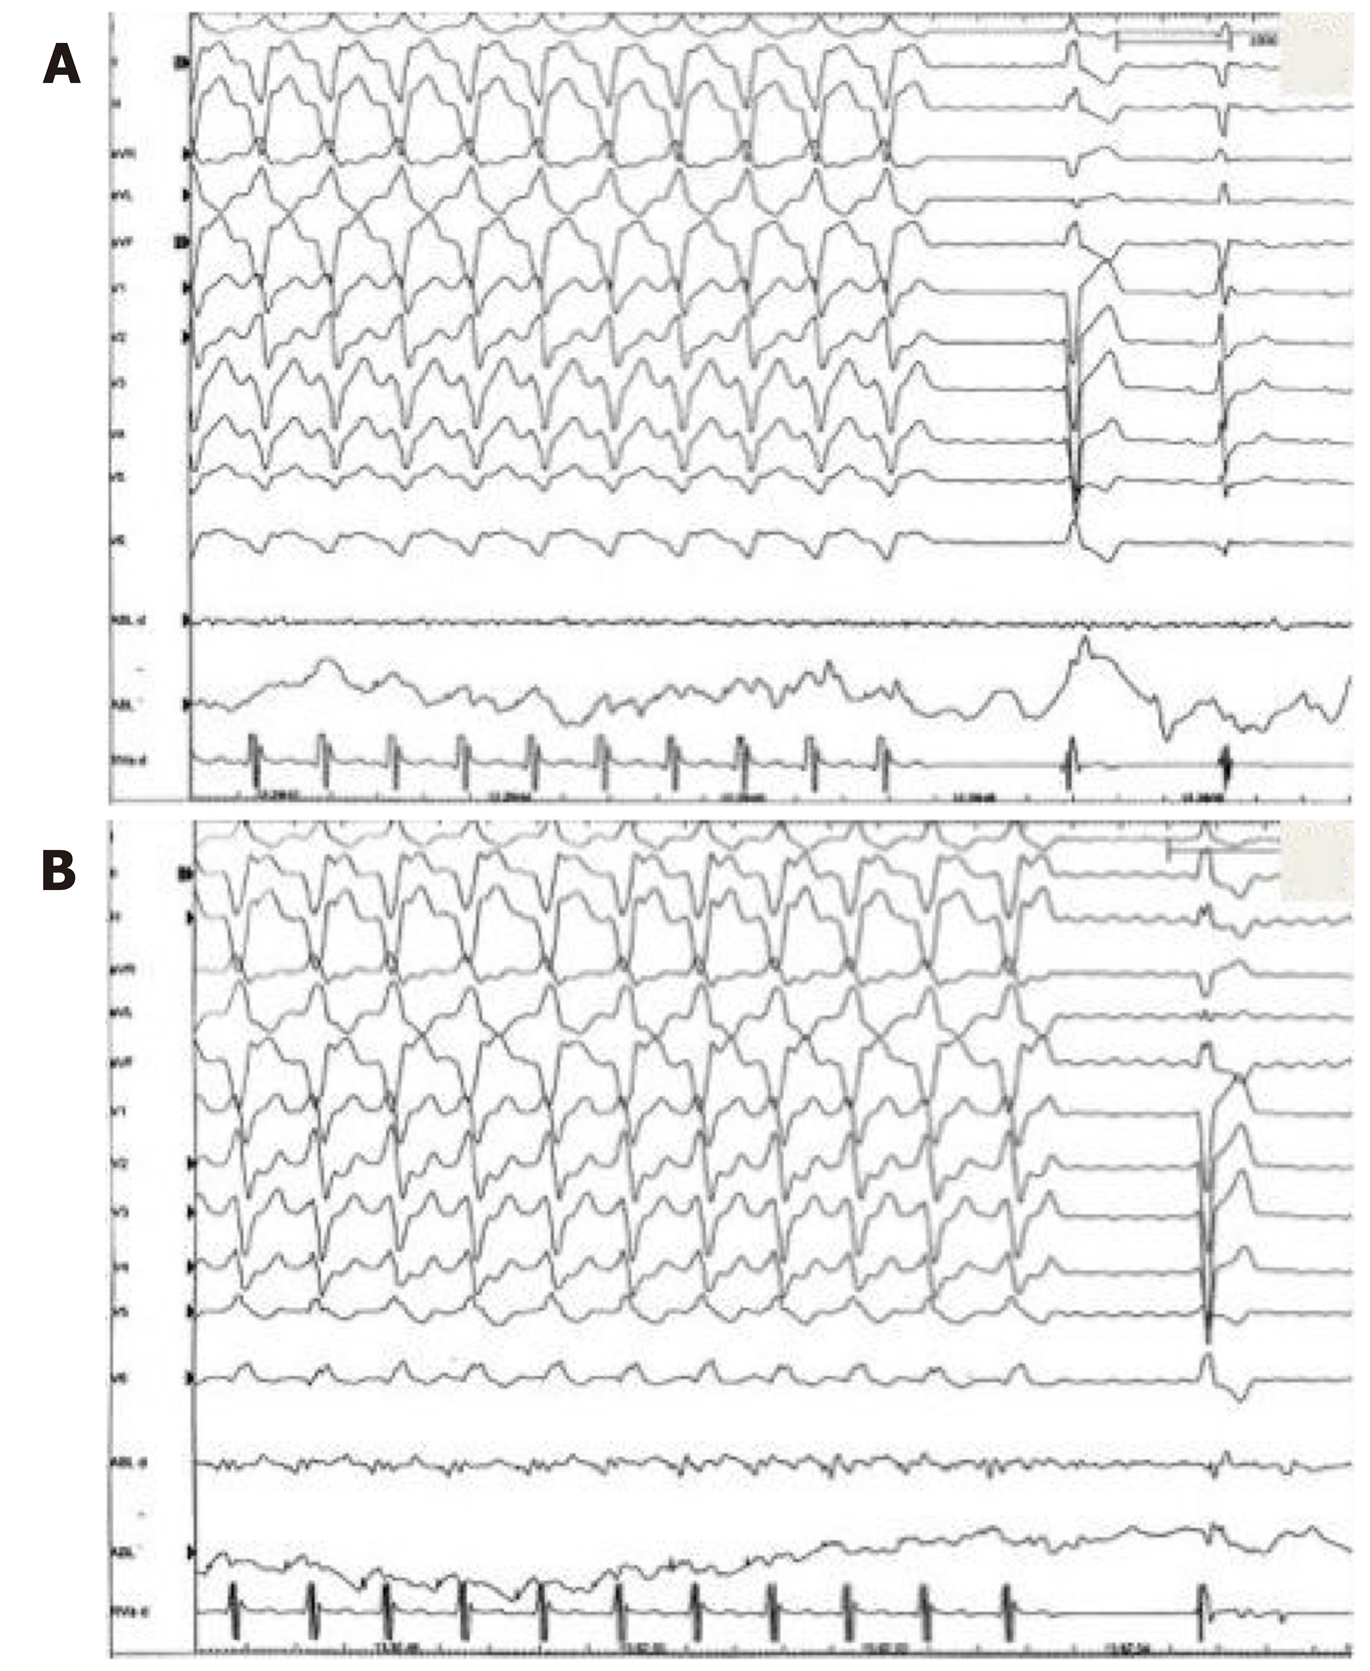
Figure 14 Patient 4: Two slightly different morphologies of VT were induced by ventricular programmed stimulation and radiofrequency was delivered with VT termination.
A: First morphology of VT termination during radiofrequency delivery in the infero-lateral region; B: Second morphology of VT termination during radiofrequency delivery in the more inferior region. VT: Ventricular tachycardia.
Figure 15 Patient 4: Epicardial substrate map.
Red dots are tags of phrenic nerve capture areas. Green dot on the tip of the ablation catheter represents the tag of VT termination. A: First morphology of VT termination during radiofrequency delivery in the infero-lateral region; B: Second morphology of VT termination during radiofrequency delivery in the more inferior region. VT: Ventricular tachycardia.
- Citation: Conti S, Bonomo V, Taormina A, Giordano U, Sgarito G. Phrenic nerve displacement by intrapericardial balloon inflation during epicardial ablation of ventricular tachycardia: Four case reports. World J Cardiol 2020; 12(1): 55-66
- URL: https://www.wjgnet.com/1949-8462/full/v12/i1/55.htm
- DOI: https://dx.doi.org/10.4330/wjc.v12.i1.55


