©2013 Baishideng Publishing Group Co.
World J Biol Chem. Aug 26, 2013; 4(3): 35-63
Published online Aug 26, 2013. doi: 10.4331/wjbc.v4.i3.35
Published online Aug 26, 2013. doi: 10.4331/wjbc.v4.i3.35
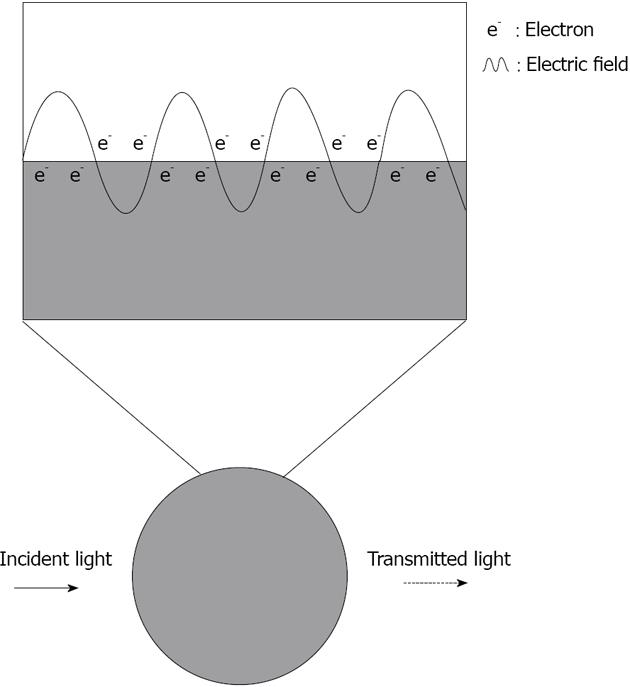
Figure 1 Scheme representing the plasmonic effect induced by white light on the absorbance of a silver nanoparticle.
The plasmon is represented above by the oscillation of an electron cloud along the surface of the nanoparticle. The silver nanoparticle absorbs light at 390 nm giving a dotted line.
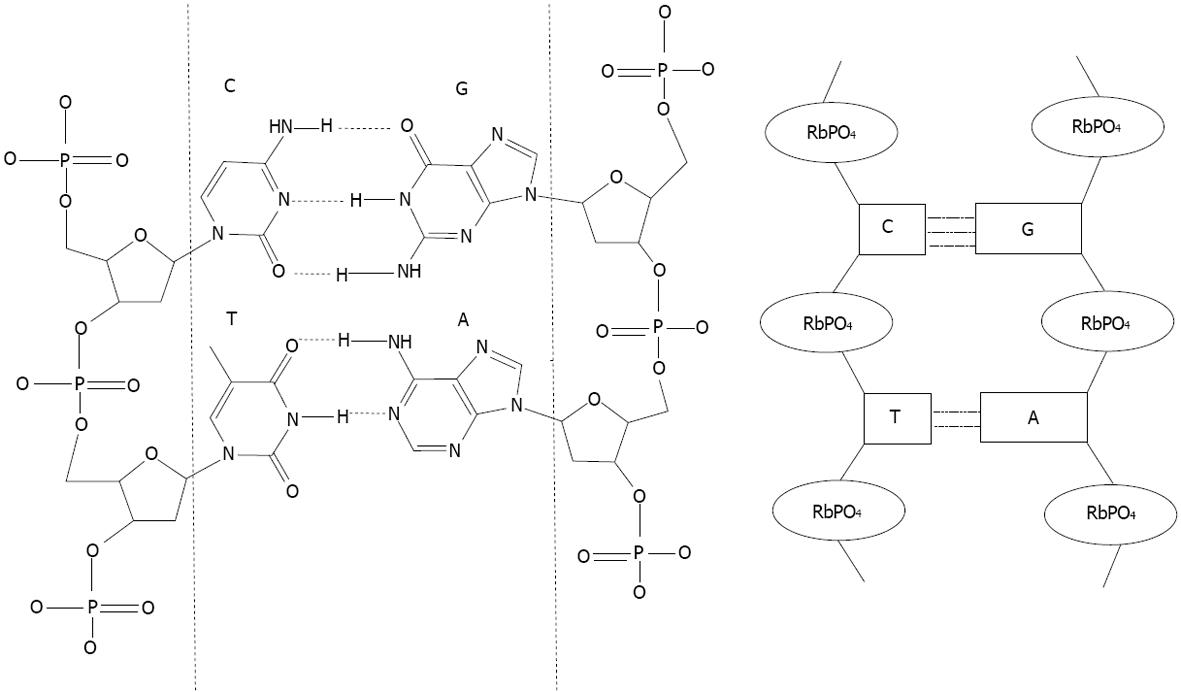
Figure 2 Matching DNA base.
Nucleotides structures are represented between the dashed lines. A (adenine) match with T (thymine), C (cytosine) match with G (guanine). Ribose phosphate structures link the nucleotides. On the left, a scheme representing the double stranded DNA based on the sequence nucleotide recognition. RbPO4 is ribophosphate.
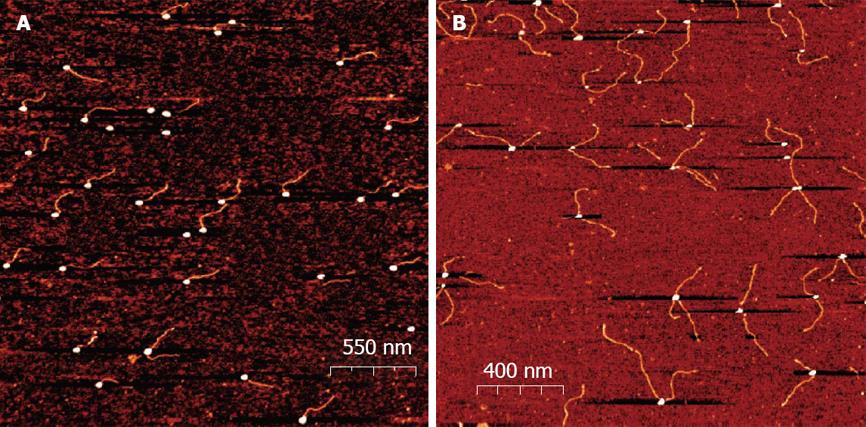
Figure 3 Atomic Force Microscopy images of oligonucleotide Oligonucleotide Gold Nanoparticles conjugates.
The conjugates were deposited on a mica surface in 2 mmol/L MgCl2 and scanned in a semi contact mode as described. From Borovok et al[46], reproduced with permission from American Chemical Society Publications.
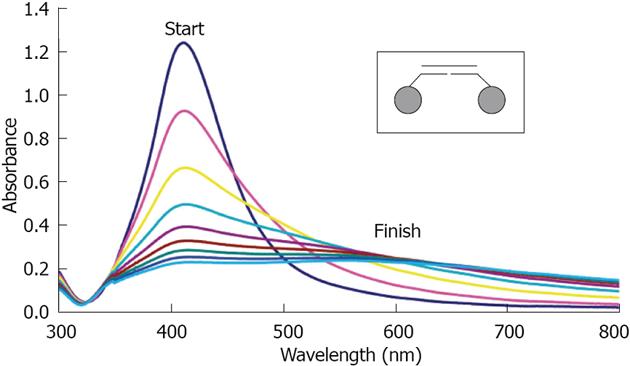
Figure 4 UV-vis spectra taken every 5 min of Oligonucleotide Silver Nanoparticles conjugates (25 pmol/L) hybridizing to a fully complementary target oligonucleotide (2.
5 nmol/L). Full spectrum scans were taken every 10 min for 80 min. The inset shows that the conjugates are hybridizing in the “tail-to-tail” juxtaposition. From Thompson et al[39], reproduced with permission from American Chemical Society Publications
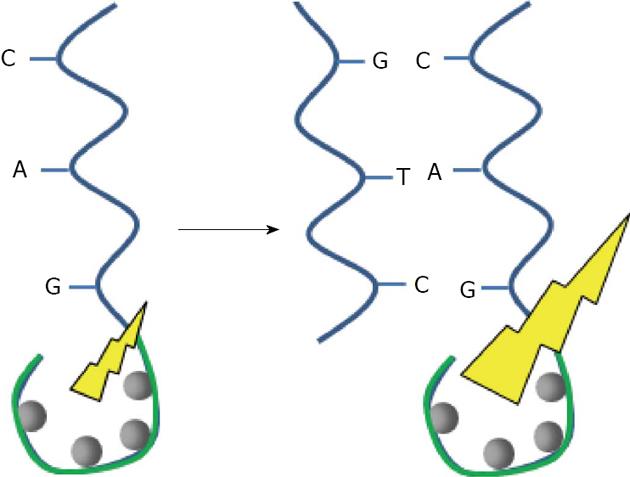
Figure 5 Schematic representation of the DNA sequence detection by fluorescence enhancement of silver nanocluster.
A: Adenine; T: Thymine; C: Cytosine; G: Guanine.
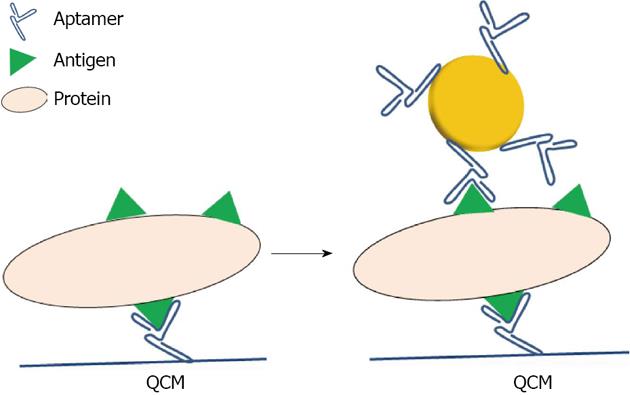
Figure 6 Schematic representation of the detection of proteins on a Quartz Crystal Microbalance using aptamer capped gold nanoparticles.
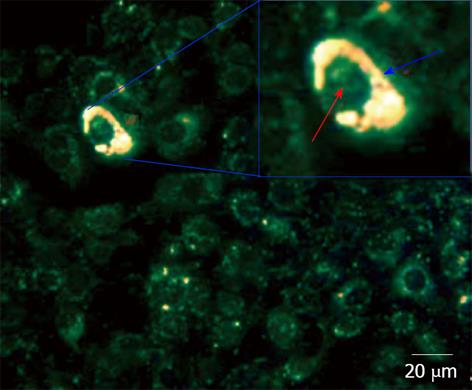
Figure 7 Dark Field Microscopy images of mixtures of cancer MDA-MB-231 and normal 184B5F5/M10 cells at 1:100 ratio, after incubation for 3 h in a medium containing aptamer gold nanoparticles.
Gold nanoparticles showing a high reflection are colored in yellow. The lower reflection corresponding to the cells are colored in green. In the inset, a magnification of a cell containing nanoparticles. The distribution of nanoparticles is highlighted by blue arrow corresponding to cytoplasm. Red arrow corresponds to the cell nucleus[57].
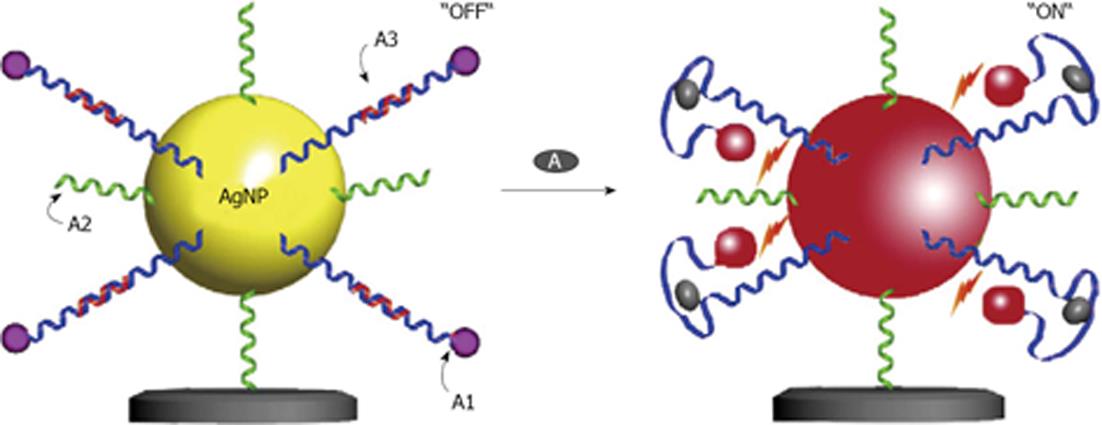
Figure 8 Schematic diagrams of the aptamer-based silver nanoparticles nanosensor showing the “OFF” (a) and “ON” (b) state based on the spacing distance between the Cyanine 3 and the silver nanoparticle surface in the detection of adenosine.
From Wang et al[59], reproduced with permission from Elsevier.
Figure 9 Nanoparticle-peptide complexes incubated with HepG2 cells for 2 h: displaying 4 different sequences in A, B, C and D.
From Tkachenko et al[74], reproduced with permission from American Chemical Society Publications.
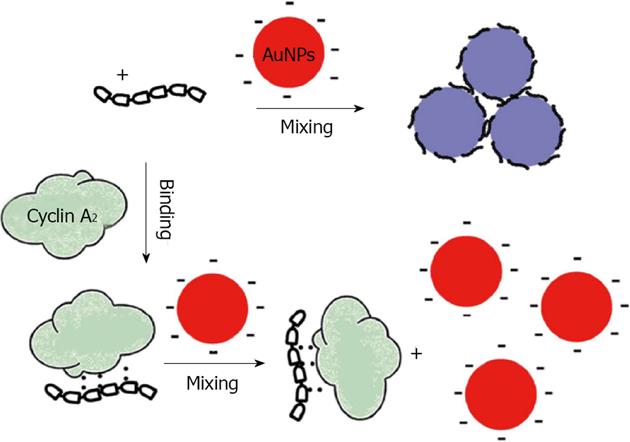
Figure 10 Schematic illustration of colorimetric detection of cyclin A2 based on noncross linking aggregation of unmodified Gold nanoparticles induced by preferential adsorption of unbound P1.
From Wang et al[79], reproduced with permission from Elsevier.
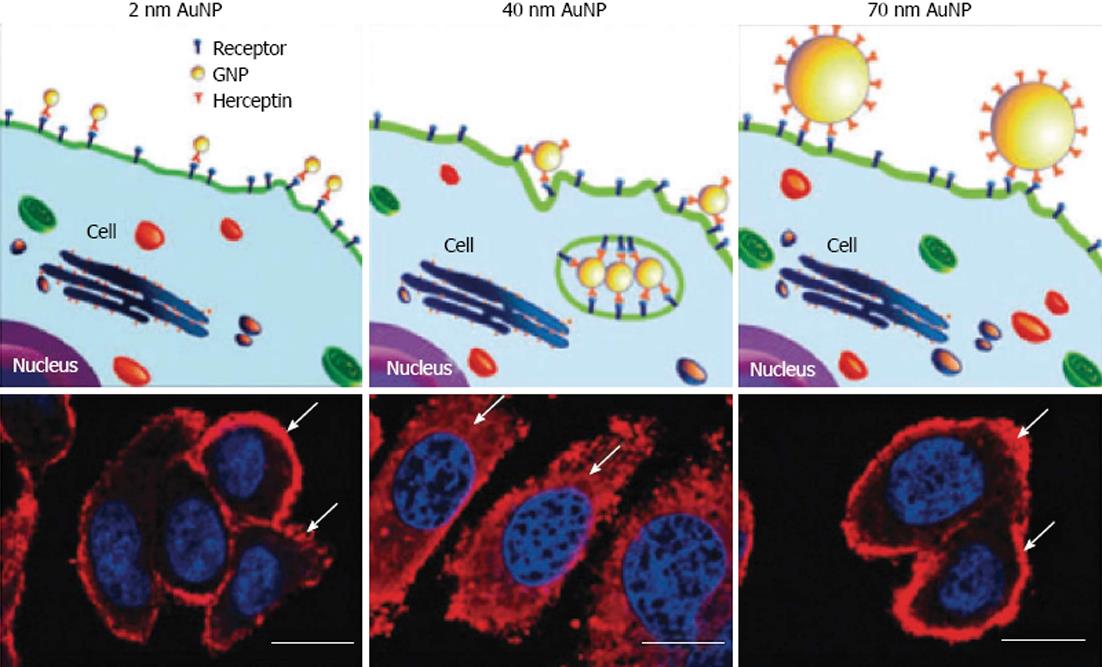
Figure 11 Illustration demonstrating binding of gold nanoparticles (G2, G40, G70 for 2, 40, 70 nm diameter) functionalized with Herceptin antibodies, which recognize receptors on the cell surface.
Arrows indicate ErbB2 receptors, and the nucleus is counterstained in blue with 4,6-Diamidino-2-phenylindole, scale bar = 10 μm. From Jiang et al[94], reproduced with permission from Nature Publishing Group. AuNP: gold nanoparticles.
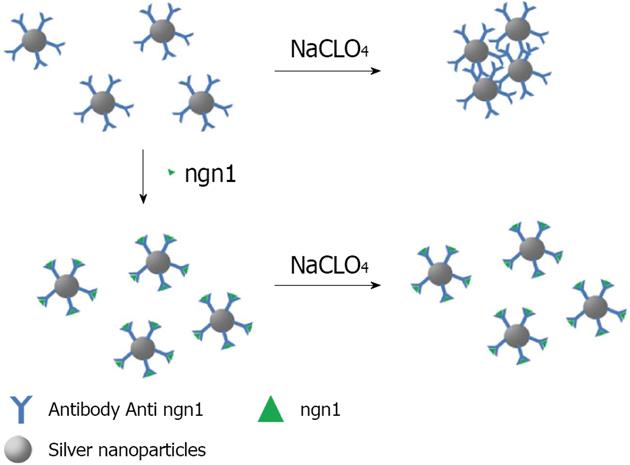
Figure 12 Schematic illustration of ngn1 detection using the anti-ngn1 antibody conjugated silver nanoparticle mediated by NaClO4 salt.
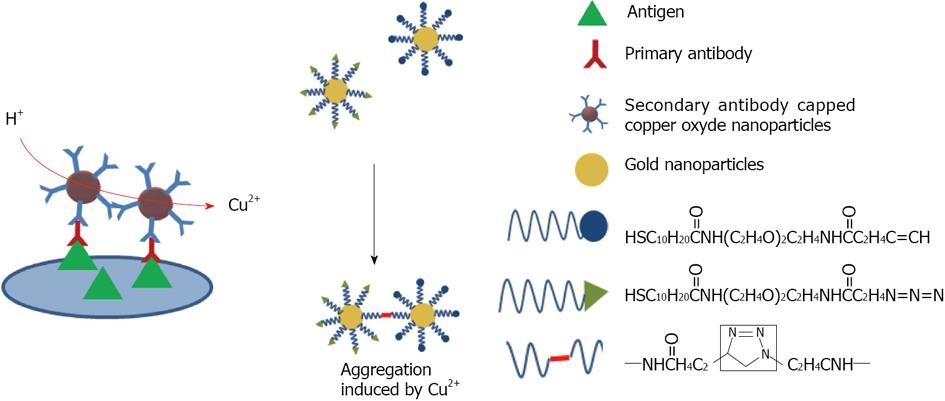
Figure 13 Schematic representation of immunoassay based on CuO-labeled antibody.
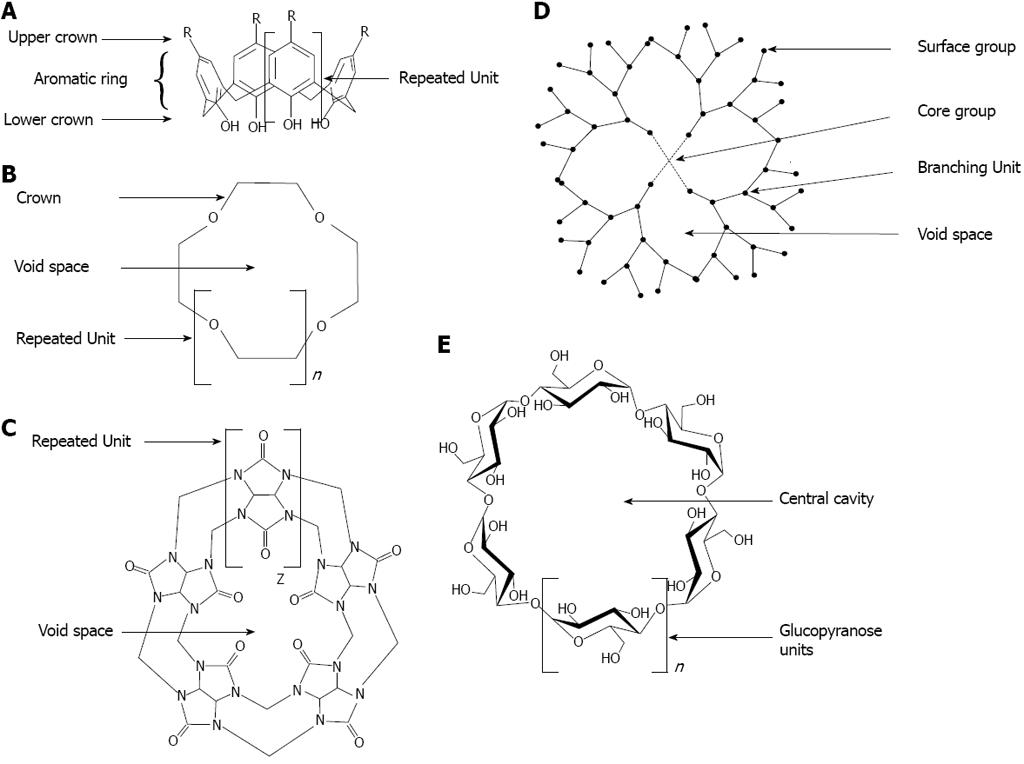
Figure 14 General structure of molecules from supramolecular family.
A: Calixarene; B: Crown ether; C: Cucurbituril; D: Dendrimer; E: cyclodextrin.
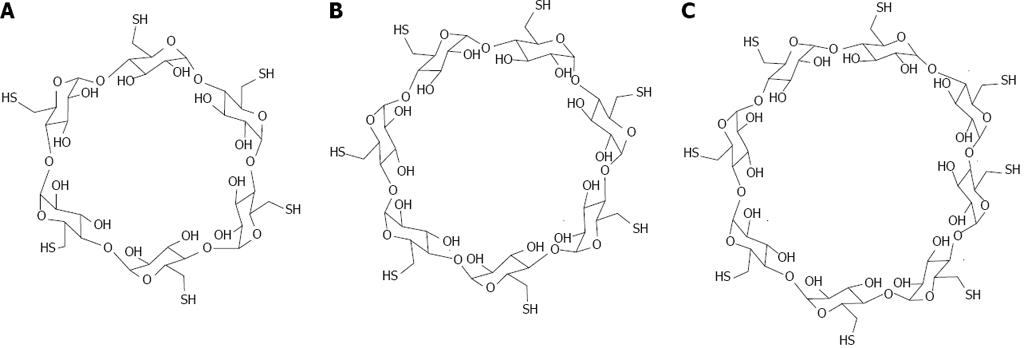
Figure 15 Structure of thiolated cyclodextrins.
A: Per-6-thio-α-cyclodextrin; B: Per-6-thio-β-cyclodextrin; C: Per-6-thio-γ-cyclodextrin.
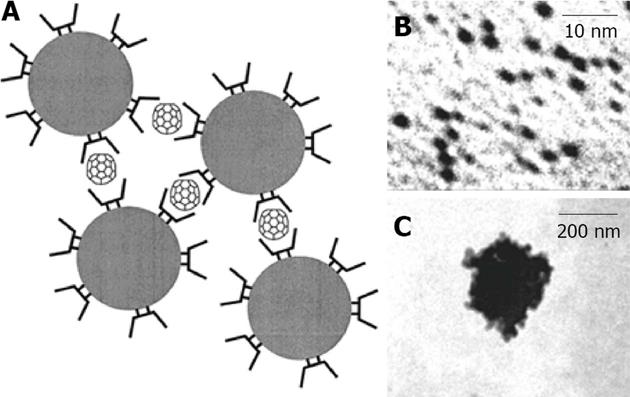
Figure 16 In A is represented a scheme of fullerene-induced network with cyclodextrin capped gold nanoparticles in aqueous solution, in B is shown Transmission Electronic Microscope image of dispersed cyclodextrin capped gold nanoparticles and in C is shown a Transmission Electronic Microscope image of fullerene-induced aggregate.
From Liu et al[117], reproduced with permission from American Chemical Society Publications.
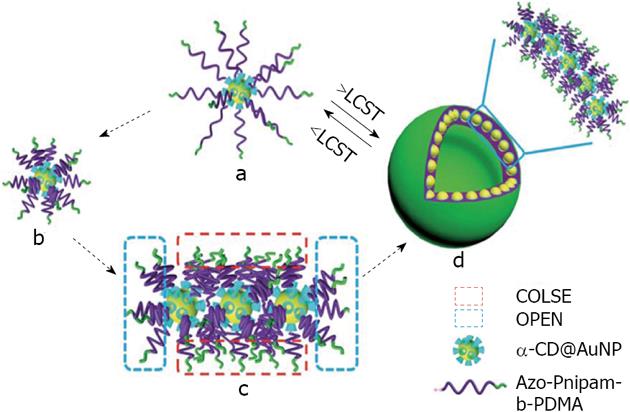
Figure 17 Schematic representation of a possible mechanism of Hybrid Inclusion Complex-vesicle formation.
From Wei et al[120], reproduced with permission from Royal Society of Chemistry. CD: Cyclodextrin; PDMA: Poly dimethyl acrylamide; AuNP: Gold nanoparticle; LCST: Lower critical solution temperature.
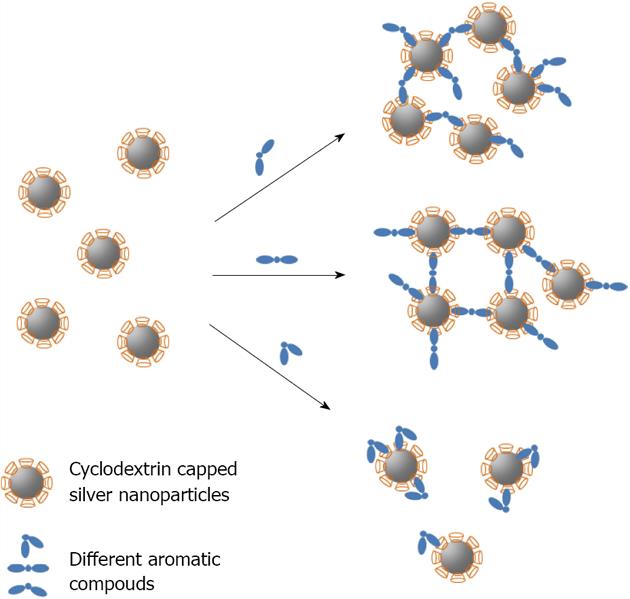
Figure 18 Schematic of host_guest recognition for Cyclodextrin capped silver nanoparticles with different aromatic compounds.
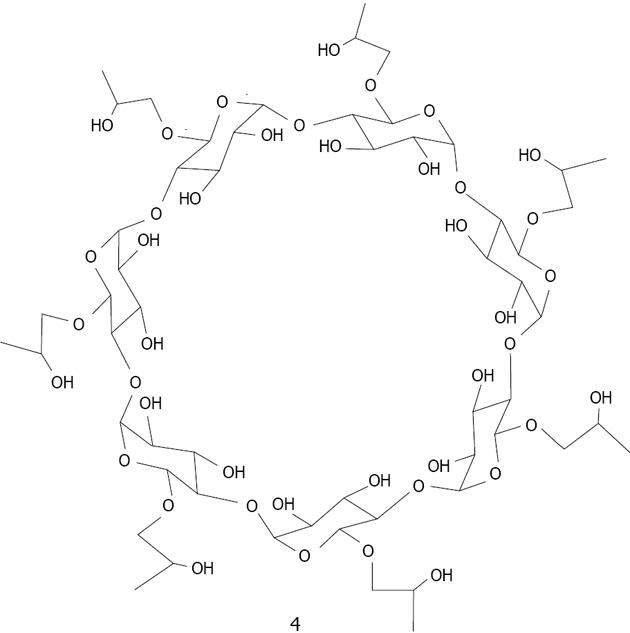
Figure 19 Structure of β-cyclodextrin derivative 4.
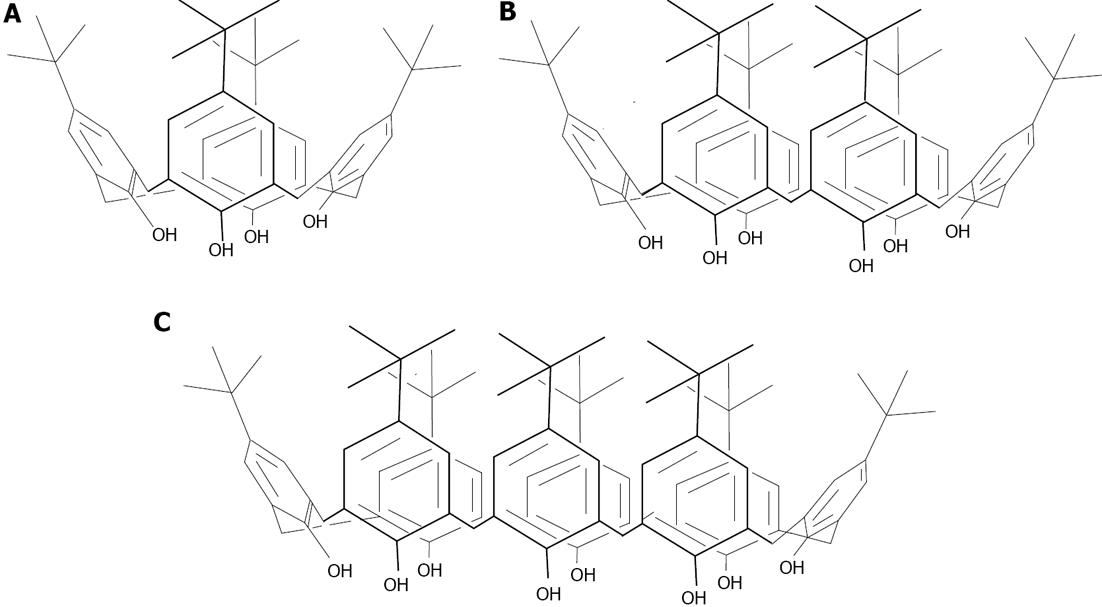
Figure 20 Structures of the t-Bu-calix[n]arenes, n = 4 (A), 6 (B) and 8 (C).
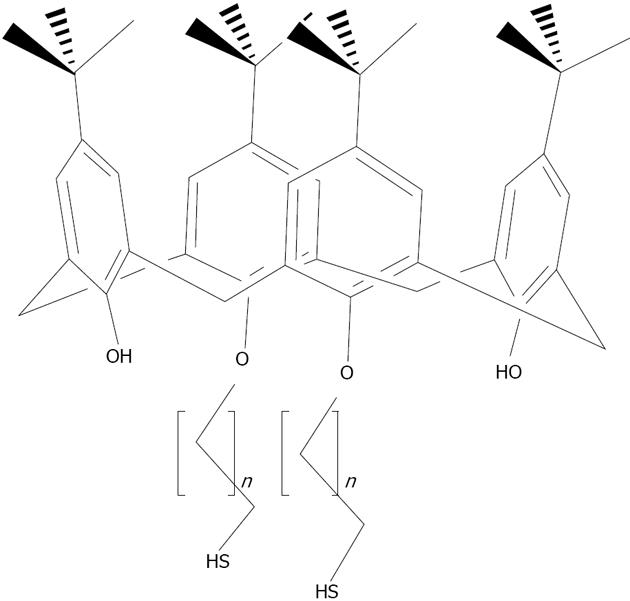
Figure 21 Structures of the thiolated-calix[n]arene derivatives.
5 corresponds to the present structure with n =10; 6 corresponds to the present structure with n = 5[136].
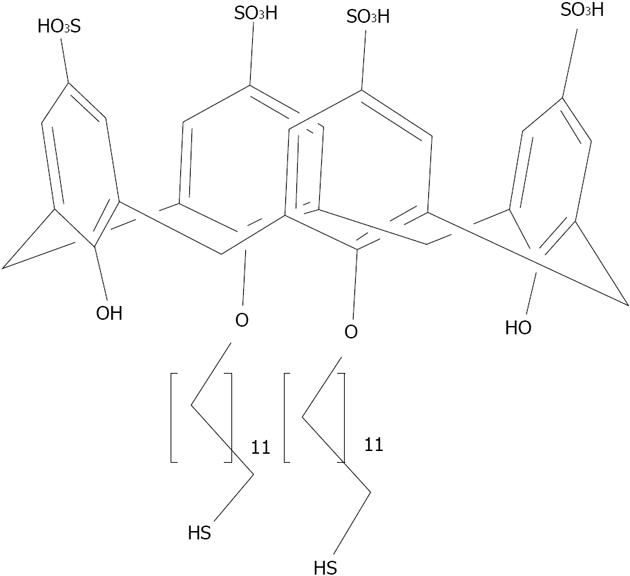
Figure 22 Structures of the para-sulphonato-calix[4]arene di-thiol 7.
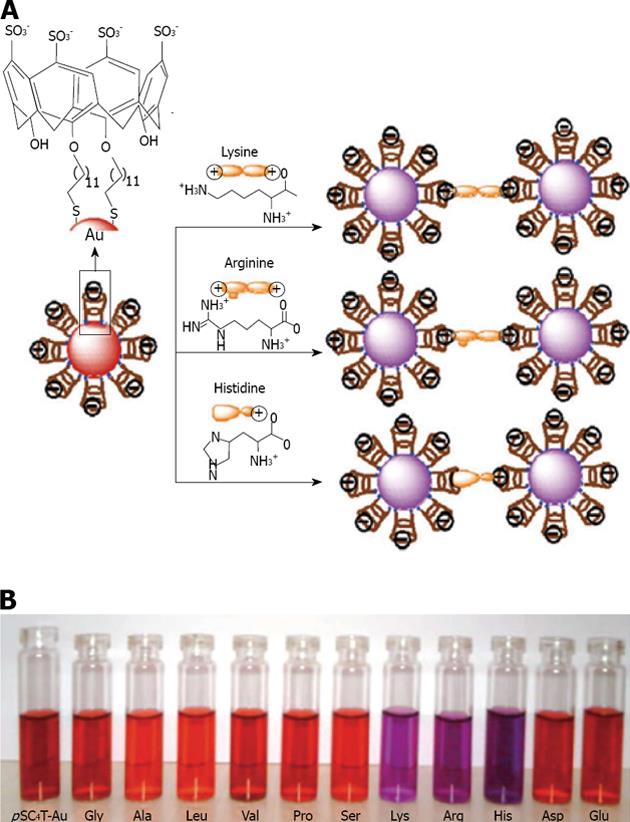
Figure 23 A is given a schematic representation of the amino acid induced aggregation of calix-capped gold nanoparticles; and in B are given the photographic images of calix-capped gold nanoparticles solutions containing different amino acids.
From Patel et al[137], reproduced with permission from Royal Society of Chemistry.
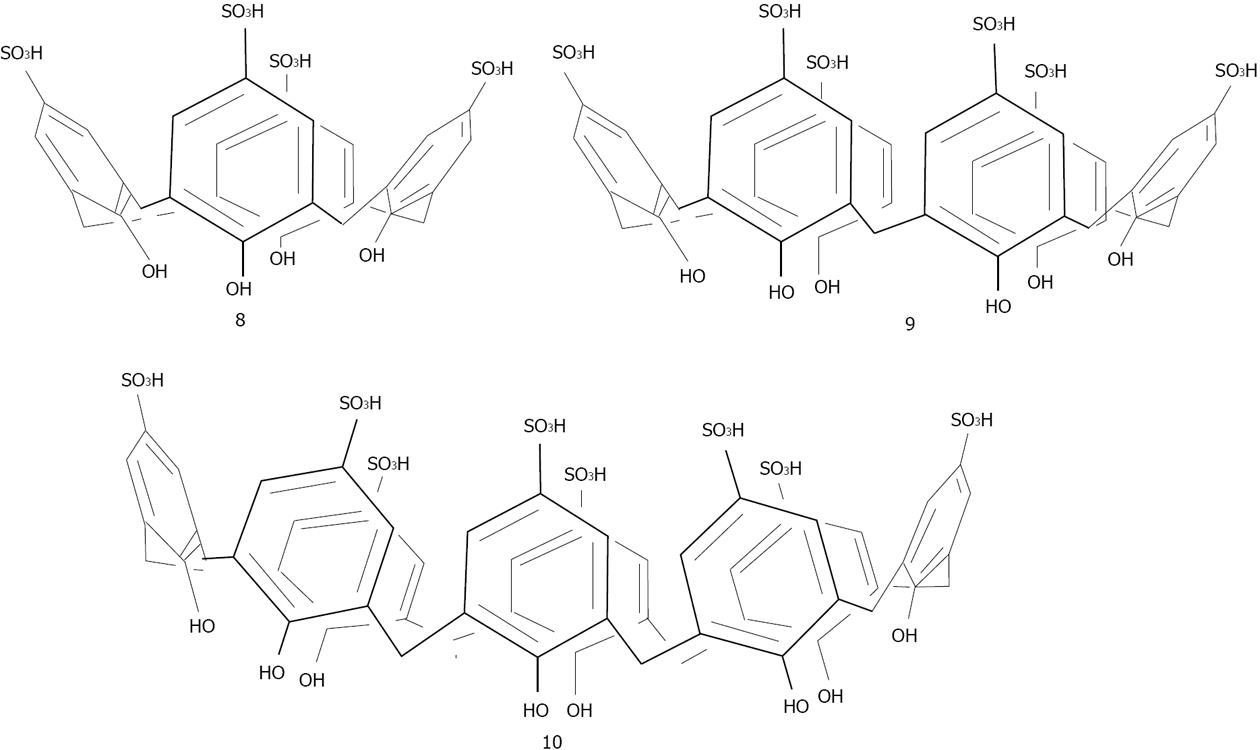
Figure 24 Structures of the para-suphonato-calix[4, 6 and 8]arenes.
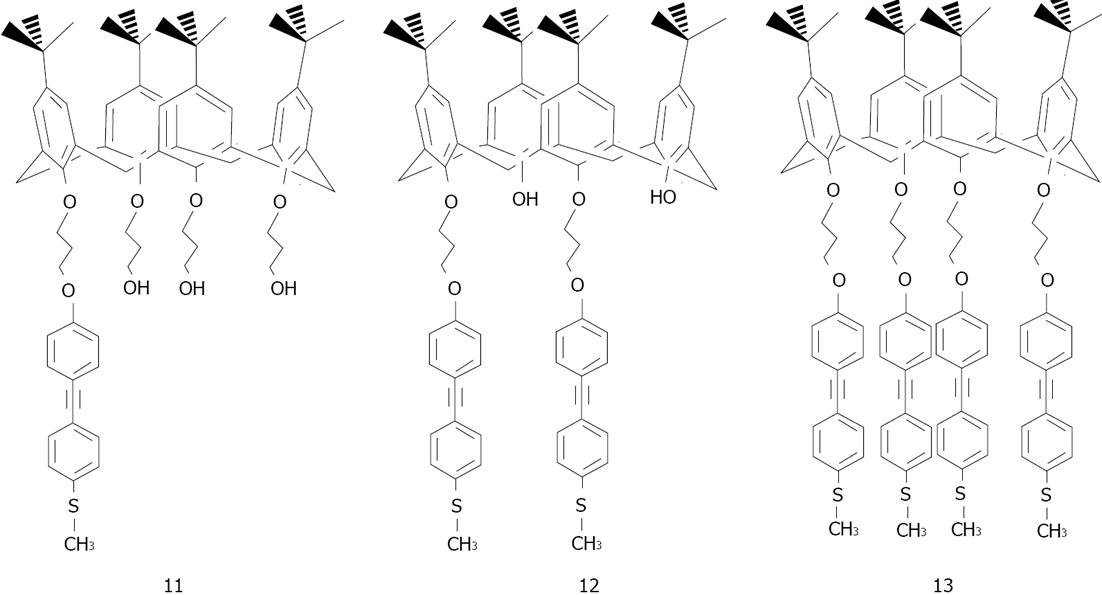
Figure 25 Structures of the methylthio-para-tert-butyl-calixarene derivatives.
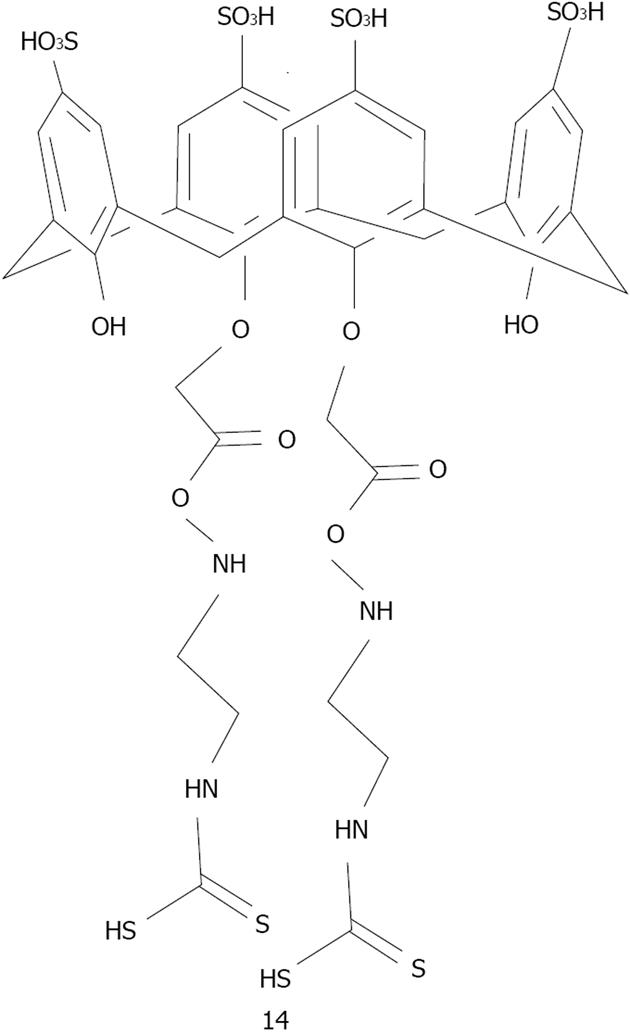
Figure 26 Structure of 25,27-bis(ethyleneaminecarbonylmethoxy)-26,28-dihydroxy-para-sulphonatocalix[4]arene modified dithiocarbamate.
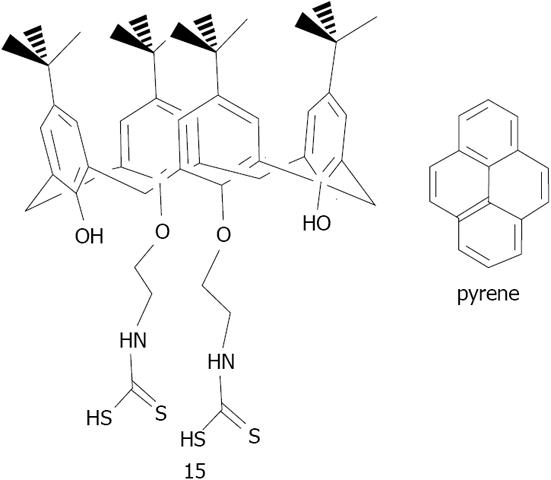
Figure 27 Structures of 25,27-diethyl-dithiocarbamic acid 26,28-dihydroxy para-tert-butylcalix[4]arene 15 and pyrene[141].
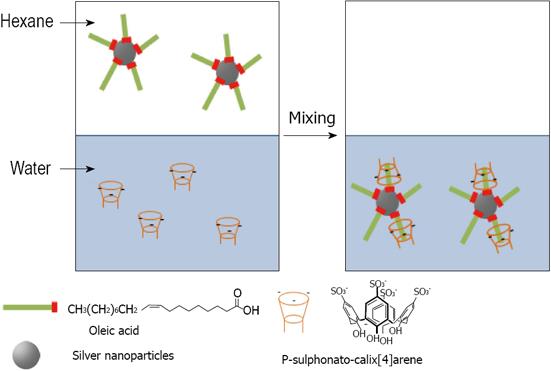
Figure 28 Phase transfer of Oleic acid stabilized silver nanoparticles from hexane to para-sulphonato-calix[4]arene aqueous solution.
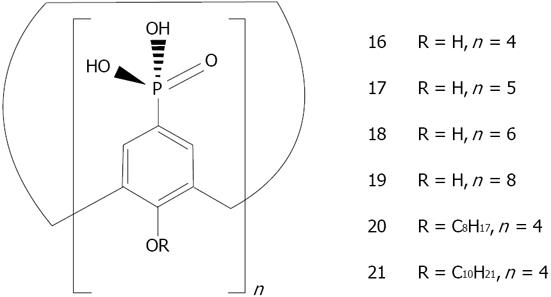
Figure 29 General structures of para-phosphonato-calix[n]arene derivatives.
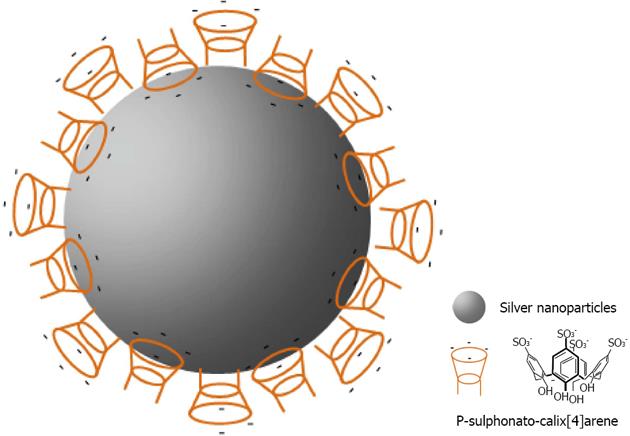
Figure 30 Schematic representation of the organization of para-sulphonato-calix[4]arene, 8 on silver nanoparticles.
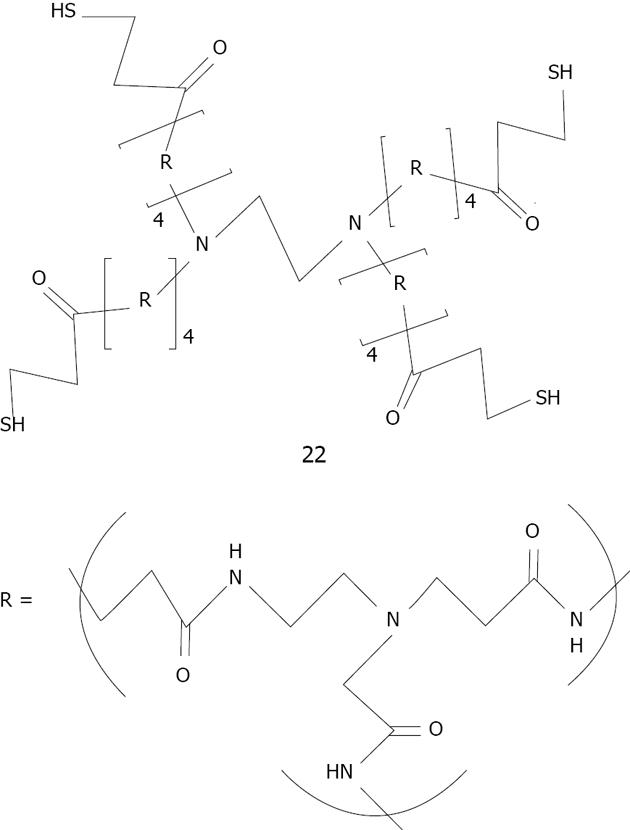
Figure 31 Structure of generation 4 thiolated dendrimer studied by Crooks[155].
The repeating unit R corresponds to poly(amido-amine).
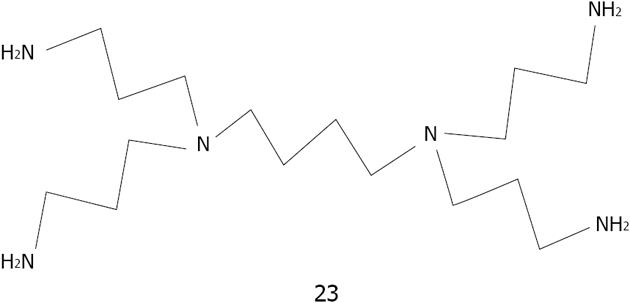
Figure 32 Structure of polpypropylneiminehexadecaneamine (sic) dendrimer (PPHA generation 1st).
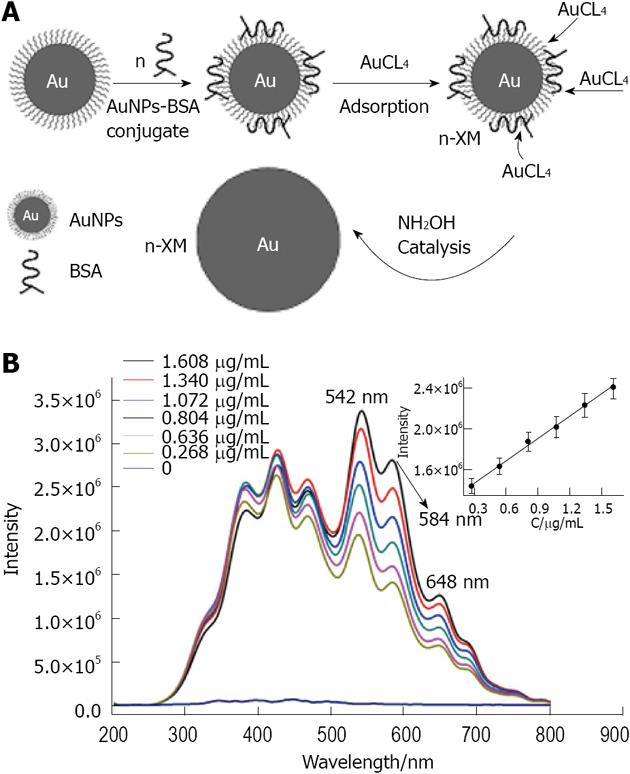
Figure 33 In A is given a schematic representation of the resonance light scattering amplification assay of biomolecules based on the biomineralization of gold nanoparticles bioconjugates; in B is given the resonance light scattering spectrum of the biomineralization product of concentration gradient of gold nanoparticles bioconjugates.
From Liu et al[157], reproduced with permission from Elsevier. BSA: Bovine serum albumin; AuNP: gold nanoparticle.
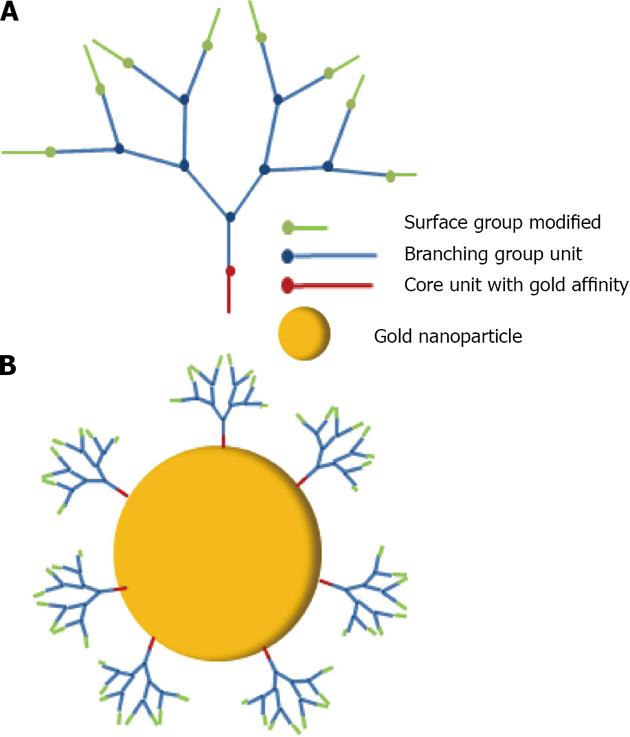
Figure 34 Schematic representation of dendron generation 3 (A) and a dendron generation 3 capped gold nanoparticle (B).
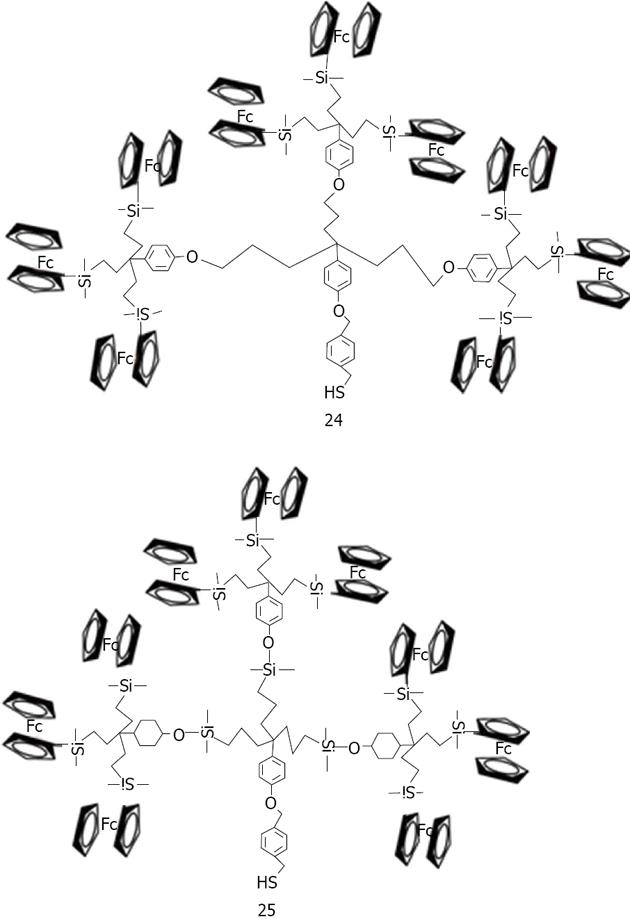
Figure 35 Structures of nonasilylferrocenyl dendron deriratives studied by Astruc et al.
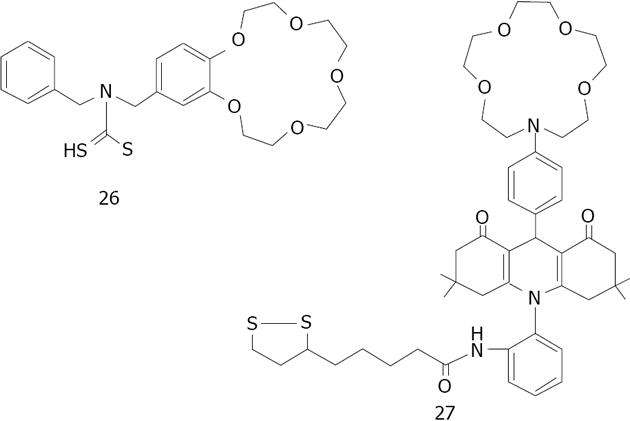
Figure 36 Structures of N-benzyl-4-aminobenzo-15-crown-5ether 26 for K+ and aza-15-crown-5-ether acridinedione 27.
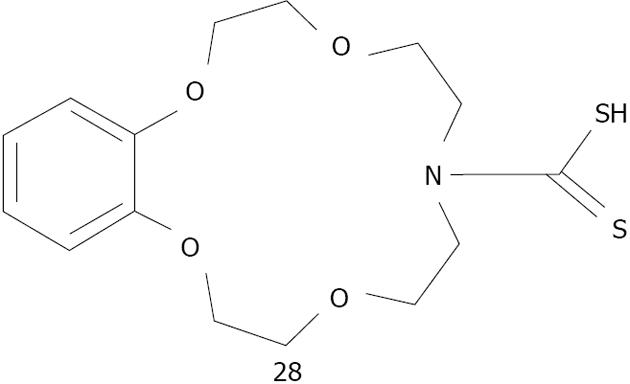
Figure 37 Structures dithiocarbamate modified aza-15-crown-5-ether 28 studied by Li et al.
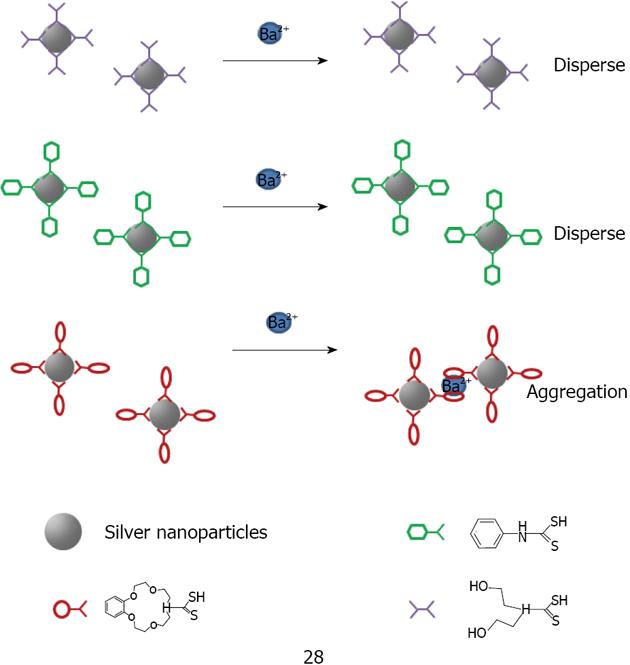
Figure 38 Schematic illustration of the aggregation of crown ether capped silver nanoparticles in the presence of metal ions Ba2+.
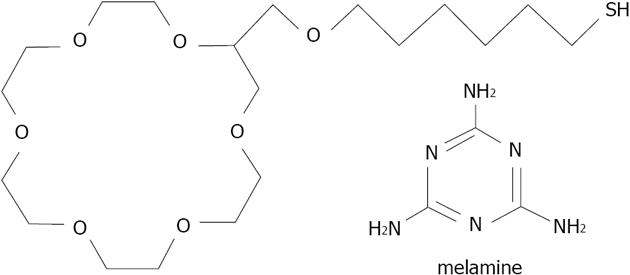
Figure 39 Structures of thiolated crown ether 29 and melamine studied by Kuang et al.
- Citation: Tauran Y, Brioude A, Coleman AW, Rhimi M, Kim B. Molecular recognition by gold, silver and copper nanoparticles. World J Biol Chem 2013; 4(3): 35-63
- URL: https://www.wjgnet.com/1949-8454/full/v4/i3/35.htm
- DOI: https://dx.doi.org/10.4331/wjbc.v4.i3.35


