


Published online Feb 27, 2026. doi: 10.4240/wjgs.v18.i2.114951
Revised: December 2, 2025
Accepted: January 8, 2026
Published online: February 27, 2026
Processing time: 147 Days and 3.3 Hours
Accurate prediction of postoperative survival is crucial for the personalized management of gastric cancer. However, the development of robust predictive models is often constrained by incomplete clinical data, while their clinical utility is limited by poor interpretability and the absence of practical applications.
To develop an interpretable machine learning model for predicting 3-year sur
A retrospective analysis was conducted on a group of 304 patients with gastric adenocarcinoma. A hybrid imputation method (HDI-MF-Gower) was developed and compared against conventional techniques. Key prognostic factors were identified by integrating least absolute shrinkage and selection operator regre
The proposed HDI-MF-Gower method demonstrated superior imputation accu
A robust and interpretable predictive model integrating advanced data imputation was successfully developed. The deployed tool facilitates individualized prognostic assessment and shows potential for enhancing personalized treatment planning in gastric cancer.
Core Tip: This study developed a novel hybrid imputation method (HDI-MF-Gower) to handle missing clinical data. We then built and validated a robust machine learning model (extra trees classifier) for predicting postoperative 3-year survival in gastric cancer patients. The model demonstrated high performance (area under the curve of 0.853), and its clinical application is facilitated by interpretable SHapley Additive exPlanations analysis and a user-friendly online prediction tool, aiding personalized treatment planning.
- Citation: Lü YN, Liu D, Tao S, Wu J, Yu SJ, Yuan HL. Development of a machine learning-based model for predicting postoperative survival in gastric cancer. World J Gastrointest Surg 2026; 18(2): 114951
- URL: https://www.wjgnet.com/1948-9366/full/v18/i2/114951.htm
- DOI: https://dx.doi.org/10.4240/wjgs.v18.i2.114951
Gastric cancer represents a major global health challenge and remains a leading cause of cancer-related mortality worldwide[1,2]. For patients undergoing curative-intent radical gastrectomy, postoperative survival outcomes often exhibit significant heterogeneity[3]. Accurate prediction of individual survival is therefore crucial for tailoring personalized adjuvant therapy and follow-up strategies[4,5]. The American Joint Committee on Cancer tumor-node-metastasis (TNM) staging system serves as the cornerstone of current prognostic assessment. However, it primarily relies on the anatomical extent of the tumor and fails to adequately incorporate other critical clinical, pathological, and treatment-related variables. This limitation restricts its accuracy for individualized risk stratification[6-8]. Machine learning (ML) has emerged as a powerful tool for prognostic modeling due to its capacity to identify complex, nonlinear patterns within high-dimensional data[9,10]. Previous studies have applied various ML algorithms to predict survival in gastric cancer patients, demonstrating considerable promise[11,12]. Despite this potential, the clinical translation and practical application of these models face several key challenges. First, the handling of missing data in retrospective clinical groups presents a fundamental challenge. Traditional imputation methods are often simplistic, while advanced techniques like K-nearest neighbors (KNN) and multiple imputation by chained equations (MICE) can be limited by the curse of dimensionality or reliance on linear assumptions, thereby failing to capture complex nonlinear relationships in clinical data. Although missForest can handle mixed data types and nonlinearity, improper handling of its initial imputation may distort the underlying data distribution, compromising the efficiency and quality of subsequent iterative optimization[13-15]. Second, constructing robust and generalizable models depends on effective feature selection to identify a concise yet powerful set of predictors from numerous candidate variables. The absence of this step increases the risk of model overfitting and diminishes generalizability. Finally, the “black-box” nature of many high-performance ensemble models, coupled with a lack of interpretability and practical tools, hinders their acceptance by clinicians and integration into routine workflows. This ultimately prevents these models from providing effective, real-time decision support[16-18]. Although previous research has explored ML applications in gastric cancer prognosis, studies that specifically develop interpretable models while systematically addressing data incompleteness and clinical deployment issues remain significantly lacking. This study aims to address this gap by introducing a predictive model that utilizes a novel ML workflow to identify postoperative gastric cancer patients at high risk of mortality. Our objectives are threefold: (1) To employ a novel imputation technique for improving data quality; (2) To identify key prognostic factors through rigorous feature selection; and (3) To build and interpret an ML model for accurate prediction of 3-year survival. The ultimate goal is to provide a new method for the early identification of high-risk patients. The deployment of this model as a clinical online tool is intended to foster the practical application of ML in oncology. Subsequent external validation will be conducted to enhance the model’s reliability and facilitate its clinical adoption, thereby offering more scientific and precise decision support for gastric cancer patient management.
This retrospective study consecutively enrolled 526 patients with primary gastric adenocarcinoma who underwent laparoscopic radical gastrectomy at the Zhongshan Hospital Affiliated to Dalian University from December 2011 to December 2018. Stringent inclusion and exclusion criteria were applied to ensure data homogeneity and analytical reliability. The inclusion criteria were: (1) A pathological diagnosis of primary gastric adenocarcinoma; and (2) Treatment with laparoscopic radical gastrectomy. Exclusion criteria were as follows: (1) Preoperative or intraoperative evidence of peritoneal dissemination or distant metastasis (M1 stage) - note that this specifically excludes patients with M1 disease, while those classified as stage IV due to locally advanced features (e.g., N3 status) without distant metastasis (M0) according to the American Joint Committee on Cancer 8th edition staging system were retained; (2) Diagnosis of gastric stump cancer; (3) Lack of a standardized preoperative contrast-enhanced abdominal computed tomography scan or a time interval exceeding one month between computed tomography and surgery; or (4) Incomplete clinical-pathological records, laboratory data, or follow-up information critical for the analysis. After this screening process, 304 eligible patients were included in the final analysis. The study protocol was approved by the Institutional Review Board of the Zhongshan Hospital Affiliated to Dalian University (Approval No. KY2023-002-2).
Missing data are often unavoidable in retrospective clinical studies; the pattern of missing data in our group is illustrated in Figure 1. To assess the mechanism of the missing data, Little’s missing completely at random (MCAR) test was performed. Among the 85 statistical tests conducted, only 2 (2.35%) showed significant differences, a proportion far below the commonly accepted threshold of 10%-20%. Given the low overall missing rate (0.69%) and the strict significance level after Bonferroni correction, the data were considered to meet the MCAR hypothesis. To address the missing values, a novel hybrid imputation algorithm, HDI-MF-Gower, was developed. This algorithm employs a two-stage strategy. First, the Gower distance metric is utilized to identify the most similar sample for each instance with a missing value, providing an intelligent initial imputation. Second, the missForest algorithm is applied for iterative optimization. This step uses the initial estimates as a starting point to capture complex nonlinear relationships among variables. This hybrid design integrates the advantages of both local similarity-based and global pattern-learning imputation methods, thereby en

The specific procedural steps are as follows: (1) Input: Training dataset D{x1,x2,…xn}, numerical feature set N, catego is computed as:

Where Var(Xk) represents the variance, MRk represents the missing rate of feature k; for categorical features k∈F, the weight  is:
is:

Where H(Xk) represents the information entropy. To prevent extreme weight values from dominating distance calculation, nonlinear compression and normalization are applied to the weights; (4) Using the adaptive Gower distance as the similarity metric, for each sample D in containing one or more missing values, identified the most similar complete sample in the dataset. The corresponding observed values from this matched sample were then used to impute the missing entries, which produced the initially imputed matrix  ; (5) Sort all variables in ascending order according to their missing value rate. Denote this ordered list of variable names as the vector K; (6) Evaluate whether the convergence criterion ε or the maximum iteration count P has been reached. If either condition is satisfied, terminate the procedure and output the latest imputed matrix
  . Otherwise, proceed to repeat the iterative operations defined in step 7 to step 9; (7) Store the imputed data matrix obtained from the previous iteration and denote it as
  ; (8) For the variables in vector K, the random forest algorithm was sequentially applied to impute missing values, and the matrix was updated using the imputed values to obtain a new matrix
  ; (9) Calculate the difference metric between
  matrices and
  , and return to step 6; and (10) The final matrix
  obtained after iteration termination.
The iteration termination condition ε in the algorithm is determined by the difference between the imputed matrix and the pre-imputation matrix. The algorithm terminates when the difference between them falls below a pre-defined thre
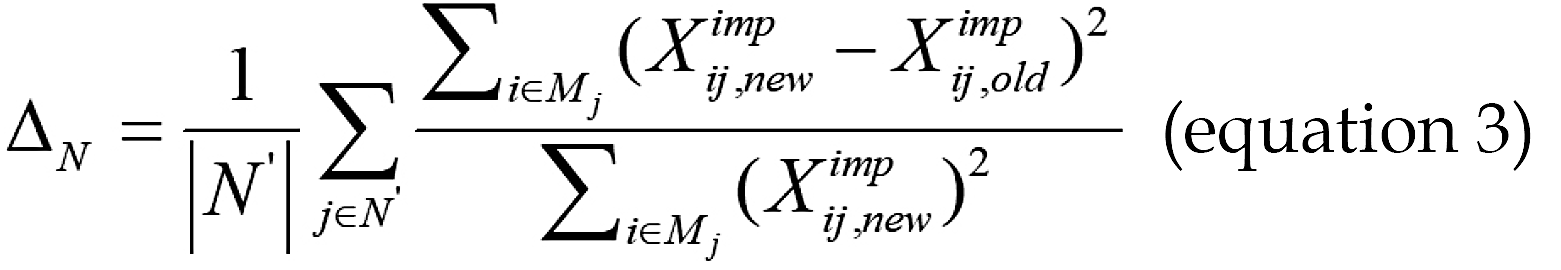
Where, N’ denotes the set of continuous variables with missing values, and Mj represents the set of missing-value positions for the j-th variable. For the set of categorical variables F, the difference ΔFis defined as:
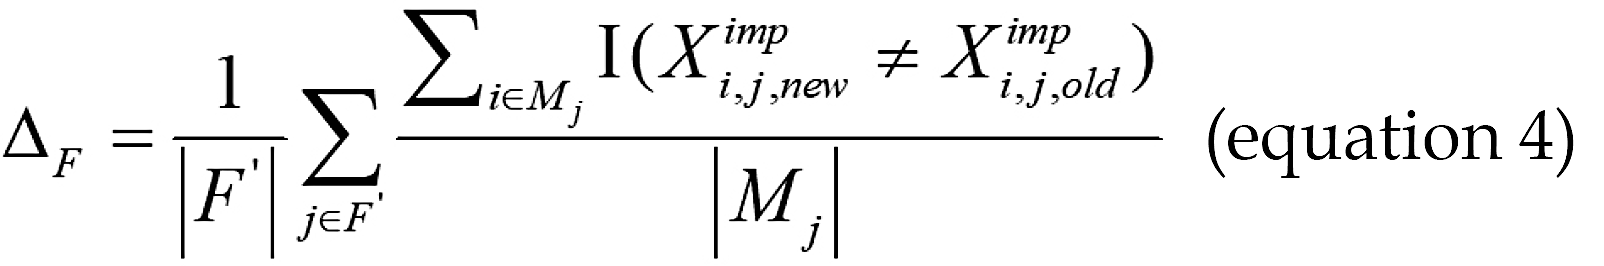
Where I(g) is the indicator function that takes the value 1 if the condition is satisfied and 0 otherwise. Supplementary Table 1 shows the pseudocode for the HDI-MF-Gower imputation method.
The dataset of 304 patients was imputed using the HDI-MF-Gower method and randomly split into training and validation sets at a 7:3 ratio. The training set was used for model development with hyperparameter tuning via 10-fold cross-validation, while the validation set was reserved for independently assessing the model’s generalization ability. To identify the most predictive features for three-year postoperative mortality and mitigate overfitting, a dual feature selection strategy was employed. Least absolute shrinkage and selection operator (LASSO) regression was applied to select key variables, while the Boruta algorithm - a random forest-based wrapper method - was used to identify all-relevant predictors[19-21]. The final feature set was defined as the intersection of the features retained by both methods, which helped enhance model accuracy, reduce overfitting, and eliminate irrelevant variables[22,23]. Using this optimal feature subset, ten ML algorithms were developed and compared: Logistic regression, random forest, extreme gradient boosting (XGBoost), light gradient boosting machine, support vector machine, multi-layer perceptron, extra trees, KNN, decision tree, and gradient boosting. The primary outcome was individual three-year mortality risk, area under the curve (AUC) and accuracy as the main performance metrics. Secondary metrics included specificity, recall (sensitivity), precision, and the F1-score. Model calibration was assessed using calibration curves and the Brier score, which quantifies the agreement between predicted probabilities and observed outcomes. Decision curve analysis was used to evaluate clinical net benefit across various probability thresholds. To improve interpretability, SHapley Additive exPlanations (SHAP) analysis was applied to illustrate the contribution of each feature to individual predictions. Finally, a user-friendly online prediction tool was developed to facilitate the clinical application of the optimal model.
Statistical analyses were performed using RStudio (version R4.4.1) and SPSS software (version 25.0). Continuous variables that followed a normal distribution were presented as mean ± SD, and inter-group comparisons were conducted using t-tests. For continuous variables that did not follow a normal distribution, values were expressed as median (interquartile range), and inter-group comparisons were performed using the Mann-Whitney U test. Categorical variables were presented as n (%), and inter-group comparisons were made using the χ2 test.
Following the screening process, 304 patients were included in the final analysis. The group comprised 211 males (69.41%) and 93 females (30.59%), with a mean age of 67 years. Based on the 3-year survival outcome, 165 patients (54.28%) were categorized into the survival group and 139 (45.72%) into the non-survival group. Significant intergroup differences (P < 0.05) were observed in the following parameters: Max tumor diameter, age, red blood cell count, hemoglobin, albumin, creatinine, carcinoembryonic antigen (CEA), intraoperative blood loss, sex, alcohol consumption (drinking), resection range, reconstruction method, complications, lymphovascular invasion, nerve infiltration, and TNM stage. The detailed baseline characteristics of the patients are summarized in Table 1.
| Variables | Survival group (n = 165) | Death group (n = 139) | Z/χ2 | P value |
| Sex1 | χ2 = 4.53 | 0.033 | ||
| Male | 106 (64.24) | 105 (75.54) | ||
| Female | 59 (35.76) | 34 (24.46) | ||
| Age (years)2 | 65.00 (58.00-71.00) | 69.00 (62.50-77.50) | Z = -3.76 | < 0.001 |
| Max tumor diameter (cm)2 | 4.00 (3.00-5.00) | 5.00 (4.00-8.00) | Z = -6.32 | < 0.001 |
| RBC (× 1012/L)2 | 4.48 (3.98-4.85) | 4.26 (3.65-4.66) | Z = -2.82 | 0.005 |
| Hemoglobin (g/L)2 | 136.00 (109.00-148.00) | 126.00 (98.00-141.50) | Z = -2.94 | 0.003 |
| Neutrophils (× 109/L)2 | 4.07 (3.01-5.56) | 4.50 (3.14-6.05) | Z = -1.04 | 0.298 |
| Monocytes (× 109/L)2 | 0.30 (0.21-0.43) | 0.34 (0.23-0.48) | Z = -1.71 | 0.087 |
| Lymphocytes (× 109/L)2 | 1.50 (1.20-1.90) | 1.50 (1.00-1.90) | Z = -0.80 | 0.422 |
| Platelets (× 109/L)2 | 220.00 (180.00-275.00) | 232.00 (194.50-285.00) | Z = -1.16 | 0.246 |
| Albumin (g/L)2 | 41.10 (36.30-43.90) | 38.60 (34.05-41.95) | Z = -3.40 | < 0.001 |
| LDH (U/L)2 | 302.00 (184.00-406.00) | 324.00 (191.00-421.50) | Z = -0.87 | 0.383 |
| ALT (U/L)2 | 19.00 (15.00-26.00) | 21.00 (14.50-28.00) | Z = -0.79 | 0.427 |
| AST (U/L)2 | 20.00 (17.00-26.00) | 21.00 (17.00-29.00) | Z = -1.28 | 0.200 |
| Creatinine (μmol/L)2 | 67.90 (59.00-78.50) | 73.10 (64.10-82.40) | Z = -2.56 | 0.011 |
| AFP (ng/mL)2 | 2.63 (1.72-3.50) | 2.30 (1.50-3.17) | Z = -1.59 | 0.112 |
| CEA (ng/mL)2 | 1.71 (1.03-2.95) | 2.65 (1.58-4.67) | Z = -4.34 | < 0.001 |
| CA199 (U/mL)2 | 11.06 (5.89-18.57) | 14.95 (7.55-22.47) | Z = -1.90 | 0.057 |
| Operative time (minutes)2 | 180.00 (160.00-230.00) | 200.00 (170.00-240.00) | Z = -1.58 | 0.115 |
| Intraoperative blood loss (mL)2 | 100.00 (100.00-140.00) | 146.18 (100.00-200.00) | Z = -5.79 | < 0.001 |
| Smoking1 | χ2 = 0.98 | 0.321 | ||
| No | 110 (66.67) | 100 (71.94) | ||
| Yes | 55 (33.33) | 39 (28.06) | ||
| Drinking1 | χ2 = 4.07 | 0.044 | ||
| No | 111 (67.27) | 108 (77.70) | ||
| Yes | 54 (32.73) | 31 (22.30) | ||
| HTN1 | χ2 = 0.49 | 0.483 | ||
| No | 120 (72.73) | 96 (69.06) | ||
| Yes | 45 (27.27) | 43 (30.94) | ||
| DM1 | χ2 = 0.05 | 0.816 | ||
| No | 137 (83.03) | 114 (82.01) | ||
| Yes | 28 (16.97) | 25 (17.99) | ||
| CHD1 | χ2 = 0.84 | 0.361 | ||
| No | 147 (89.09) | 119 (85.61) | ||
| Yes | 18 (10.91) | 20 (14.39) | ||
| Abdominal surgery history1 | χ2 = 0.18 | 0.673 | ||
| No | 144 (87.27) | 119 (85.61) | ||
| Yes | 21 (12.73) | 20 (14.39) | ||
| Resection range1 | χ2 = 6.92 | 0.009 | ||
| Whole stomach | 42 (25.45) | 55 (39.57) | ||
| Distal and proximal stomachs | 123 (74.55) | 84 (60.43) | ||
| Reconstruction method1 | χ2 = 15.33 | < 0.001 | ||
| Billroth I and Billroth II | 24 (14.55) | 12 (8.63) | ||
| Roux-en-Y | 100 (60.61) | 63 (45.32) | ||
| Double-tract | 41 (24.85) | 64 (46.04) | ||
| Complications1 | χ2 = 4.21 | 0.040 | ||
| No | 134 (81.21) | 99 (71.22) | ||
| Yes | 31 (18.79) | 40 (28.78) | ||
| Lymphovascular invasion1 | χ2 = 37.88 | < 0.001 | ||
| No | 126 (76.36) | 58 (41.73) | ||
| Yes | 39 (23.64) | 81 (58.27) | ||
| Nerve infiltration1 | χ2 = 14.05 | < 0.001 | ||
| No | 124 (75.15) | 76 (54.68) | ||
| Yes | 41 (24.85) | 63 (45.32) | ||
| Differentiation grade1 | χ2 = 5.80 | 0.055 | ||
| Highly | 13 (7.88) | 4 (2.88) | ||
| Moderate | 66 (40.00) | 47 (33.81) | ||
| Low and undifferentiated | 86 (52.12) | 88 (63.31) | ||
| Chemotherapy1 | χ2 = 0.44 | 0.506 | ||
| No | 100 (60.61) | 79 (56.83) | ||
| Yes | 65 (39.39) | 60 (43.17) | ||
| TNM stage1 | χ2 = 82.29 | < 0.001 | ||
| I stage | 66 (40.00) | 7 (5.04) | ||
| II stage | 31 (18.79) | 18 (12.95) | ||
| III stage | 48 (29.09) | 39 (28.06) | ||
| IV stage | 20 (12.12) | 75 (53.96) |
To evaluate the proposed HDI-MF-Gower imputation method, we conducted an experimental study assessing its per

Where Xtrue is a vector containing the original true values of all numerical data points that were artificially set to missing, and Ximp is a vector containing the corresponding imputed values generated by the algorithm. The symbol std(g) represents the standard deviation of the vector used for calculation.
For categorical variables, the proportion of falsely classified (PFC) entries was used to measure the imputation accu
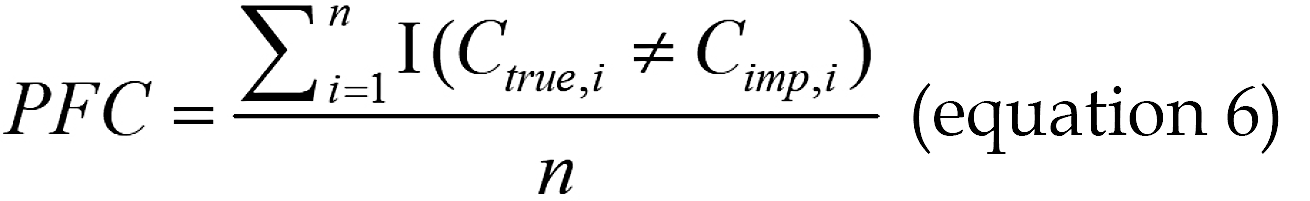
Where Ctrue,i is the original true category of the i-th categorical data point that was artificially set to missing, Cimp,i is the corresponding imputed category generated by the algorithm for Ctrue,i, and n represents the total number of imputed categorical data points.
As shown in Table 2, the proposed HDI-MF-Gower method demonstrated superior imputation accuracy across all missingness rates compared to four benchmark methods - mean/mode, KNN, MICE, and missForest - yielding lower NRMSE for numerical variables and lower PFC entries for categorical variables. To further evaluate the practical impact of imputation quality on downstream predictive tasks, a decision tree classifier was trained on datasets processed by each method, with its performance assessed by the average AUC via 5-fold cross-validation. The model trained on HDI-MF-Gower-imputed data achieved the highest predictive AUC among all methods. These results confirm that the HDI-MF-Gower method not only more accurately imputes missing values, but also better preserves intrinsic data relationships, thereby substantially mitigating the negative effect of missing data on subsequent ML model performance.
| Missing rate (%) | Imputation method | NRMSE | PFC | AUC |
| 5 | Mean/mode | 0.1290 | 0.3240 | 0.6125 |
| KNN | 0.1274 | 0.3264 | 0.6167 | |
| MICE | 0.1200 | 0.2994 | 0.6194 | |
| MissForest | 0.1160 | 0.2635 | 0.6222 | |
| HDI-MF-Gower | 0.1122 | 0.2471 | 0.6278 | |
| 10 | Mean/mode | 0.1339 | 0.3236 | 0.6097 |
| KNN | 0.1368 | 0.3261 | 0.6292 | |
| MICE | 0.1242 | 0.3072 | 0.6319 | |
| MissForest | 0.1221 | 0.2625 | 0.6514 | |
| HDI-MF-Gower | 0.1201 | 0.2557 | 0.6568 | |
| 15 | Mean/mode | 0.1342 | 0.3279 | 0.6208 |
| KNN | 0.1365 | 0.3211 | 0.6458 | |
| MICE | 0.1261 | 0.3063 | 0.6569 | |
| MissForest | 0.1227 | 0.2677 | 0.6602 | |
| HDI-MF-Gower | 0.1202 | 0.2619 | 0.6678 | |
| 20 | Mean/mode | 0.1413 | 0.3314 | 0.6306 |
| KNN | 0.1353 | 0.3187 | 0.6361 | |
| MICE | 0.1302 | 0.3098 | 0.6396 | |
| MissForest | 0.1294 | 0.2755 | 0.6439 | |
| HDI-MF-Gower | 0.1255 | 0.2650 | 0.6525 |
Following data imputation with the HDI-MF-Gower method, key predictive variables were identified through a dual feature selection strategy. First, LASSO regression with 10-fold cross-validation was performed, yielding an optimal regularization parameter (λ_minimum) of 0.028 under the minimum criterion. This approach selected ten variables: Sex, complications, lymphovascular invasion, max tumor diameter, TNM stage, age, platelets, albumin, CEA, and intraoperative blood loss (Figure 2A and B).

Concurrently, the Boruta algorithm was run for 500 iterations to ensure stable feature importance evaluation, identifying nine features. Their importance ranking is visualized in Figure 2C. Seven features - age, CEA, albumin, TNM stage, max tumor diameter, lymphovascular invasion, and intraoperative blood loss - were confirmed as important, whereas Hemoglobin and red blood cell count remained tentative. The optimal feature subset was defined as the inter
The performance of ten predictive models, constructed using the selected key clinical features, was evaluated. The receiver operating characteristic curves (Figure 3A and B) showed that the extra trees model achieved the highest discriminative ability, AUC of 0.936 [95% confidence interval (CI): 0.904-0.963] on the training set and 0.853 (95%CI: 0.764-0.925), on the independent validation set. DeLong’s test revealed a statistically significant superiority in AUC for the extremely randomized trees (ET) model over KNN, support vector machine, and multi-layer perceptron models. In contrast, no significant difference in AUC was observed between ET and XGBoost, logistic regression, light gradient boosting ma

| Reference | Comparator | AUC reference | AUC comparator | Delta AUC | Z score | P value |
| ET | KNN | 0.853 | 0.658 | 0.195 | 3.299 | < 0.050 |
| ET | SVM | 0.853 | 0.660 | 0.193 | 3.285 | < 0.050 |
| ET | MLP | 0.853 | 0.760 | 0.091 | 2.150 | < 0.050 |
| ET | GB | 0.853 | 0.790 | 0.062 | 1.884 | 0.060 |
| ET | XGBoost | 0.853 | 0.808 | 0.044 | 1.650 | 0.098 |
| ET | LR | 0.853 | 0.810 | 0.043 | 1.473 | 0.141 |
| ET | LightGBM | 0.853 | 0.820 | 0.033 | 1.370 | 0.170 |
| ET | RF | 0.853 | 0.817 | 0.036 | 1.293 | 0.196 |
| ET | DT | 0.853 | 0.810 | 0.042 | 1.168 | 0.243 |
| Algorithms | Accuracy | Sensitivity | Precision | Specificity | F1 score |
| SVM | 0.587 | 0.476 | 0.556 | 0.680 | 0.513 |
| XGBoost | 0.696 | 0.571 | 0.706 | 0.700 | 0.632 |
| LightGBM | 0.750 | 0.738 | 0.706 | 0.745 | 0.729 |
| LR | 0.717 | 0.714 | 0.682 | 0.720 | 0.698 |
| RF | 0.707 | 0.691 | 0.674 | 0.720 | 0.682 |
| MLP | 0.663 | 0.786 | 0.600 | 0.560 | 0.680 |
| DT | 0.739 | 0.810 | 0.680 | 0.680 | 0.739 |
| GB | 0.674 | 0.476 | 0.714 | 0.715 | 0.571 |
| KNN | 0.609 | 0.452 | 0.594 | 0.740 | 0.514 |
| ET | 0.772 | 0.857 | 0.721 | 0.760 | 0.774 |
The calibration curves for the training and validation sets (Figure 3C and D) indicated strong predictive reliability for the extra trees model, which achieved Brier scores of 0.115 (95%CI: 0.096-0.135) and 0.162 (95%CI: 0.130-0.197), respectively, outperforming the other nine models. Decision curve analysis on the training set (Figure 3E) demonstrated that the ET model provided a substantially higher net benefit than the baseline strategy across threshold probabilities ranging from 0.1 to 0.9, and outperformed most other models over a wide threshold range. On the independent validation set (Figure 3F), the model maintained favorable clinical utility, exhibiting a high net benefit, particularly within the threshold probability range of 0.5 to 0.6. Furthermore, feature importance was analyzed using SHAP. The summary plot (Figure 4A) illustrated how each feature influenced the model’s output, revealing that decreased albumin levels, ad

To elucidate the model’s decision-making for individual cases, a SHAP force plot was generated for a representative patient (Figure 4C), illustrating how each feature value contributed to the final prediction. This enhances model inter
ML applications in surgical research, while still evolving, show considerable potential for risk prediction[24]. A study by Lee et al[25] exemplifies this in the context of gastric cancer, where they demonstrated that ML models like random forest and XGBoost surpass traditional logistic regression in predicting postoperative complications. Their study not only con
This study has several limitations. First, the single-center retrospective design may introduce selection bias and limit the generalizability of the findings. Consequently, the model requires external validation in a multicenter, prospective group to confirm its robustness and clinical applicability. Second, although the selected feature set is clinically comprehensive, it lacks molecular biomarkers that could further enhance prognostic accuracy. Future research should therefore focus on multicenter validation and incorporate more biologically relevant variables.
In summary, this study developed and validated a ML-based model for predicting 3-year mortality risk after gastric cancer surgery. The model demonstrated high predictive accuracy and clinical interpretability, underpinned by several key innovations. The novel HDI-MF-Gower imputation method effectively handled missing clinical data, thereby enhancing model performance. A robust set of seven clinically significant prognostic factors was identified through a dual feature selection strategy. The extra trees classifier emerged as the optimal algorithm, and its integration with SHAP analysis and a web-based tool ensured both transparency and practical utility. Future multi-center, large-scale prospec
| 1. | López MJ, Carbajal J, Alfaro AL, Saravia LG, Zanabria D, Araujo JM, Quispe L, Zevallos A, Buleje JL, Cho CE, Sarmiento M, Pinto JA, Fajardo W. Characteristics of gastric cancer around the world. Crit Rev Oncol Hematol. 2023;181:103841. [RCA] [PubMed] [DOI] [Full Text] [Cited by in Crossref: 334] [Cited by in RCA: 271] [Article Influence: 90.3] [Reference Citation Analysis (12)] |
| 2. | Mazurek M, Szewc M, Sitarz MZ, Dudzińska E, Sitarz R. Gastric Cancer: An Up-to-Date Review with New Insights into Early-Onset Gastric Cancer. Cancers (Basel). 2024;16:3163. [RCA] [PubMed] [DOI] [Full Text] [Full Text (PDF)] [Cited by in Crossref: 21] [Cited by in RCA: 19] [Article Influence: 9.5] [Reference Citation Analysis (1)] |
| 3. | Wang FH, Zhang XT, Tang L, Wu Q, Cai MY, Li YF, Qu XJ, Qiu H, Zhang YJ, Ying JE, Zhang J, Sun LY, Lin RB, Wang C, Liu H, Qiu MZ, Guan WL, Rao SX, Ji JF, Xin Y, Sheng WQ, Xu HM, Zhou ZW, Zhou AP, Jin J, Yuan XL, Bi F, Liu TS, Liang H, Zhang YQ, Li GX, Liang J, Liu BR, Shen L, Li J, Xu RH. The Chinese Society of Clinical Oncology (CSCO): Clinical guidelines for the diagnosis and treatment of gastric cancer, 2023. Cancer Commun (Lond). 2024;44:127-172. [RCA] [PubMed] [DOI] [Full Text] [Full Text (PDF)] [Cited by in Crossref: 270] [Cited by in RCA: 274] [Article Influence: 137.0] [Reference Citation Analysis (2)] |
| 4. | Beyer K. Surgery Matters: Progress in Surgical Management of Gastric Cancer. Curr Treat Options Oncol. 2023;24:108-129. [RCA] [PubMed] [DOI] [Full Text] [Full Text (PDF)] [Cited by in Crossref: 17] [Cited by in RCA: 15] [Article Influence: 5.0] [Reference Citation Analysis (0)] |
| 5. | Schütte K, Schulz C, Middelberg-Bisping K. Impact of gastric cancer treatment on quality of life of patients. Best Pract Res Clin Gastroenterol. 2021;50-51:101727. [RCA] [PubMed] [DOI] [Full Text] [Cited by in Crossref: 36] [Cited by in RCA: 30] [Article Influence: 6.0] [Reference Citation Analysis (0)] |
| 6. | Sirody J, Kaji AH, Hari DM, Chen KT. Patterns of gastric cancer metastasis in the United States. Am J Surg. 2022;224:445-448. [RCA] [PubMed] [DOI] [Full Text] [Cited by in Crossref: 48] [Cited by in RCA: 44] [Article Influence: 11.0] [Reference Citation Analysis (0)] |
| 7. | Zhang M, Ding C, Xu L, Ou B, Feng S, Wang G, Wang W, Liang Y, Chen Y, Zhou Z, Qiu H. Comparison of a Tumor-Ratio-Metastasis Staging System and the 8th AJCC TNM Staging System for Gastric Cancer. Front Oncol. 2021;11:595421. [RCA] [PubMed] [DOI] [Full Text] [Full Text (PDF)] [Cited by in Crossref: 14] [Cited by in RCA: 18] [Article Influence: 3.6] [Reference Citation Analysis (4)] |
| 8. | López Sala P, Leturia Etxeberria M, Inchausti Iguíñiz E, Astiazaran Rodríguez A, Aguirre Oteiza MI, Zubizarreta Etxaniz M. Gastric adenocarcinoma: A review of the TNM classification system and ways of spreading. Radiologia (Engl Ed). 2023;65:66-80. [RCA] [PubMed] [DOI] [Full Text] [Cited by in Crossref: 20] [Cited by in RCA: 16] [Article Influence: 5.3] [Reference Citation Analysis (1)] |
| 9. | Du H, Yang Q, Ge A, Zhao C, Ma Y, Wang S. Explainable machine learning models for early gastric cancer diagnosis. Sci Rep. 2024;14:17457. [RCA] [PubMed] [DOI] [Full Text] [Full Text (PDF)] [Cited by in Crossref: 26] [Cited by in RCA: 15] [Article Influence: 7.5] [Reference Citation Analysis (0)] |
| 10. | Zhou CM, Wang Y, Ye HT, Yan S, Ji M, Liu P, Yang JJ. Machine learning predicts lymph node metastasis of poorly differentiated-type intramucosal gastric cancer. Sci Rep. 2021;11:1300. [RCA] [PubMed] [DOI] [Full Text] [Full Text (PDF)] [Cited by in Crossref: 33] [Cited by in RCA: 29] [Article Influence: 5.8] [Reference Citation Analysis (1)] |
| 11. | Seo JW, Park KB, Lim ST, Jun KH, Chin HM. Machine learning models for prediction of lymph node metastasis in patients with T1b gastric cancer. Am J Cancer Res. 2024;14:3842-3851. [RCA] [PubMed] [DOI] [Full Text] [Cited by in Crossref: 5] [Cited by in RCA: 5] [Article Influence: 2.5] [Reference Citation Analysis (0)] |
| 12. | Gu Y, Su S, Wang X, Mao J, Ni X, Li A, Liang Y, Zeng X. Comparative study of XGBoost and logistic regression for predicting sarcopenia in postsurgical gastric cancer patients. Sci Rep. 2025;15:12808. [RCA] [PubMed] [DOI] [Full Text] [Full Text (PDF)] [Cited by in Crossref: 12] [Cited by in RCA: 9] [Article Influence: 9.0] [Reference Citation Analysis (0)] |
| 13. | Hu YH, Wu RY, Lin YC, Lin TY. A novel MissForest-based missing values imputation approach with recursive feature elimination in medical applications. BMC Med Res Methodol. 2024;24:269. [RCA] [PubMed] [DOI] [Full Text] [Full Text (PDF)] [Cited by in Crossref: 23] [Cited by in RCA: 11] [Article Influence: 5.5] [Reference Citation Analysis (0)] |
| 14. | Beesley LJ, Bondarenko I, Elliot MR, Kurian AW, Katz SJ, Taylor JM. Multiple imputation with missing data indicators. Stat Methods Med Res. 2021;30:2685-2700. [RCA] [PubMed] [DOI] [Full Text] [Full Text (PDF)] [Cited by in Crossref: 92] [Cited by in RCA: 67] [Article Influence: 13.4] [Reference Citation Analysis (0)] |
| 15. | Tang F, Ishwaran H. Random Forest Missing Data Algorithms. Stat Anal Data Min. 2017;10:363-377. [RCA] [PubMed] [DOI] [Full Text] [Full Text (PDF)] [Cited by in Crossref: 641] [Cited by in RCA: 343] [Article Influence: 38.1] [Reference Citation Analysis (0)] |
| 16. | Stekhoven DJ, Bühlmann P. MissForest--non-parametric missing value imputation for mixed-type data. Bioinformatics. 2012;28:112-118. [RCA] [PubMed] [DOI] [Full Text] [Cited by in Crossref: 4986] [Cited by in RCA: 3310] [Article Influence: 236.4] [Reference Citation Analysis (0)] |
| 17. | Hu J, Xu J, Li M, Jiang Z, Mao J, Feng L, Miao K, Li H, Chen J, Bai Z, Li X, Lu G, Li Y. Identification and validation of an explainable prediction model of acute kidney injury with prognostic implications in critically ill children: a prospective multicenter cohort study. EClinicalMedicine. 2024;68:102409. [RCA] [PubMed] [DOI] [Full Text] [Full Text (PDF)] [Cited by in Crossref: 159] [Cited by in RCA: 145] [Article Influence: 72.5] [Reference Citation Analysis (1)] |
| 18. | Wang X, Ren J, Ren H, Song W, Qiao Y, Zhao Y, Linghu L, Cui Y, Zhao Z, Chen L, Qiu L. Diabetes mellitus early warning and factor analysis using ensemble Bayesian networks with SMOTE-ENN and Boruta. Sci Rep. 2023;13:12718. [RCA] [PubMed] [DOI] [Full Text] [Full Text (PDF)] [Cited by in Crossref: 33] [Cited by in RCA: 24] [Article Influence: 8.0] [Reference Citation Analysis (0)] |
| 19. | Hu F, Zhu J, Zhang S, Wang C, Zhang L, Zhou H, Shi H. A predictive model for the risk of sepsis within 30 days of admission in patients with traumatic brain injury in the intensive care unit: a retrospective analysis based on MIMIC-IV database. Eur J Med Res. 2023;28:290. [RCA] [PubMed] [DOI] [Full Text] [Full Text (PDF)] [Cited by in Crossref: 10] [Cited by in RCA: 11] [Article Influence: 3.7] [Reference Citation Analysis (0)] |
| 20. | Kong C, Zhu Y, Xie X, Wu J, Qian M. Six potential biomarkers in septic shock: a deep bioinformatics and prospective observational study. Front Immunol. 2023;14:1184700. [RCA] [PubMed] [DOI] [Full Text] [Full Text (PDF)] [Cited by in Crossref: 45] [Cited by in RCA: 42] [Article Influence: 14.0] [Reference Citation Analysis (0)] |
| 21. | Zhou H, Xin Y, Li S. A diabetes prediction model based on Boruta feature selection and ensemble learning. BMC Bioinformatics. 2023;24:224. [RCA] [PubMed] [DOI] [Full Text] [Full Text (PDF)] [Cited by in Crossref: 153] [Cited by in RCA: 81] [Article Influence: 27.0] [Reference Citation Analysis (0)] |
| 22. | Mathieson L, Mendes A, Marsden J, Pond J, Moscato P. Computer-Aided Breast Cancer Diagnosis with Optimal Feature Sets: Reduction Rules and Optimization Techniques. Methods Mol Biol. 2017;1526:299-325. [RCA] [PubMed] [DOI] [Full Text] [Cited by in Crossref: 3] [Cited by in RCA: 1] [Article Influence: 0.1] [Reference Citation Analysis (0)] |
| 23. | Han Y, Xie X, Qiu J, Tang Y, Song Z, Li W, Wu X. Early prediction of sepsis associated encephalopathy in elderly ICU patients using machine learning models: a retrospective study based on the MIMIC-IV database. Front Cell Infect Microbiol. 2025;15:1545979. [RCA] [PubMed] [DOI] [Full Text] [Full Text (PDF)] [Cited by in Crossref: 15] [Cited by in RCA: 16] [Article Influence: 16.0] [Reference Citation Analysis (0)] |
| 24. | Tey SF, Liu CF, Chien TW, Hsu CW, Chan KC, Chen CJ, Cheng TJ, Wu WS. Predicting the 14-Day Hospital Readmission of Patients with Pneumonia Using Artificial Neural Networks (ANN). Int J Environ Res Public Health. 2021;18:5110. [RCA] [PubMed] [DOI] [Full Text] [Full Text (PDF)] [Cited by in Crossref: 19] [Cited by in RCA: 10] [Article Influence: 2.0] [Reference Citation Analysis (0)] |
| 25. | Lee S, Oh HJ, Yoo H, Kim CY. Machine Learning Insight: Unveiling Overlooked Risk Factors for Postoperative Complications in Gastric Cancer. Cancers (Basel). 2025;17:1225. [RCA] [PubMed] [DOI] [Full Text] [Full Text (PDF)] [Cited by in Crossref: 3] [Cited by in RCA: 3] [Article Influence: 3.0] [Reference Citation Analysis (0)] |
Open Access: This article is an open-access article that was selected by an in-house editor and fully peer-reviewed by external reviewers. It is distributed in accordance with the Creative Commons Attribution NonCommercial (CC BY-NC 4.0) license, which permits others to distribute, remix, adapt, build upon this work non-commercially, and license their derivative works on different terms, provided the original work is properly cited and the use is non-commercial. See: https://creativecommons.org/Licenses/by-nc/4.0/