
















Copyright: ©Author(s) 2026.
World J Gastrointest Surg. Sep 27, 2026; 18(9): 122362
Published online Sep 27, 2026. doi: 10.4240/wjgs.122362
Published online Sep 27, 2026. doi: 10.4240/wjgs.122362
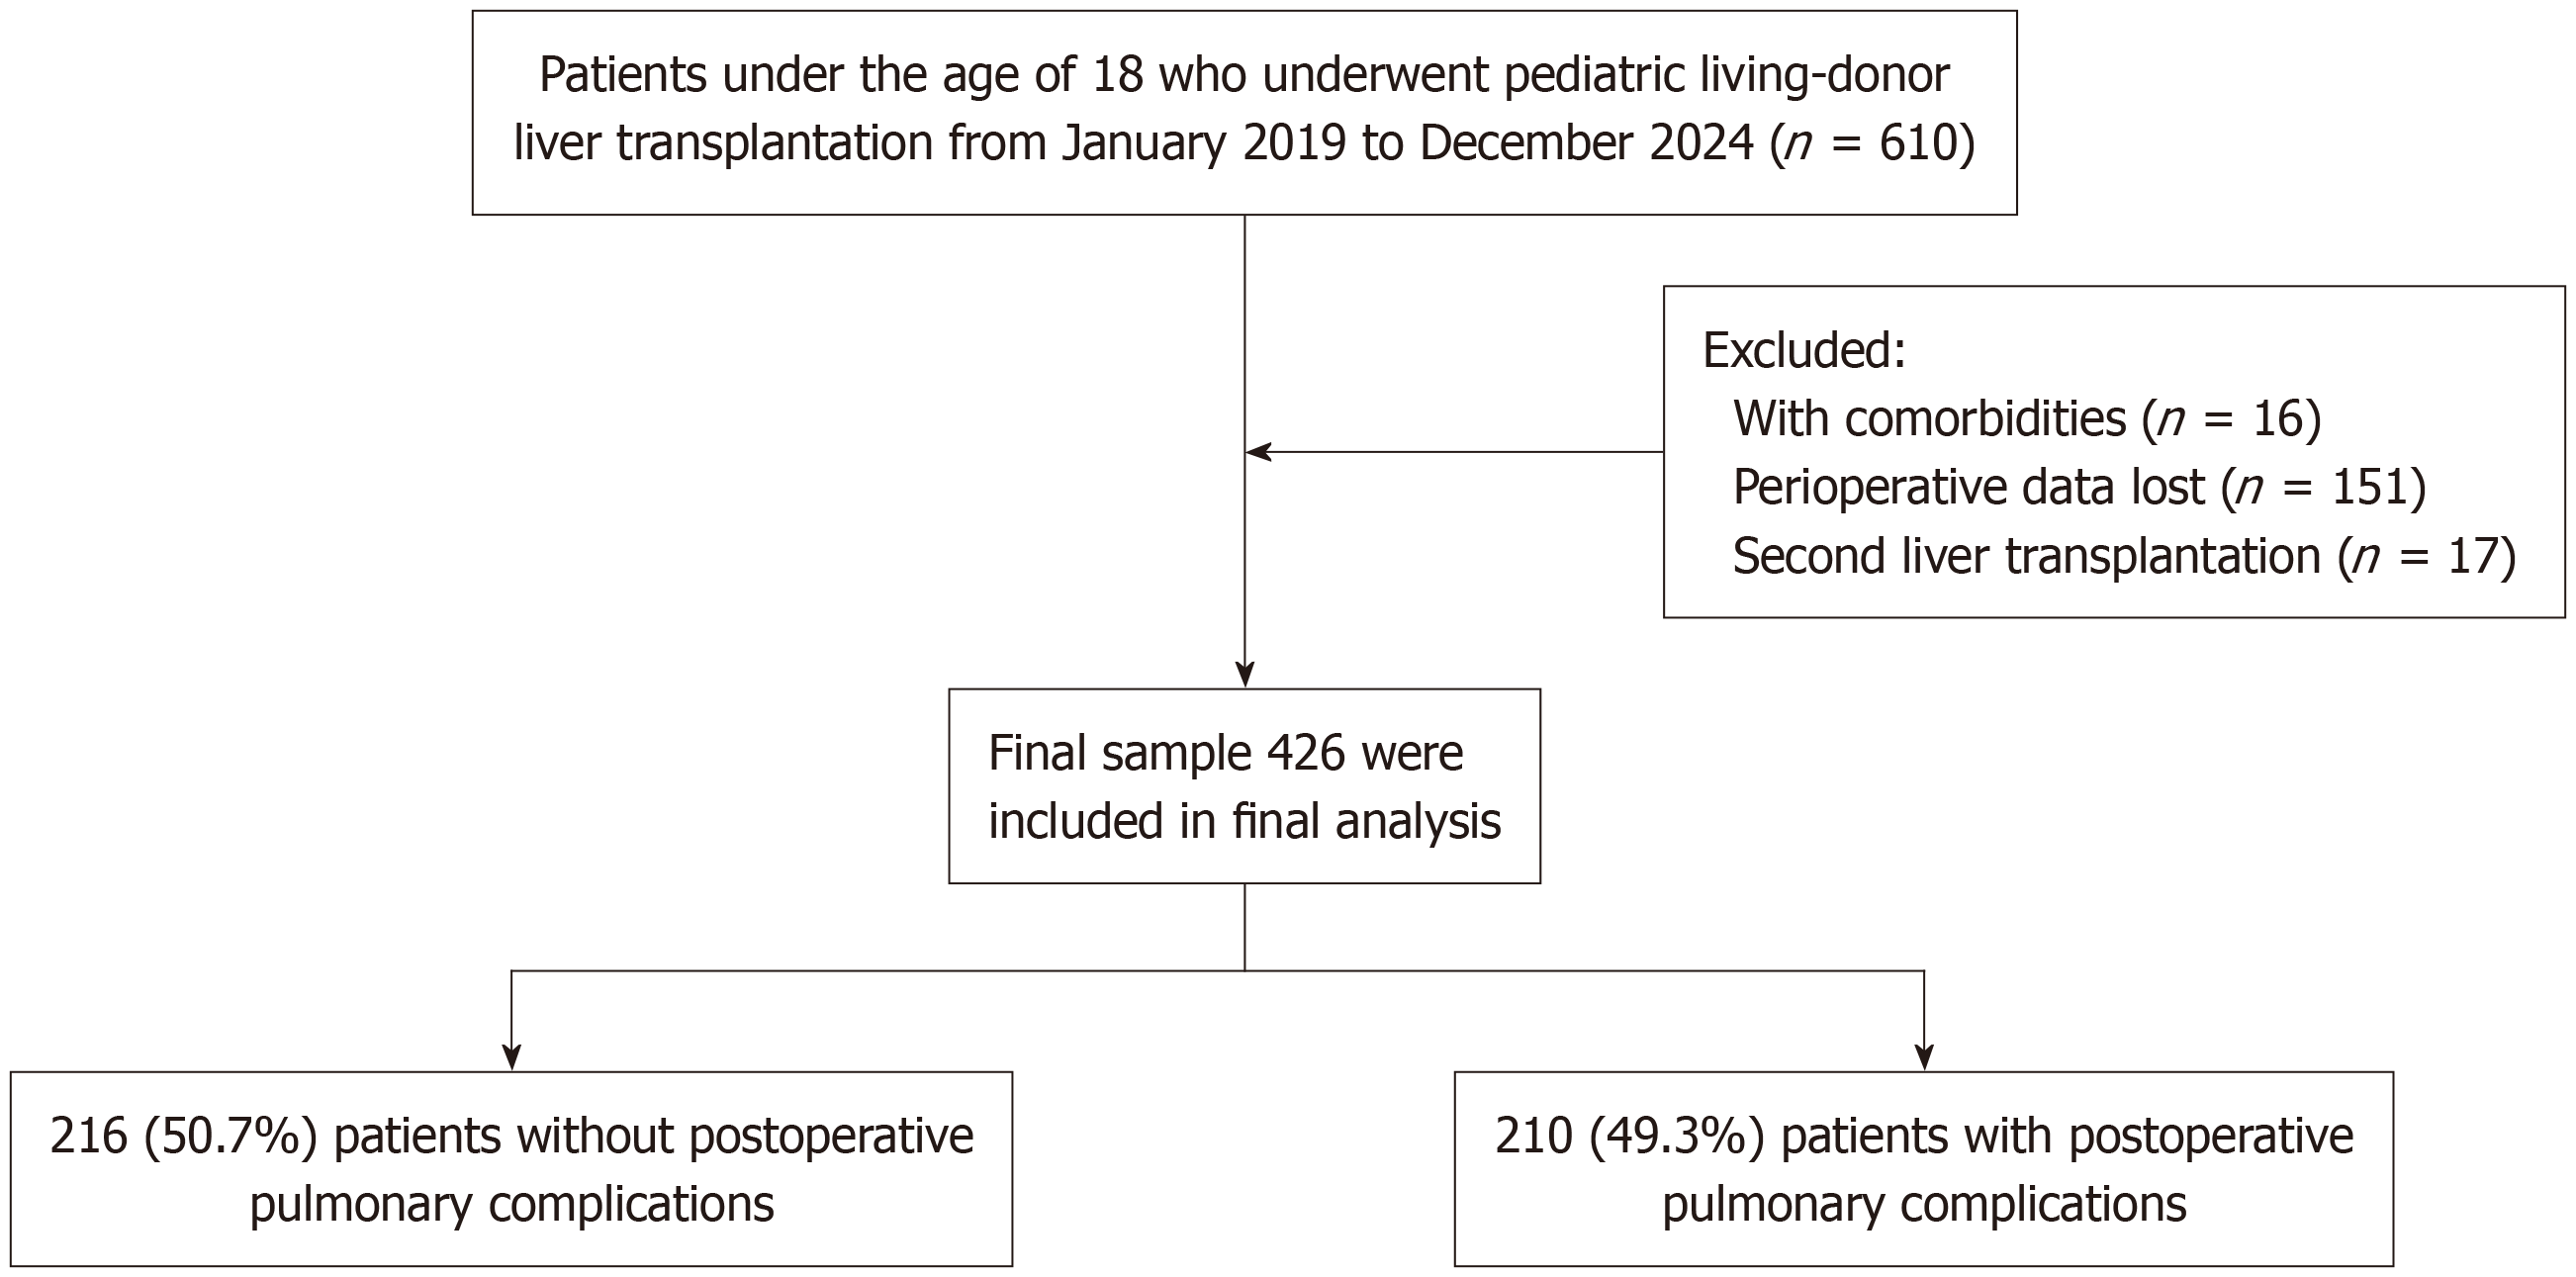
Figure 1 The flow chart of the study.
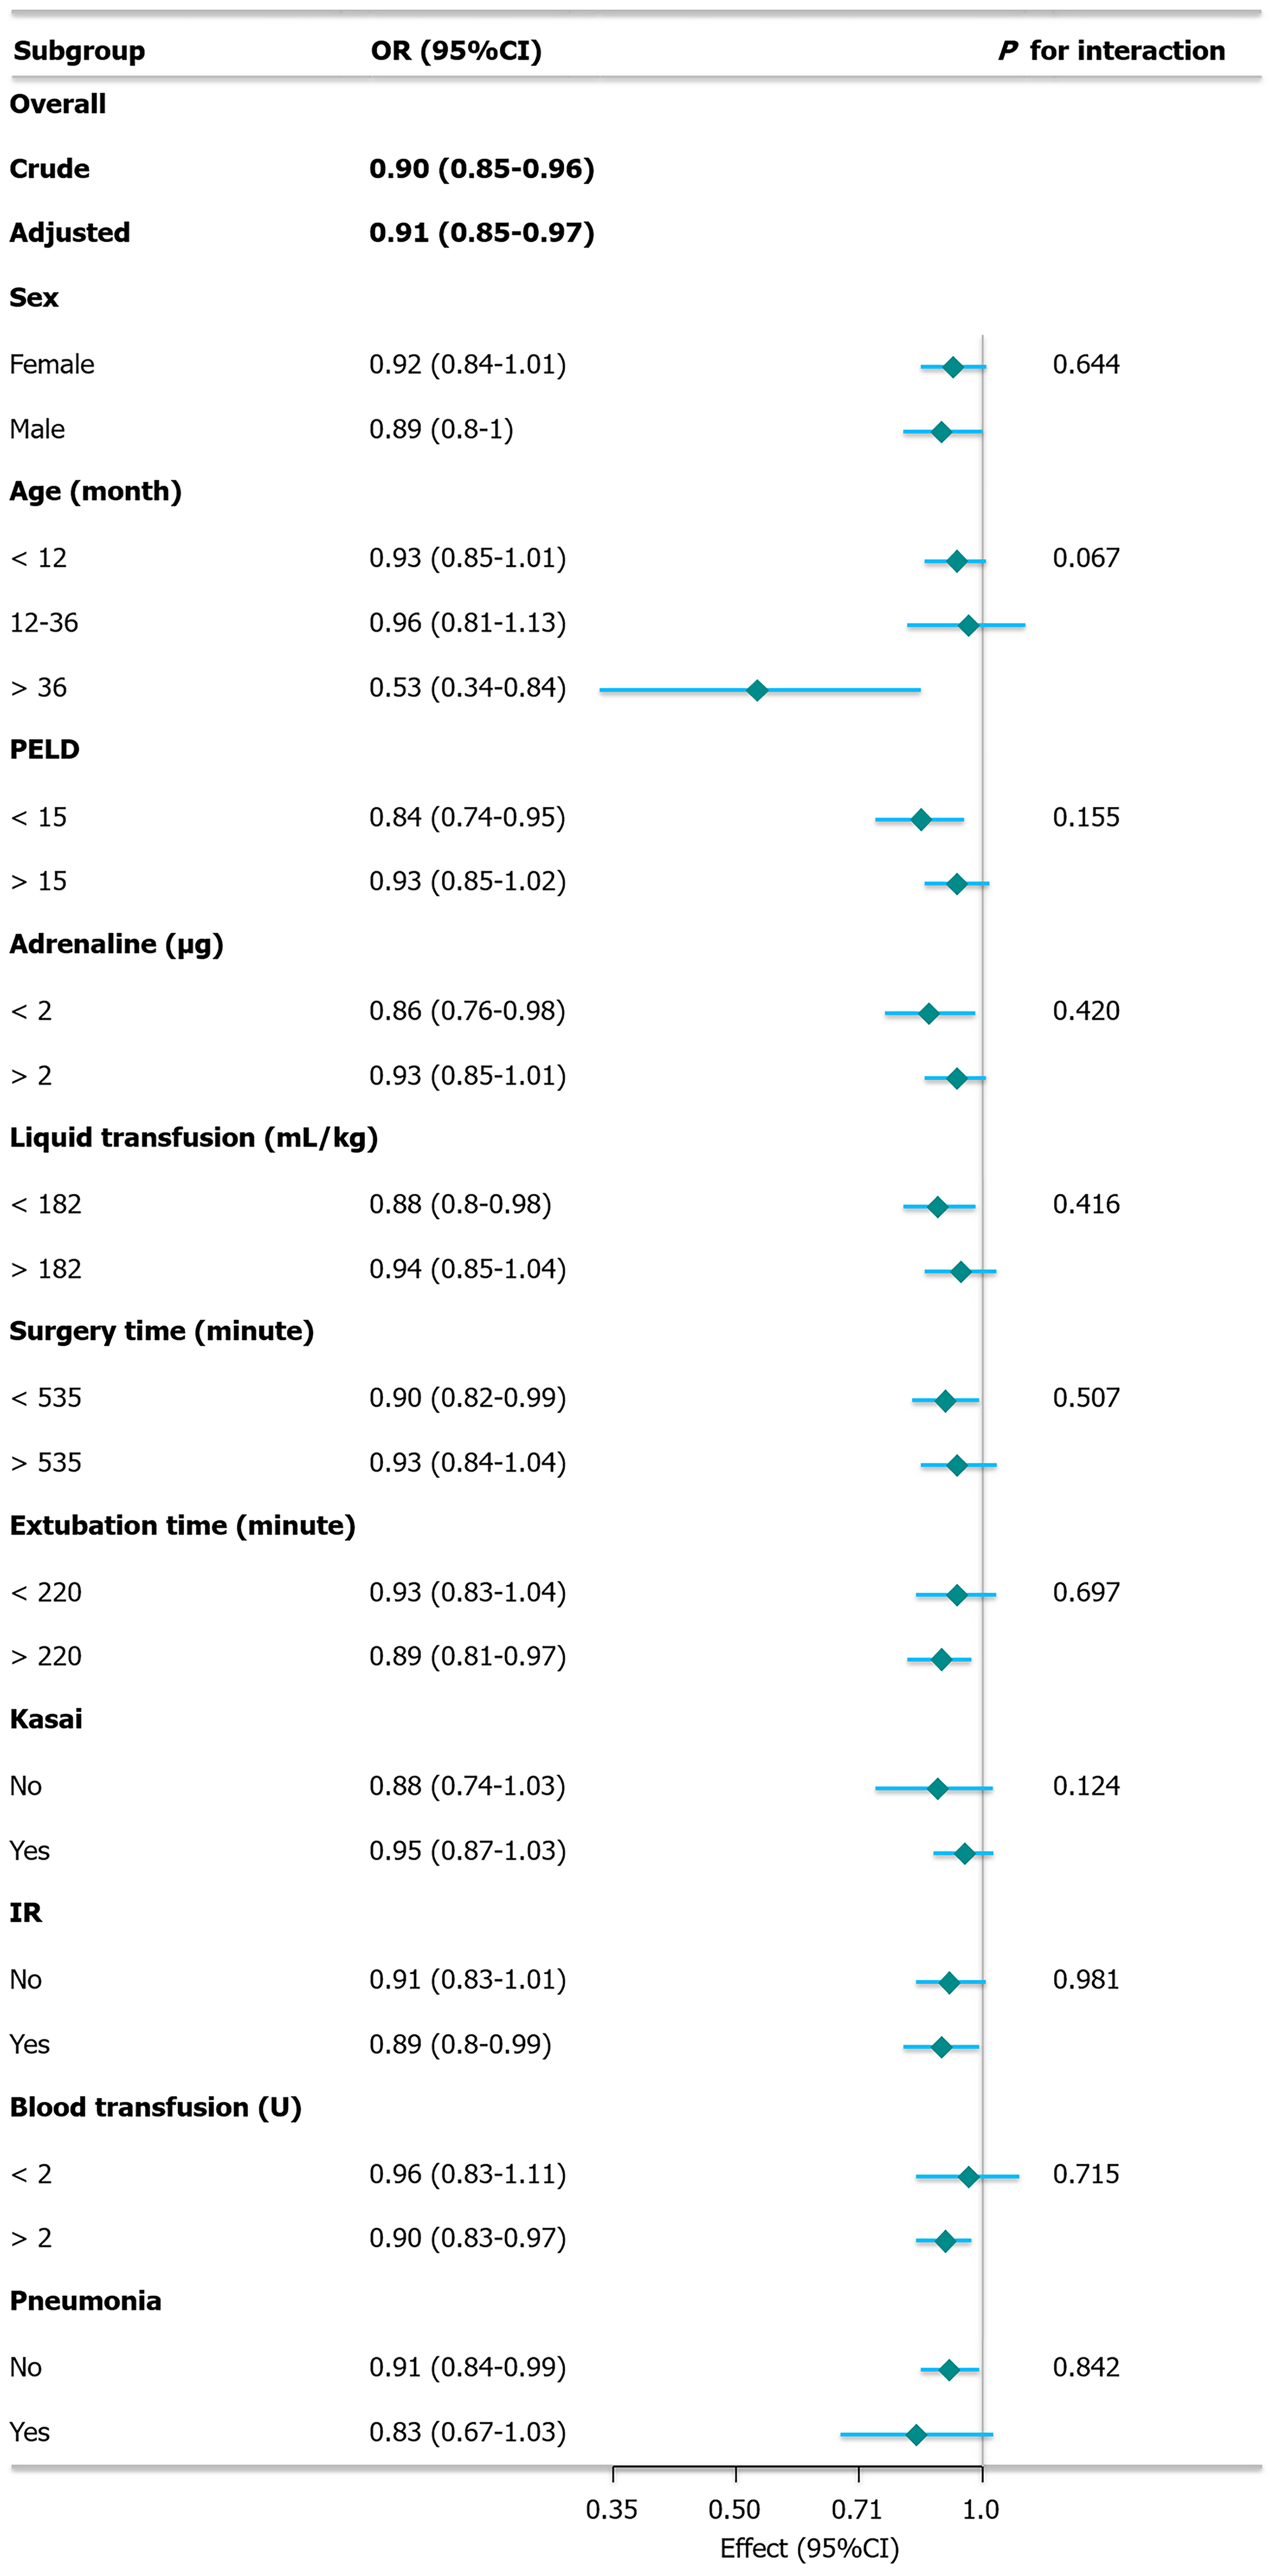
Figure 2 Subgroup analysis between central venous pressure and postoperative pulmonary complication.
Subgroup forest plot for the incidence of postoperative pulmonary complications. Adjusted for age, sex, pediatric end-stage liver disease, adrenaline administration, liquid transfusion, surgery duration, mechanical ventilation time, history of Kasai operation, ischemia-reperfusion events and incidence of pneumonia. OR: Odds ratio; 95%CI: 95% confidence interval; IR: Ischemia-reperfusion; PELD: Pediatric end-stage liver disease.
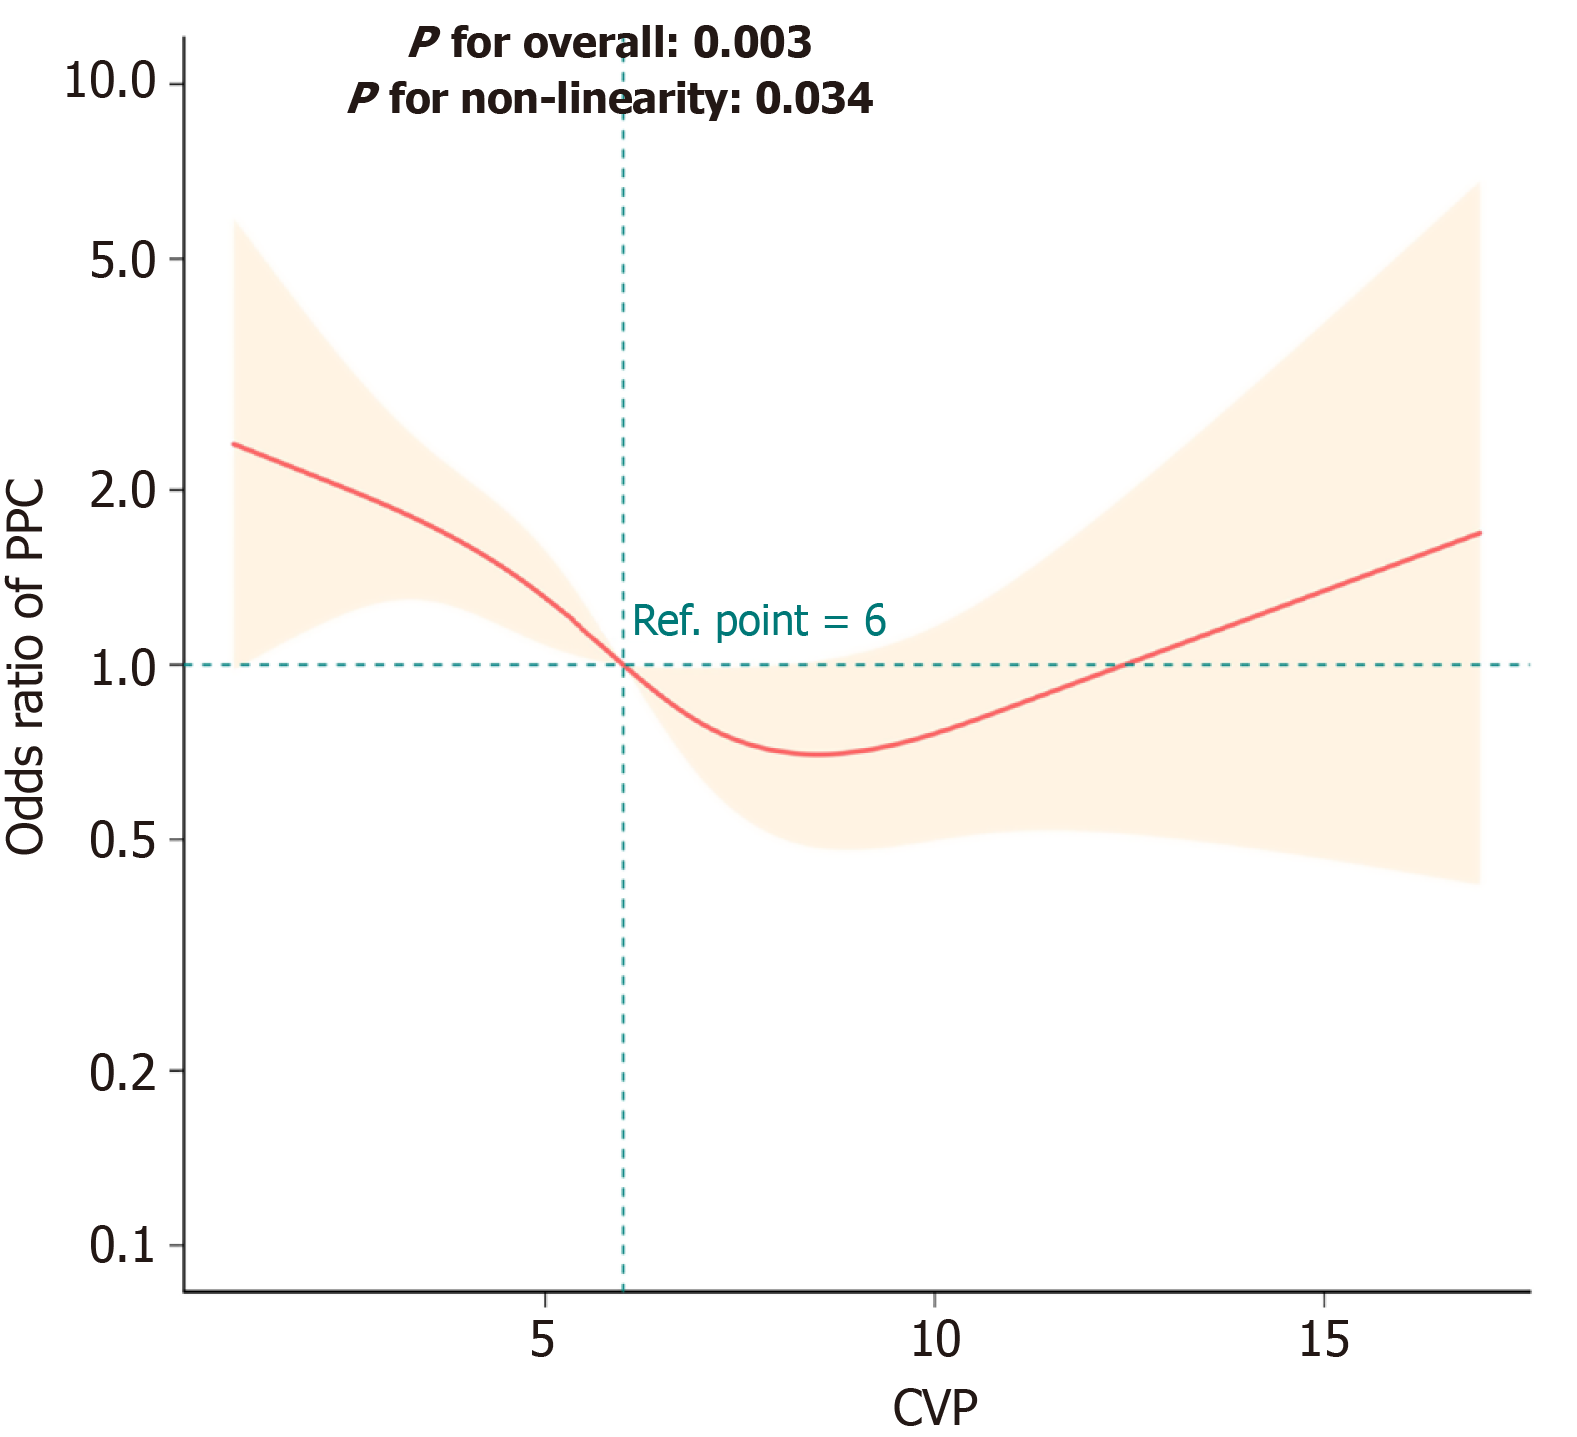
Figure 3 Nonlinear relationship between central venous pressure and postoperative pulmonary complications.
Adjustment factors included age + sex + cold ischemia time + blood loss + urine + liquid transfusion + blood transfusion + ischemia-reperfusion + anthepatic phase time + pediatric end-stage liver disease sore. Restricted cubic splines results for the incidence of postoperative pulmonary complications. Curves represent estimated adjusted odds ratios (ORs), and shaded ribbons represent 95% confidence intervals. The vertical dotted line represents the lowest point of the curve which represents the lowest OR. The horizontal dashed line represents a hazard ratio of 1.0. PPC: Postoperative pulmonary complication; CVP: Central venous pressure.
- Citation: Dong AL, Li HX, Jia LL, Sun Y, Gao W, Yu WL. Association between central venous pressure and postoperative pulmonary complications in living-donor liver transplantation for pediatric patients. World J Gastrointest Surg 2026; 18(9): 122362
- URL: https://www.wjgnet.com/1948-9366/full/v18/i9/122362.htm
- DOI: https://dx.doi.org/10.4240/wjgs.122362