
















Copyright: ©Author(s) 2026.
World J Gastrointest Surg. Sep 27, 2026; 18(9): 120394
Published online Sep 27, 2026. doi: 10.4240/wjgs.120394
Published online Sep 27, 2026. doi: 10.4240/wjgs.120394
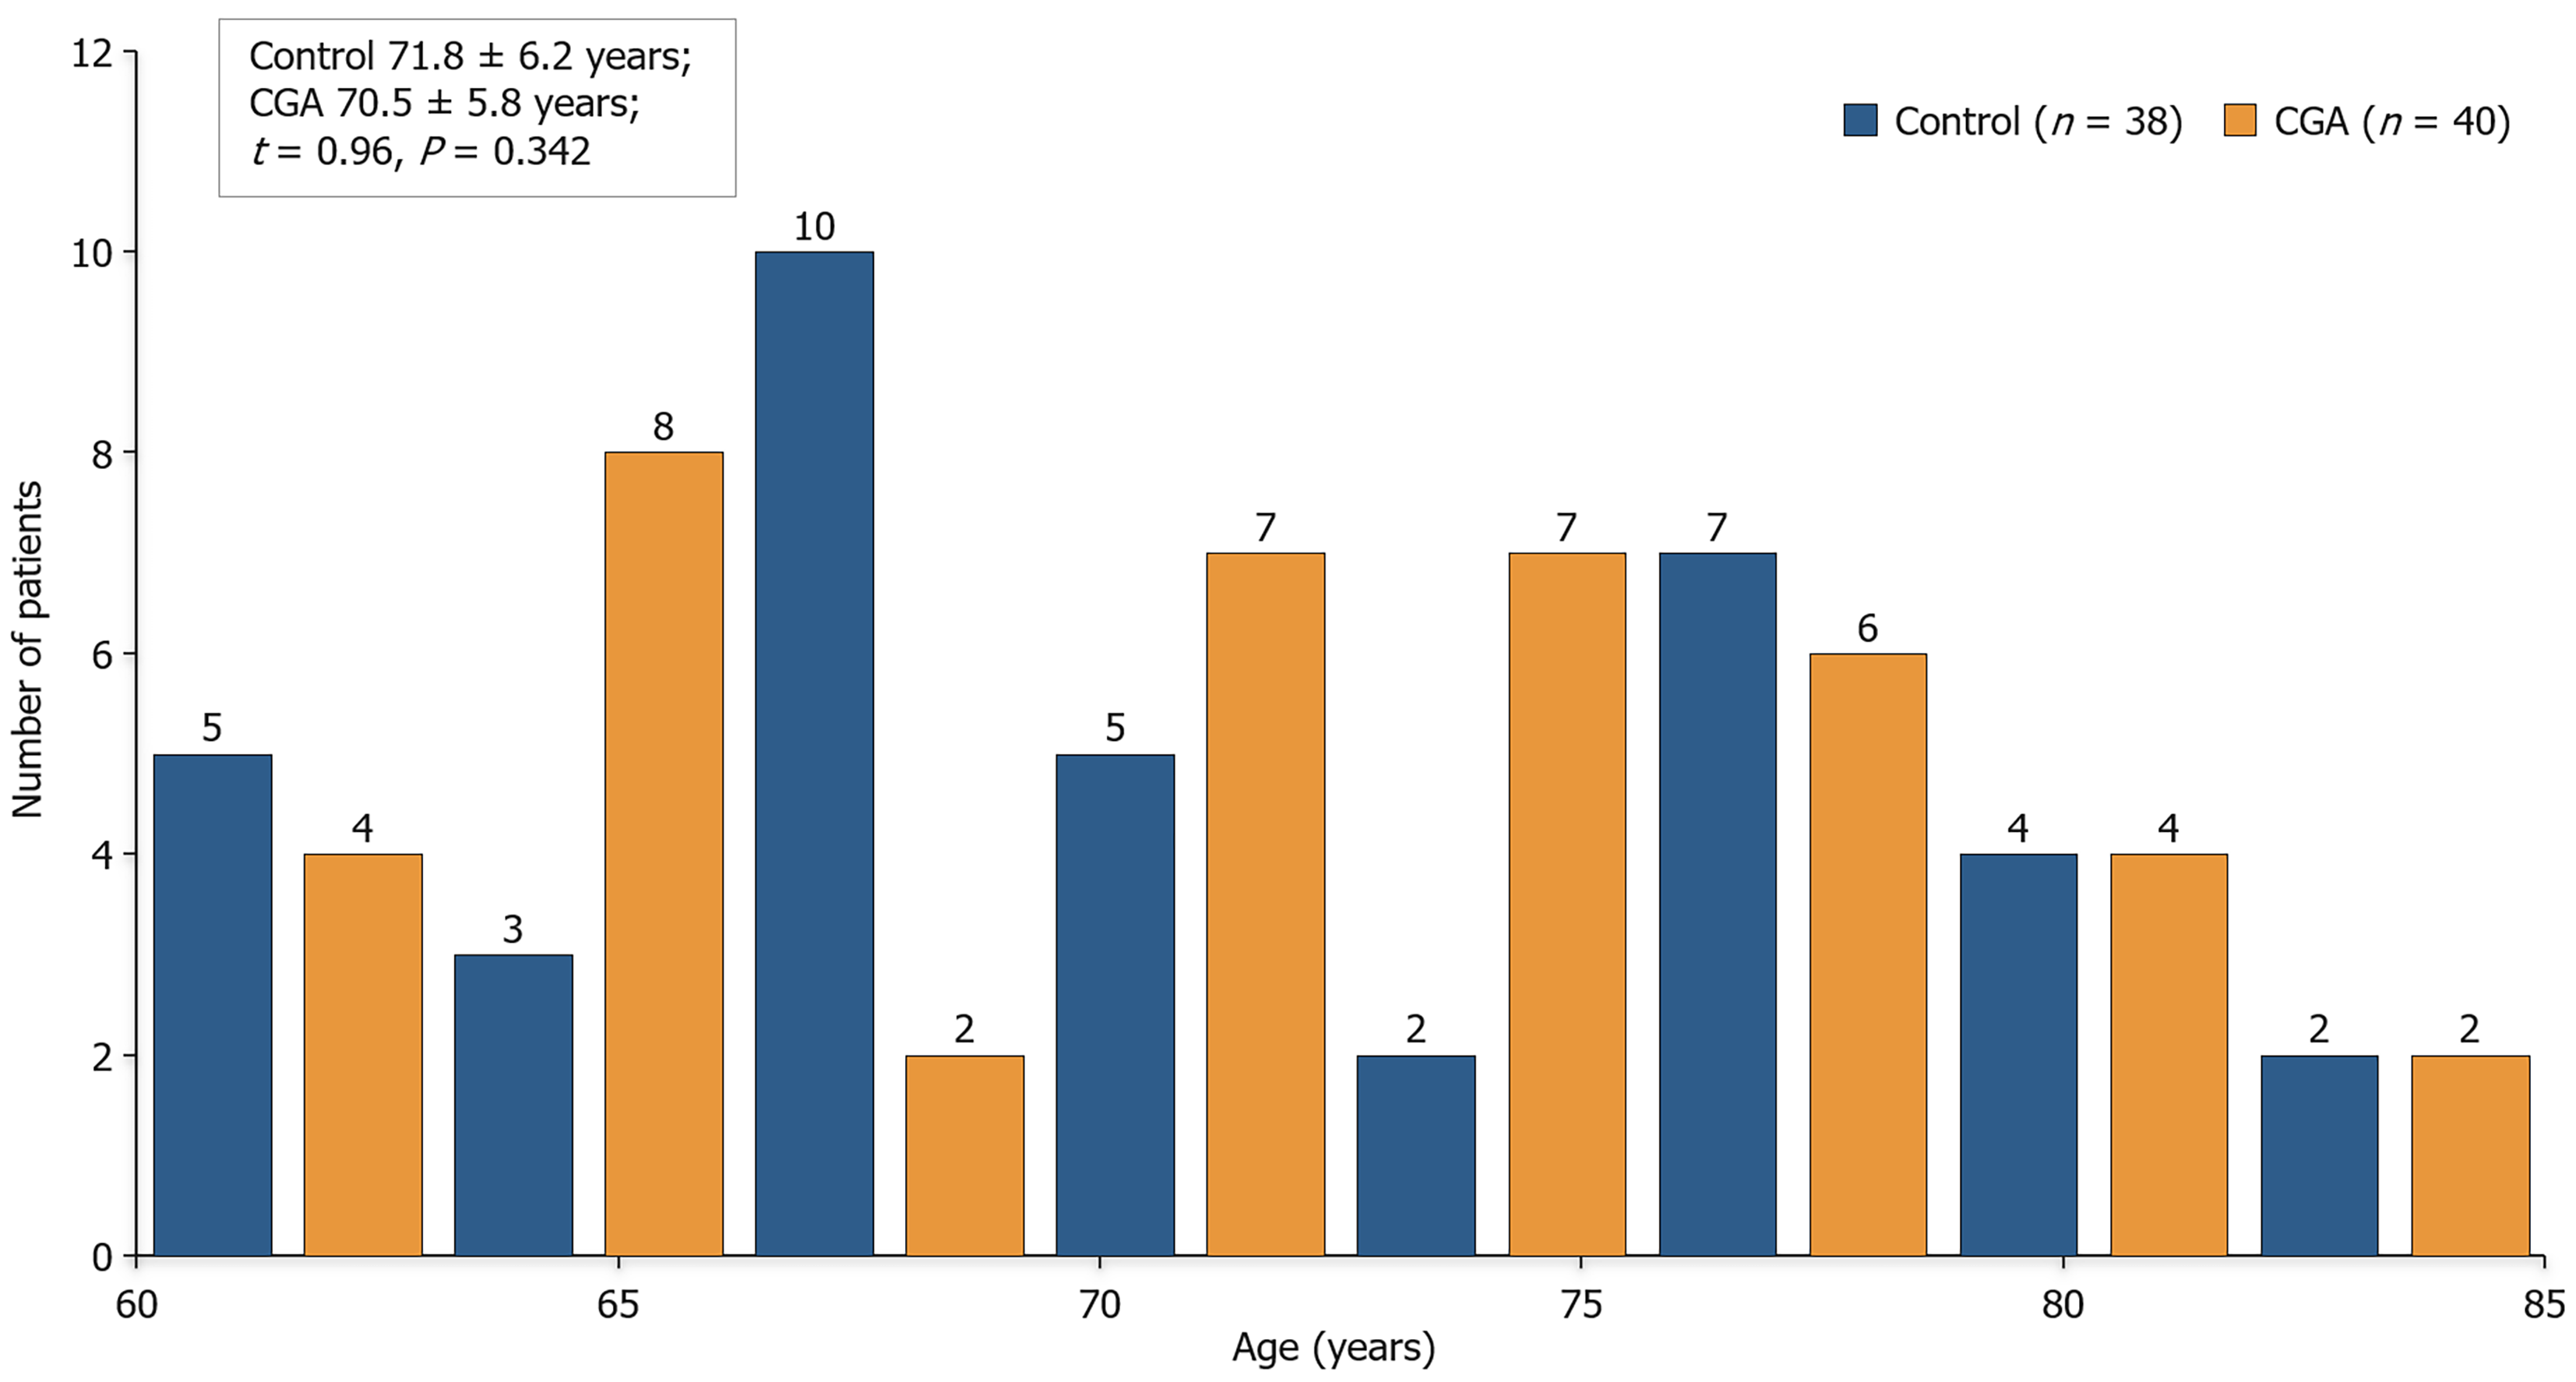
Figure 1 Age distribution by study group.
Both groups had similar age distributions (control: 71.8 ± 6.2 years; comprehensive geriatric assessment: 70.5 ± 5.8 years; t = 0.96, P = 0.342). CGA: Comprehensive geriatric assessment.
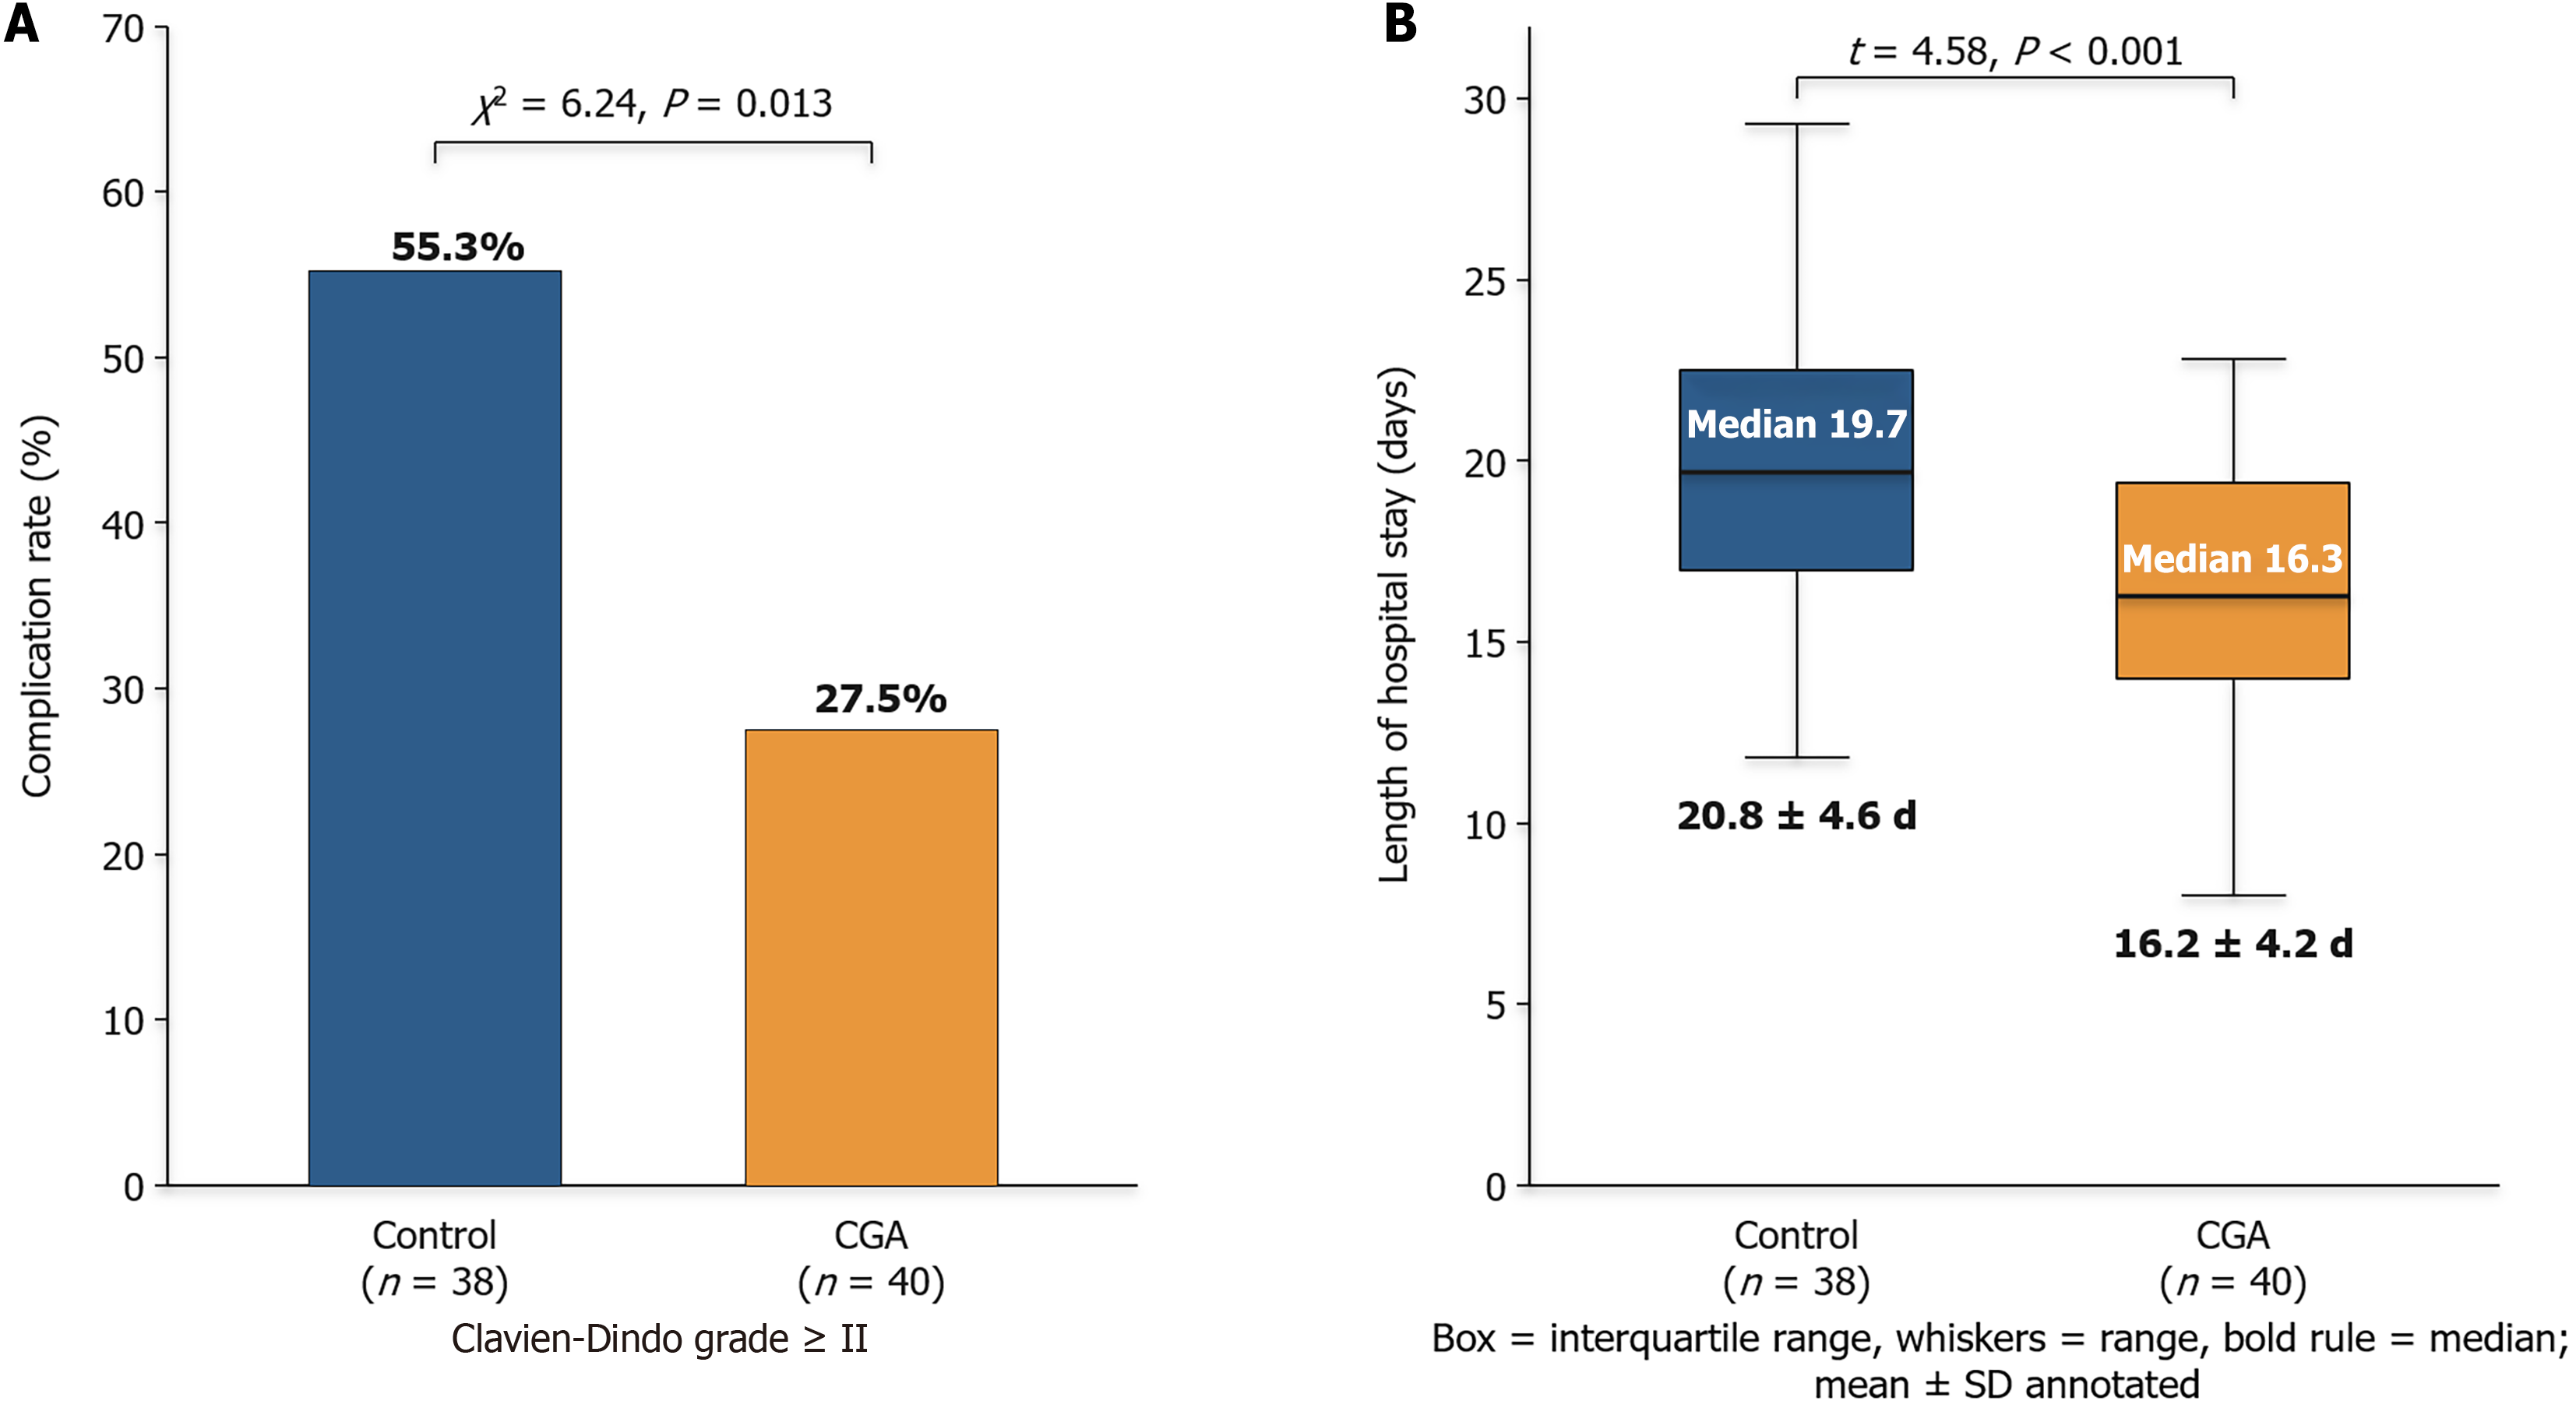
Figure 2 Primary outcomes.
A: Postoperative complication rate (Clavien-Dindo grade ≥ II), comprehensive geriatric assessment group 27.5% vs control 55.3% (χ2 = 6.24, P = 0.013); B: Hospital length of stay, comprehensive geriatric assessment group 16.2 ± 4.2 days vs control 20.8 ± 4.6 days (t = 4.58, P < 0.001). Data in Figure 2B are shown as box plots (box, interquartile range; whiskers, range; horizontal rule, median), with the group mean ± SD annotated. CGA: Comprehensive geriatric assessment.
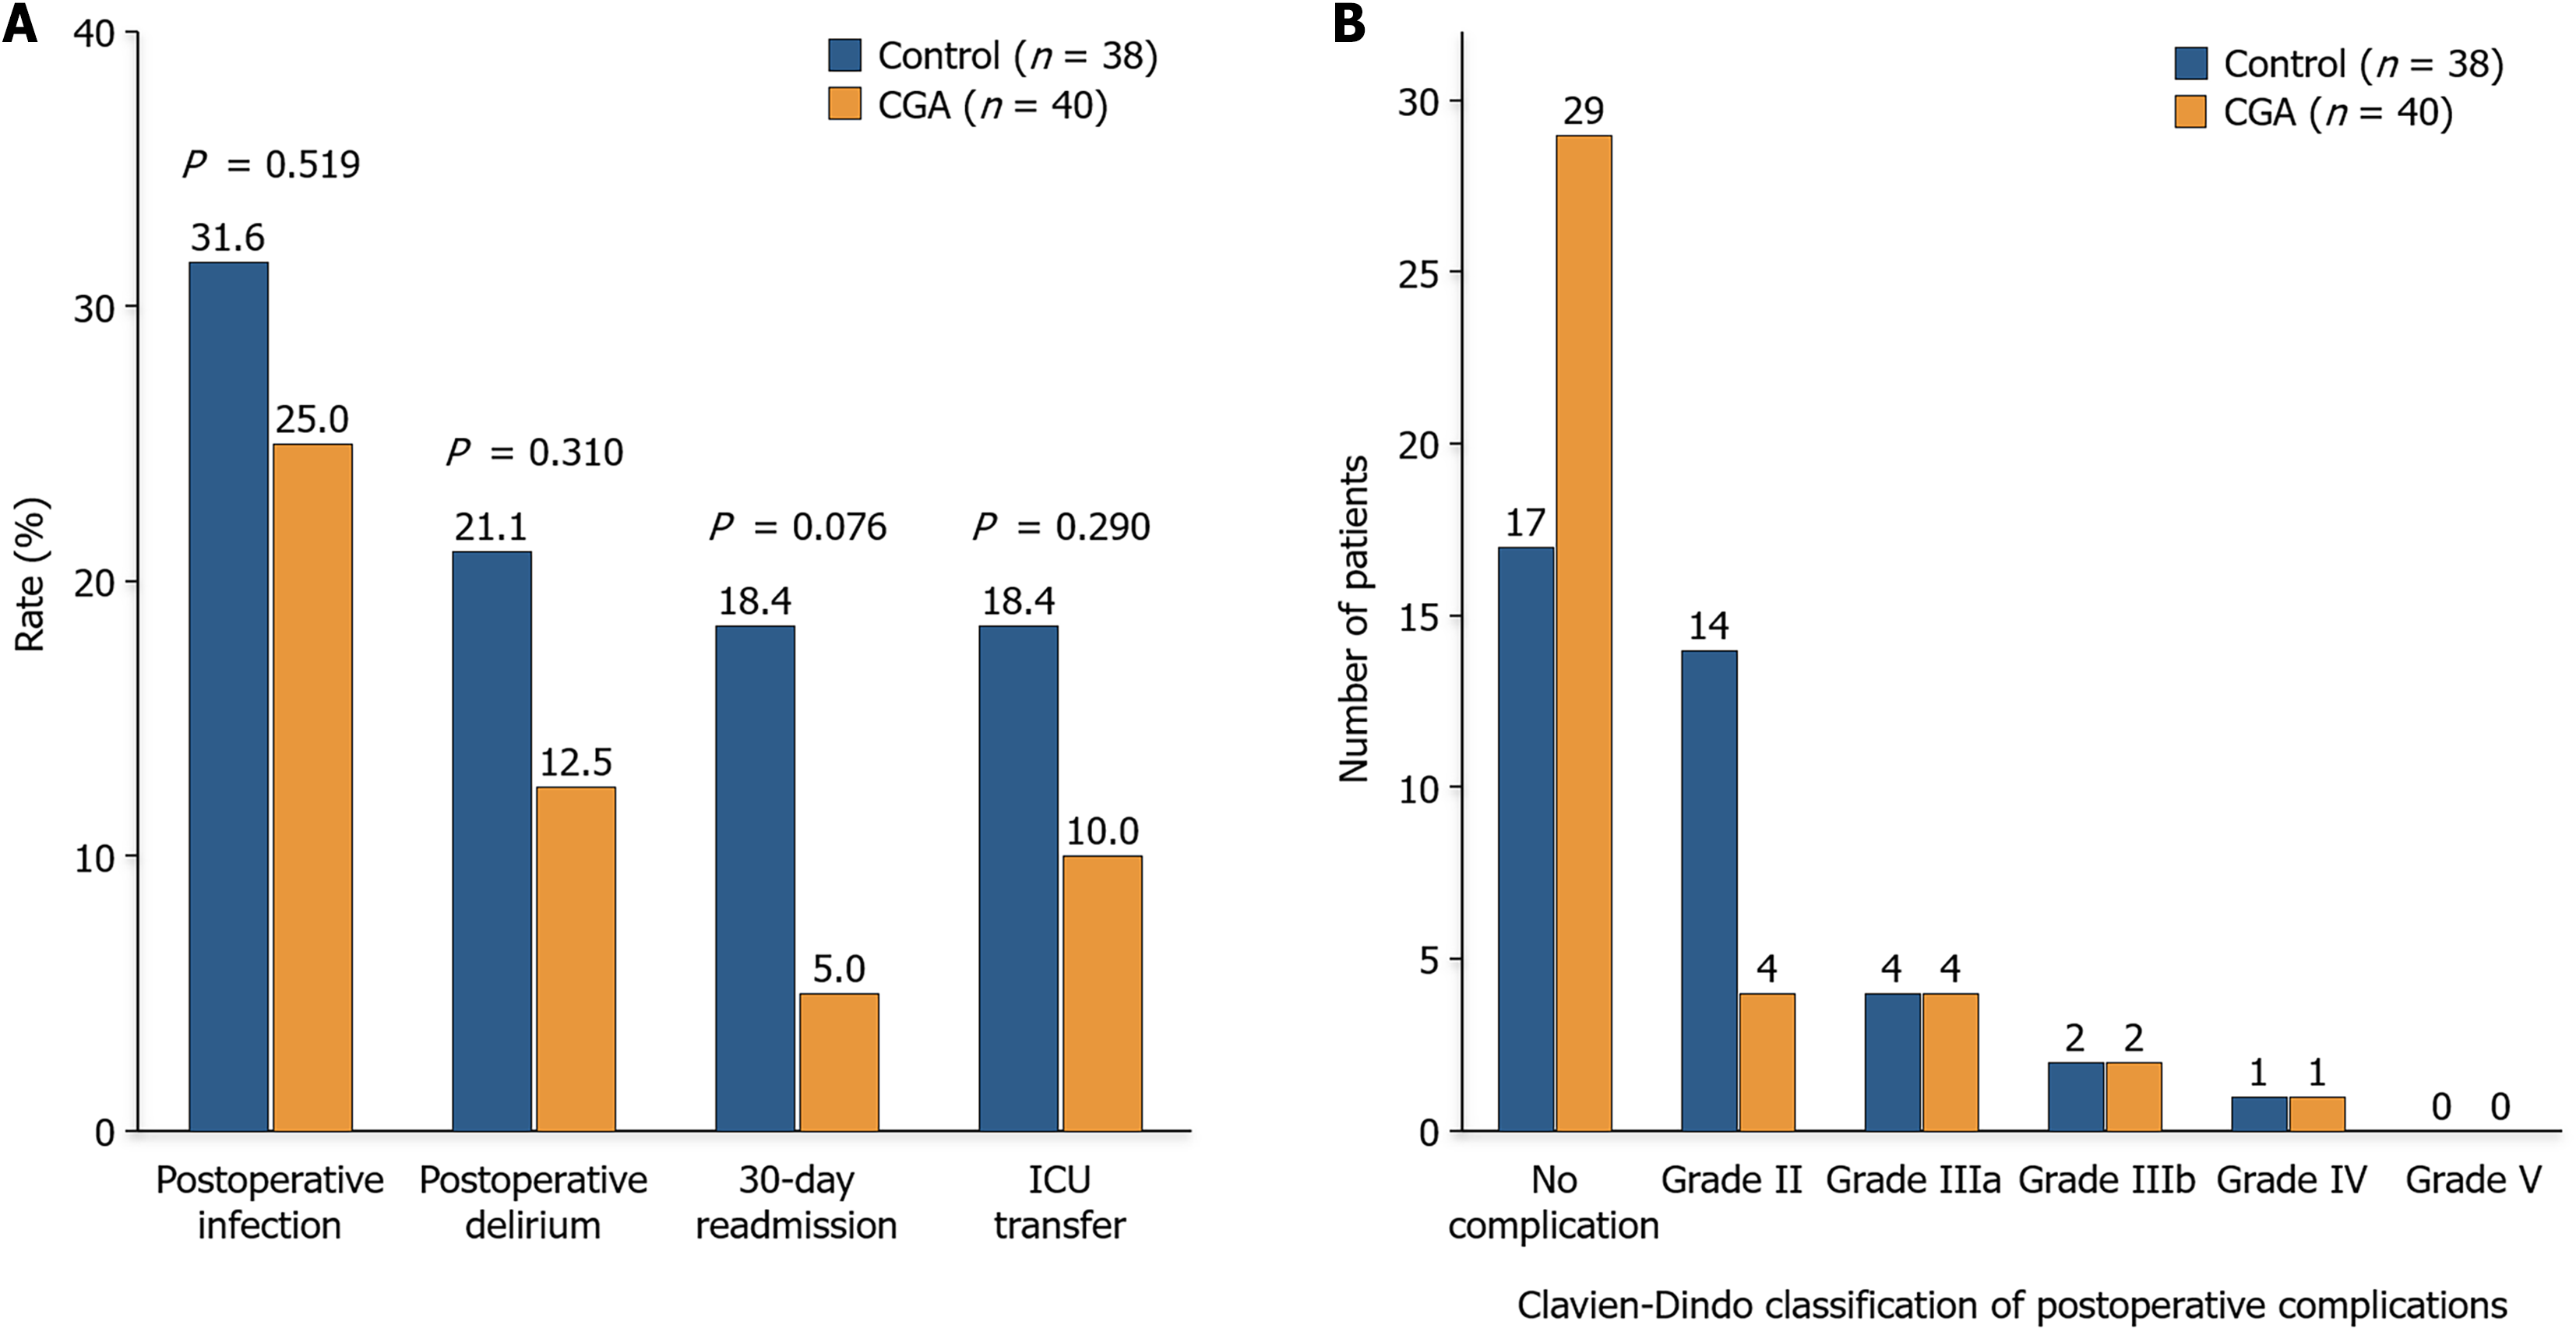
Figure 3 Secondary outcomes and complication severity.
A: Secondary outcomes comparison (infection 31.6% vs 25.0%; delirium 21.1% vs 12.5%; 30-day readmission 18.4% vs 5.0%; intensive care unit transfer 18.4% vs 10.0%); B: Complication distribution by Clavien-Dindo grade (control patients had more grade II complications, 14 patient’s vs 4 patients). CGA: Comprehensive geriatric assessment; ICU: Intensive care unit.
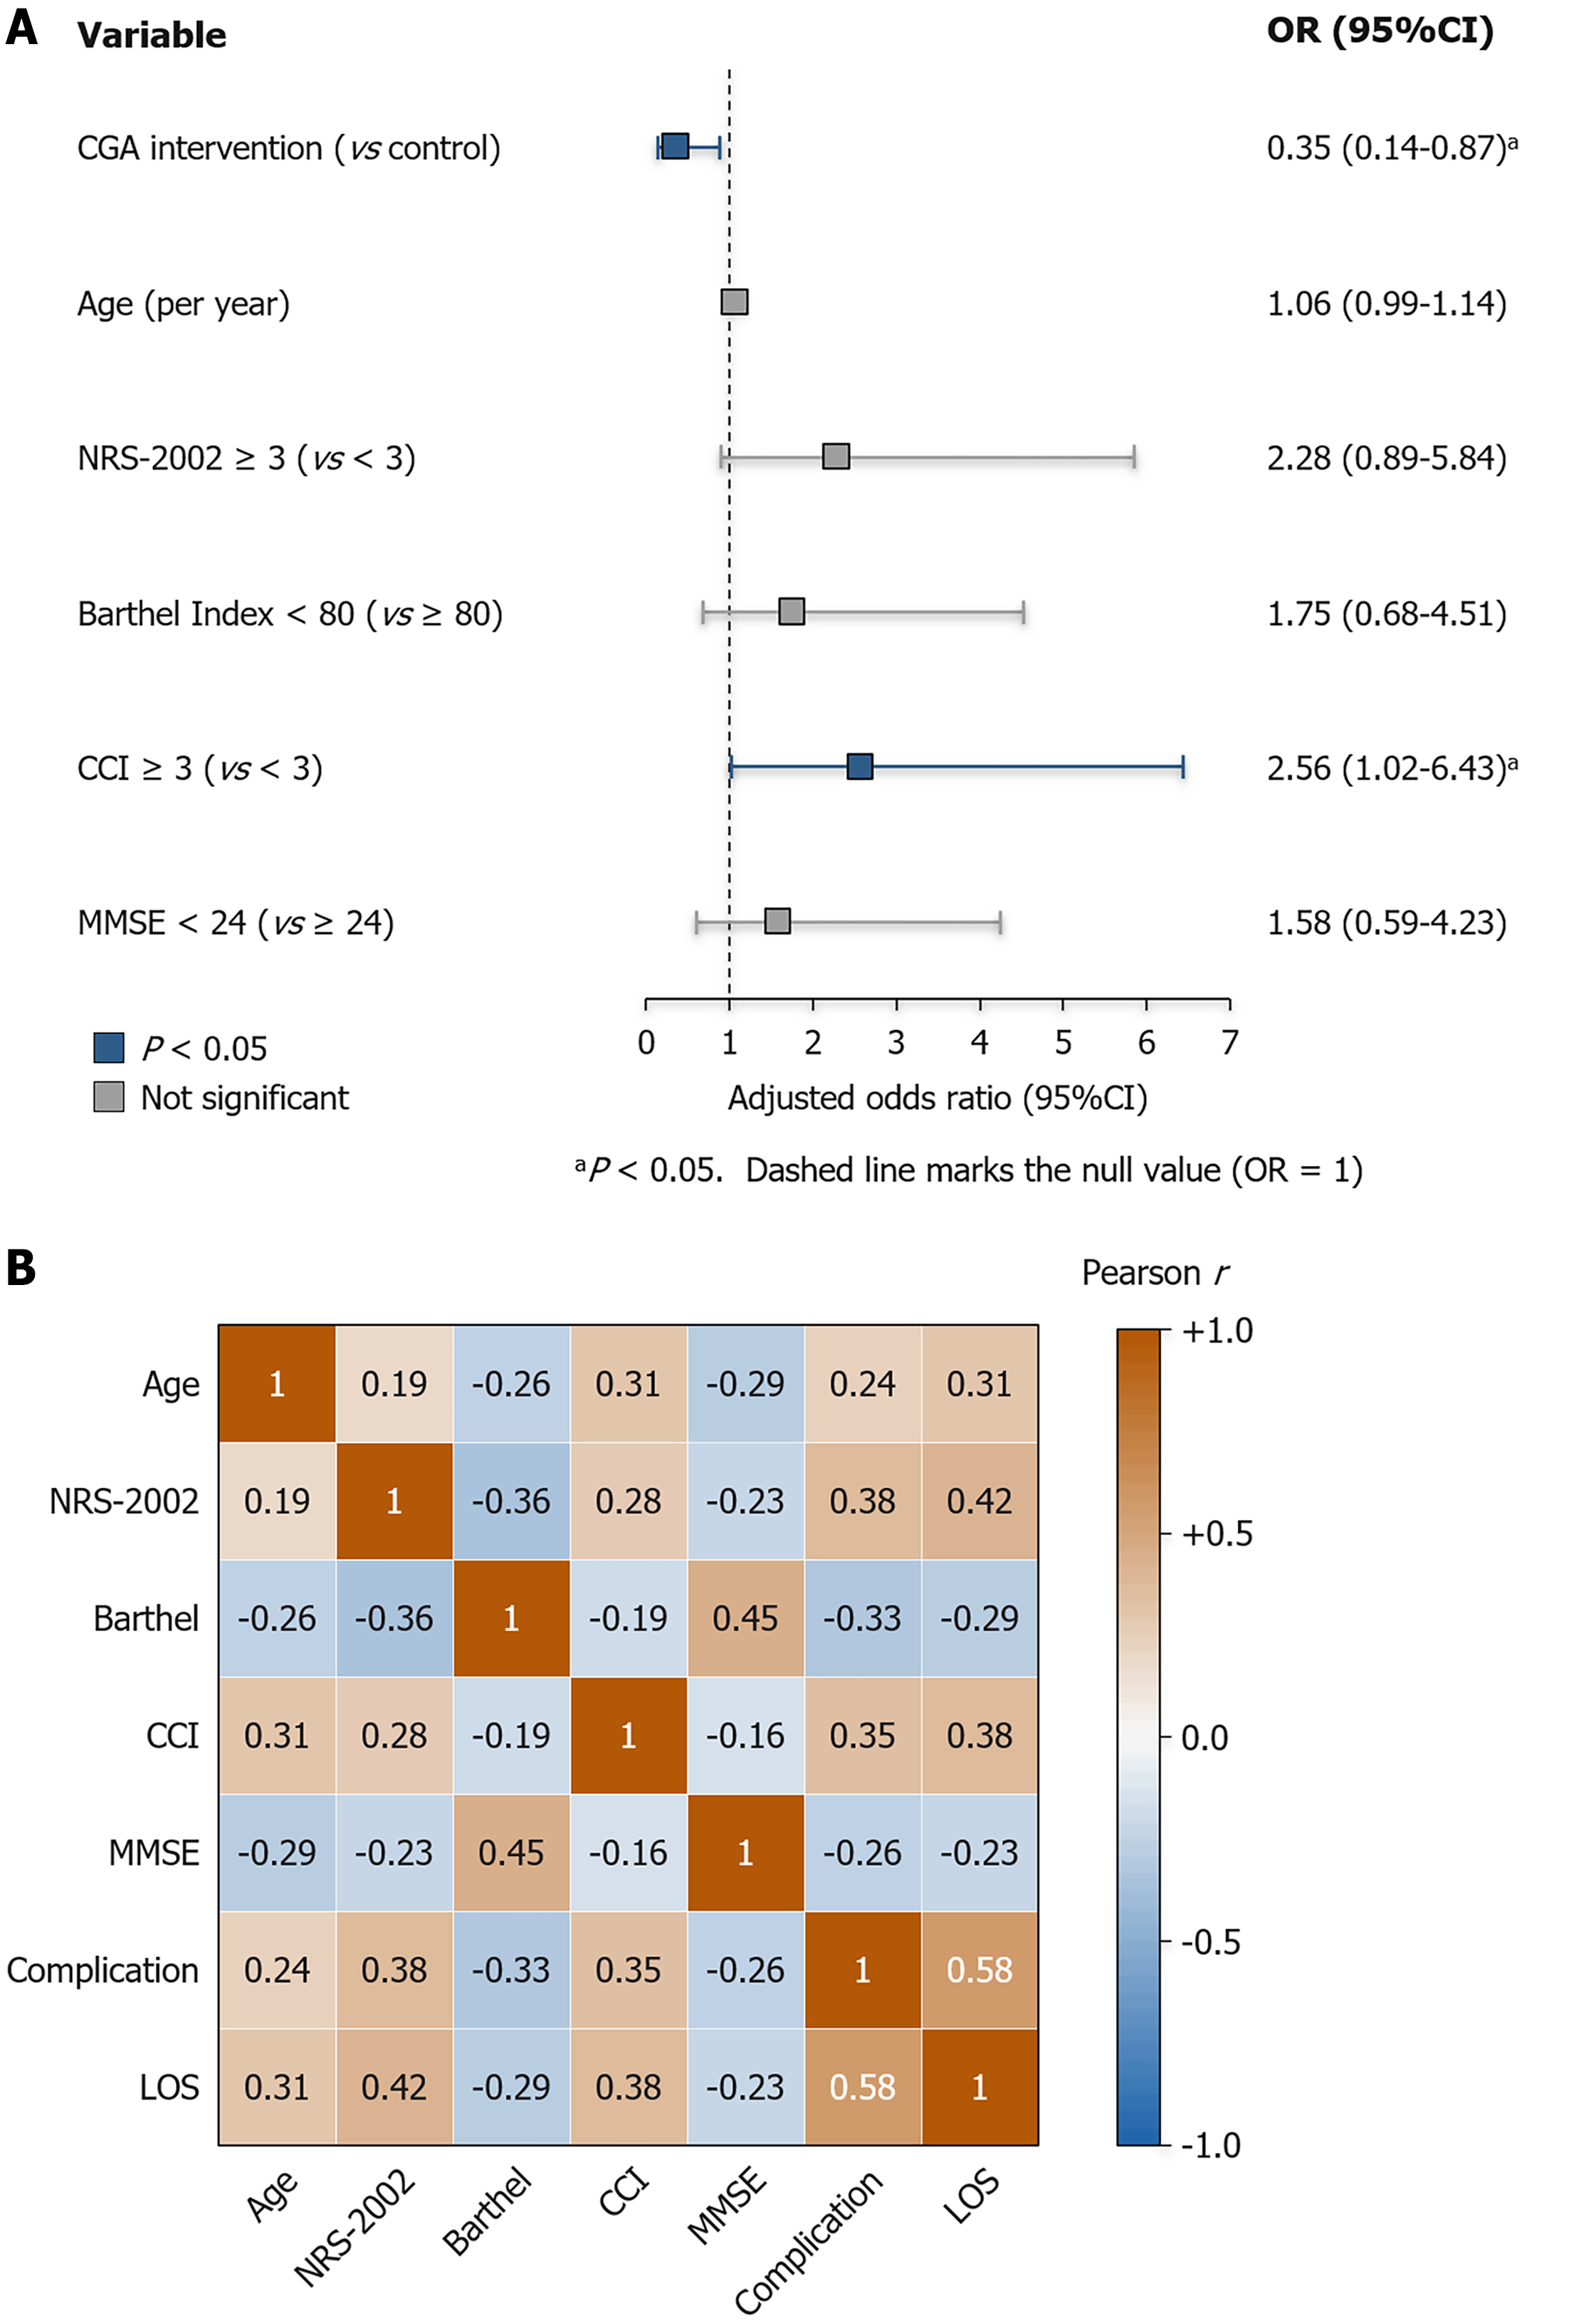
Figure 4 Multivariable analysis.
A: Forest plot of the multivariate logistic regression for postoperative complications, blue squares indicate statistically significant associations (P < 0.05); B: Correlation matrix of study variables; complications and length of stay showed a strong positive correlation (r = 0.58). aP < 0.05. CGA: Comprehensive geriatric assessment; CCI: Charlson Comorbidity Index; NRS-2002: Nutritional Risk Screening 2002; MMSE: Mini-Mental State Examination; LOS: Length of hospital stay; CI: Confidence interval; OR: Odds ratio.
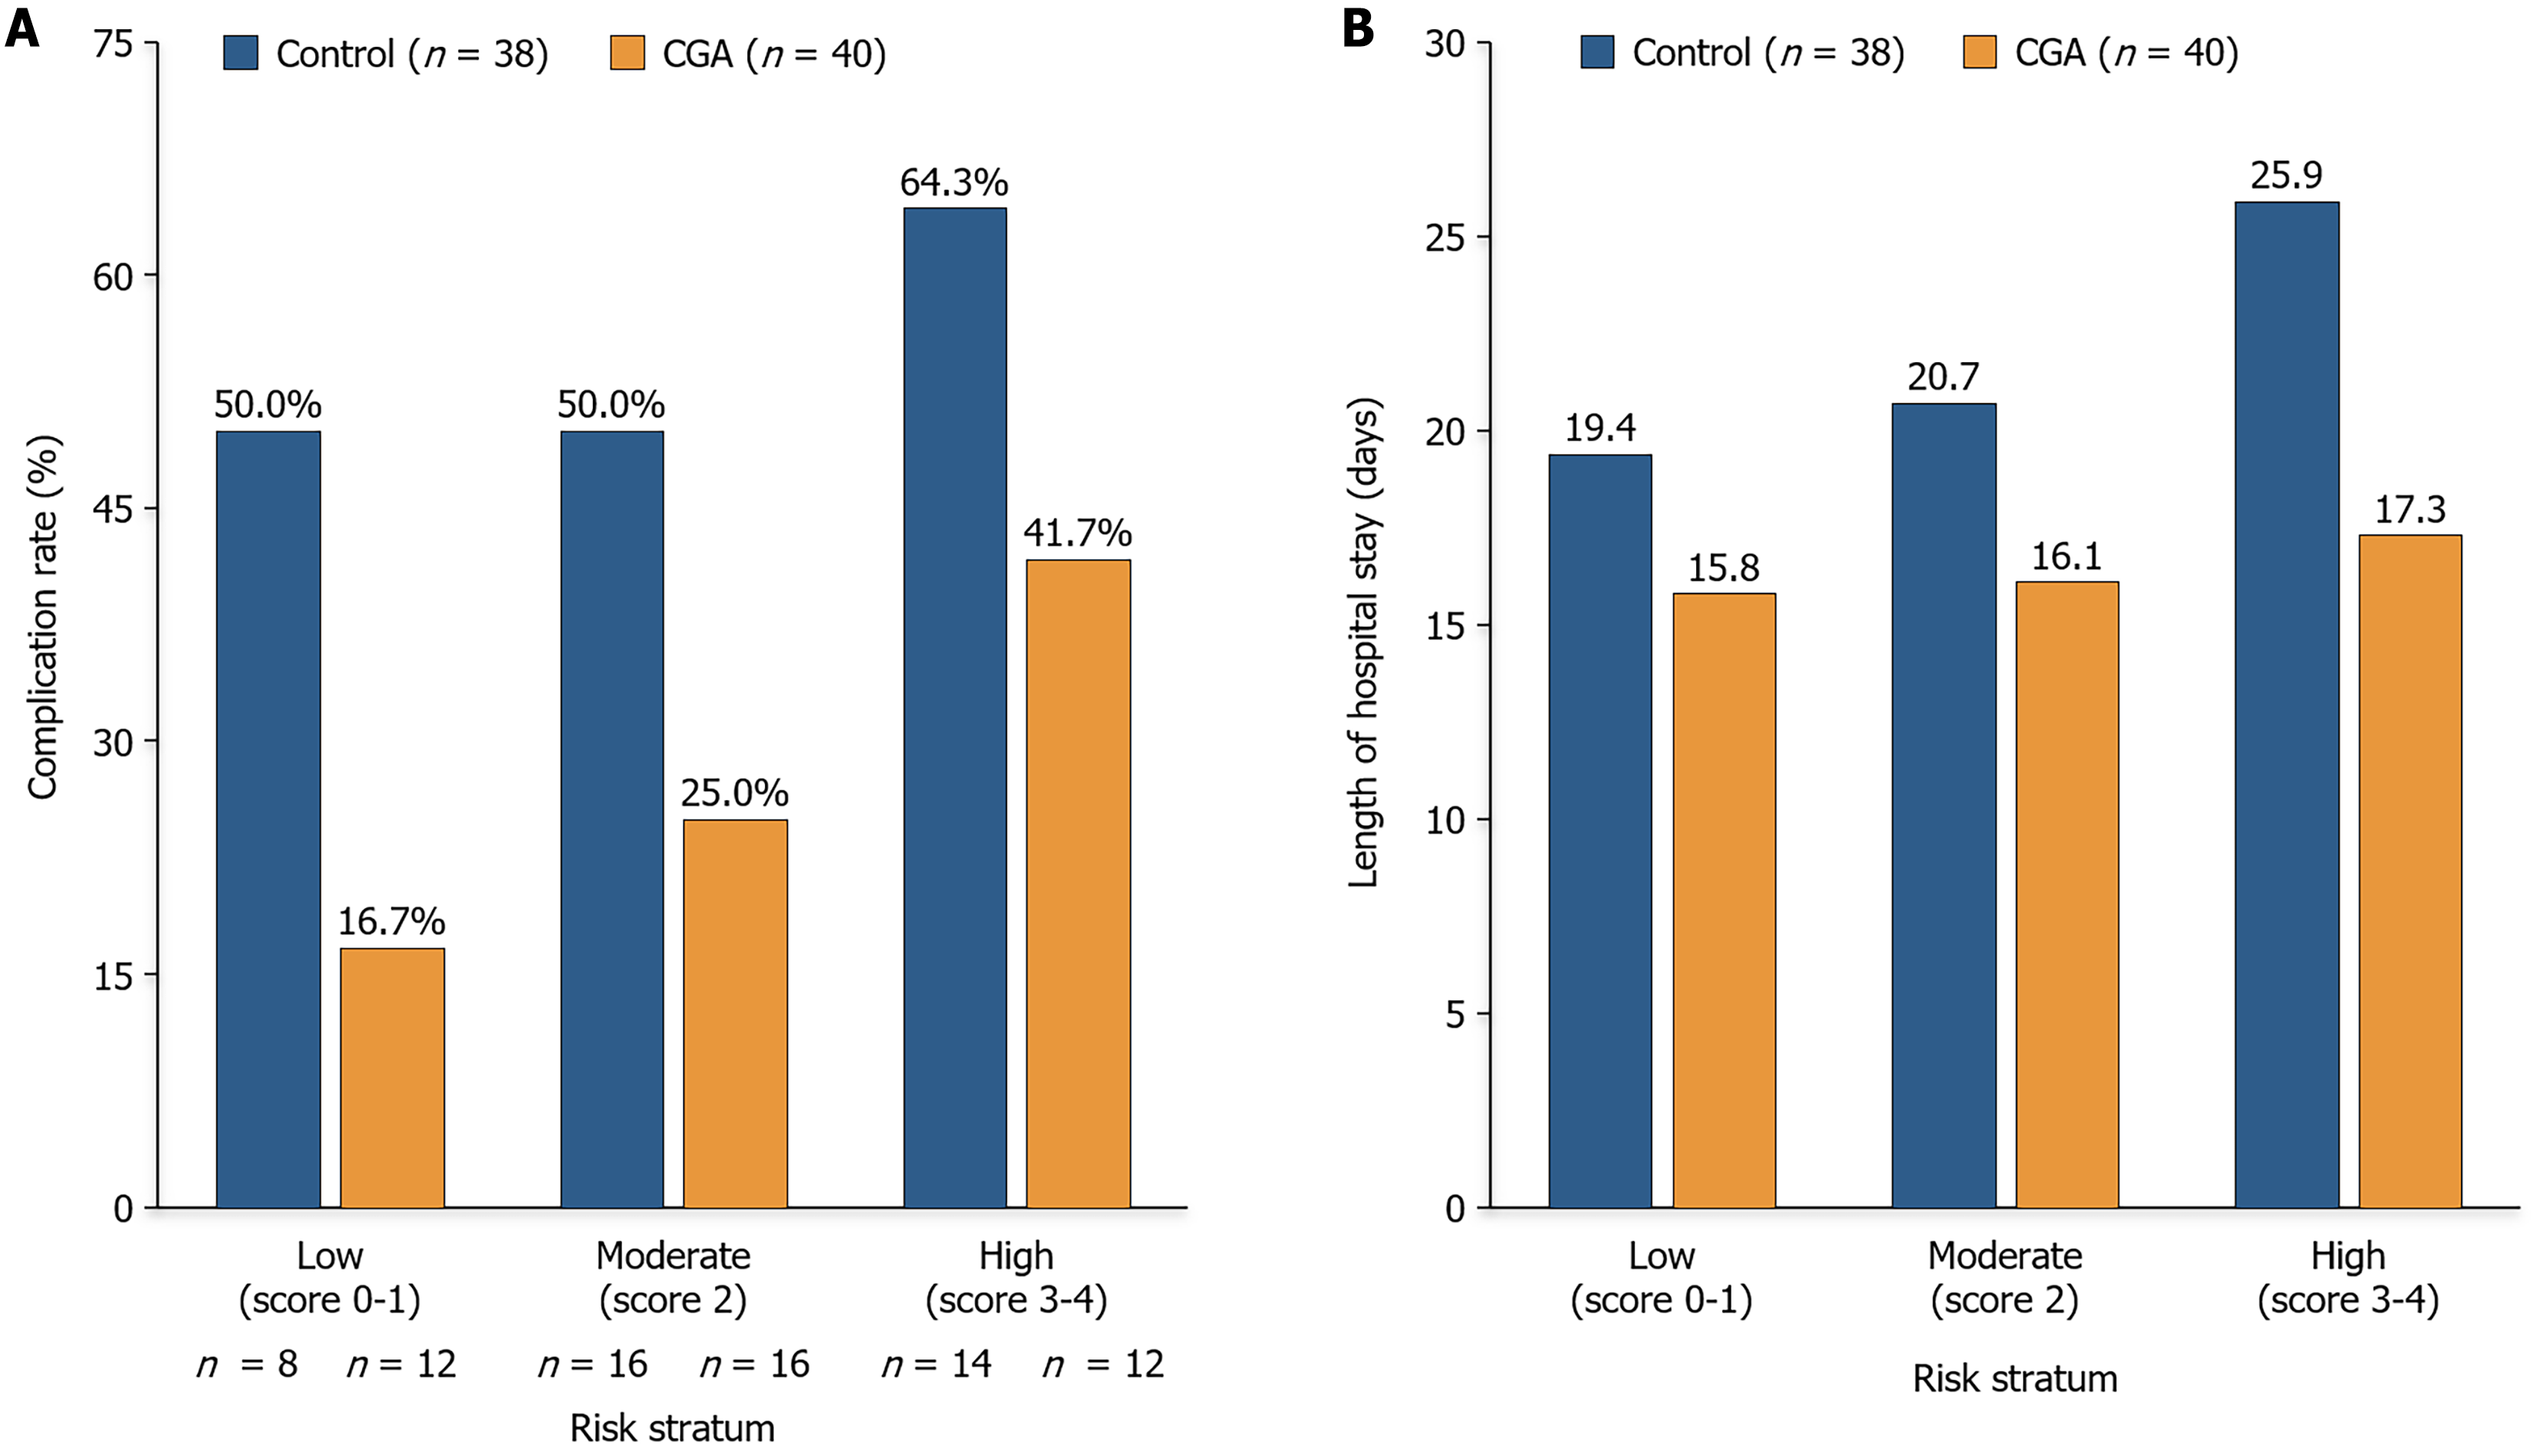
Figure 5 Comprehensive geriatric assessment intervention effects by risk stratification level.
A: Complication rates; B: Hospital length of stay. Sample sizes: Low-risk (n = 20), moderate-risk (n = 32), high-risk (n = 26). CGA: Comprehensive geriatric assessment.
- Citation: Dong ZX, Xie S, Xu J. Effects of comprehensive geriatric assessment-guided nursing interventions on postoperative complications/recovery in elderly patients undergoing gastrointestinal or hepatobiliary surgery. World J Gastrointest Surg 2026; 18(9): 120394
- URL: https://www.wjgnet.com/1948-9366/full/v18/i9/120394.htm
- DOI: https://dx.doi.org/10.4240/wjgs.120394