
















Copyright: ©Author(s) 2026.
World J Gastrointest Surg. Sep 27, 2026; 18(9): 119675
Published online Sep 27, 2026. doi: 10.4240/wjgs.119675
Published online Sep 27, 2026. doi: 10.4240/wjgs.119675
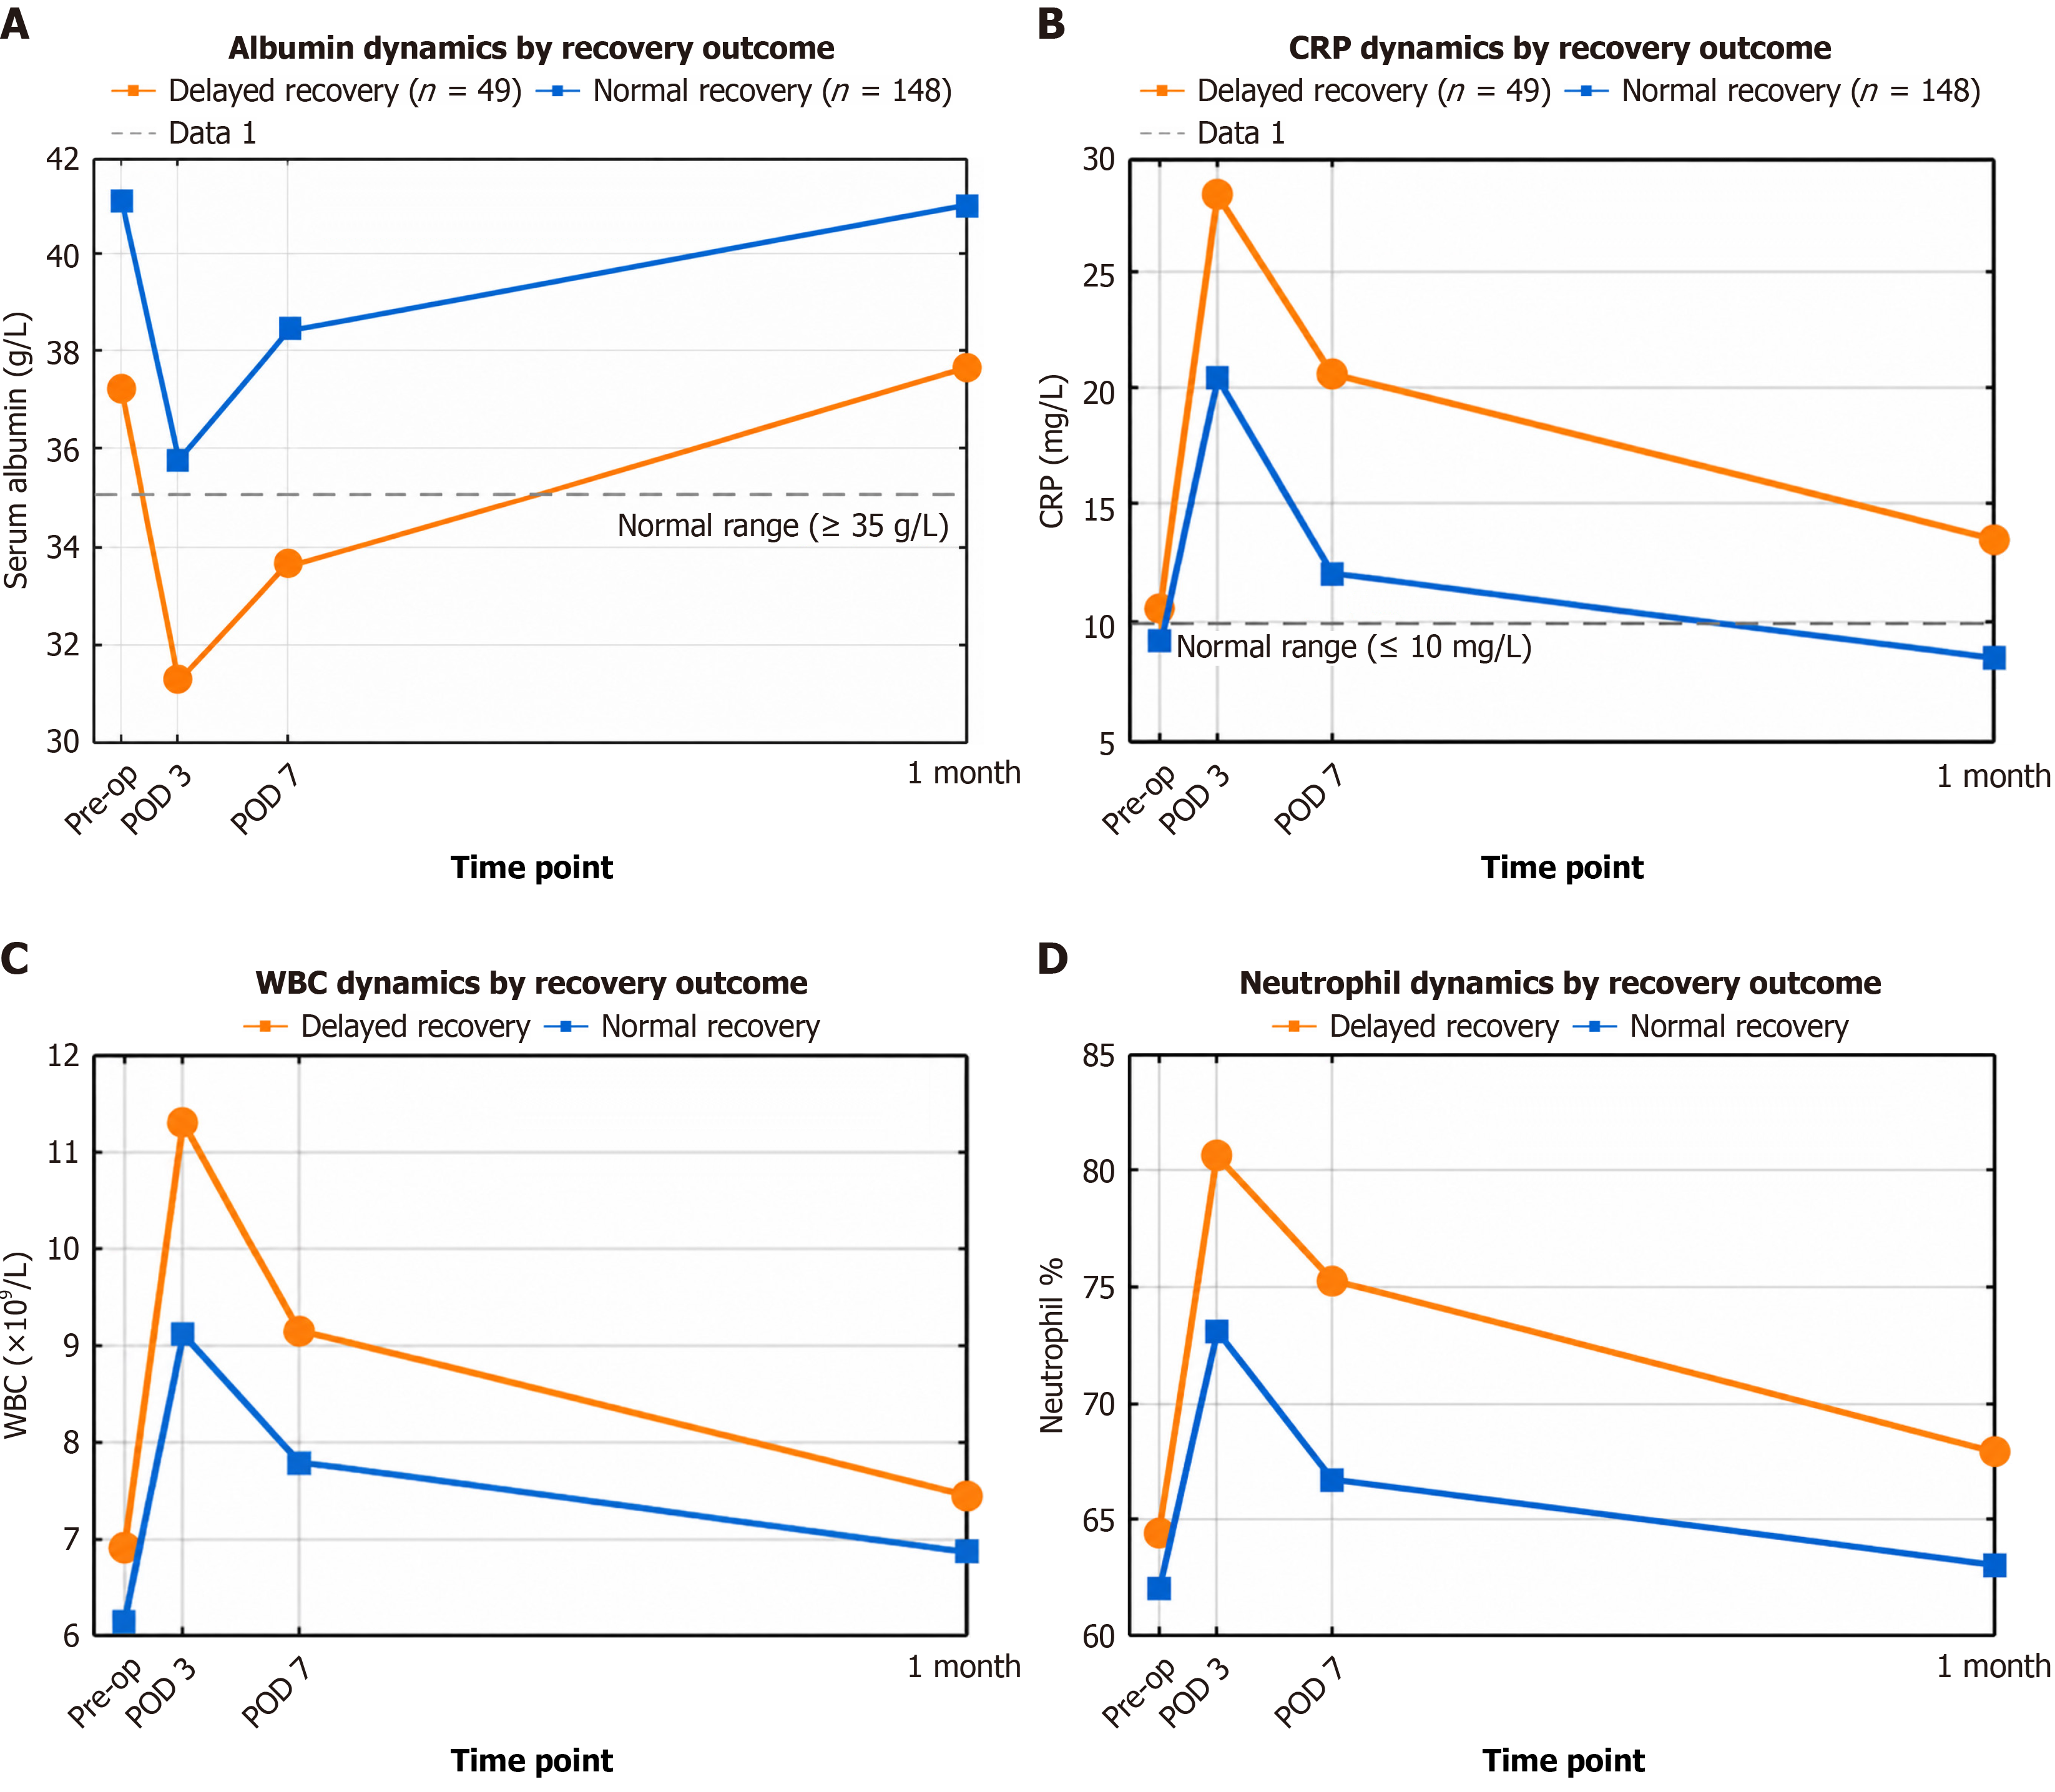
Figure 1 Dynamic inflammatory and nutritional trajectories by outcome groups.
A: Albumin dynamics by recovery outcome; B: C-reactive protein dynamics by recovery outcome; C: White blood cell dynamics by recovery outcome; D: Neutrophil dynamics by recovery outcome. WBC: White blood cell; CRP: C-reactive protein; POD: Postoperative day.
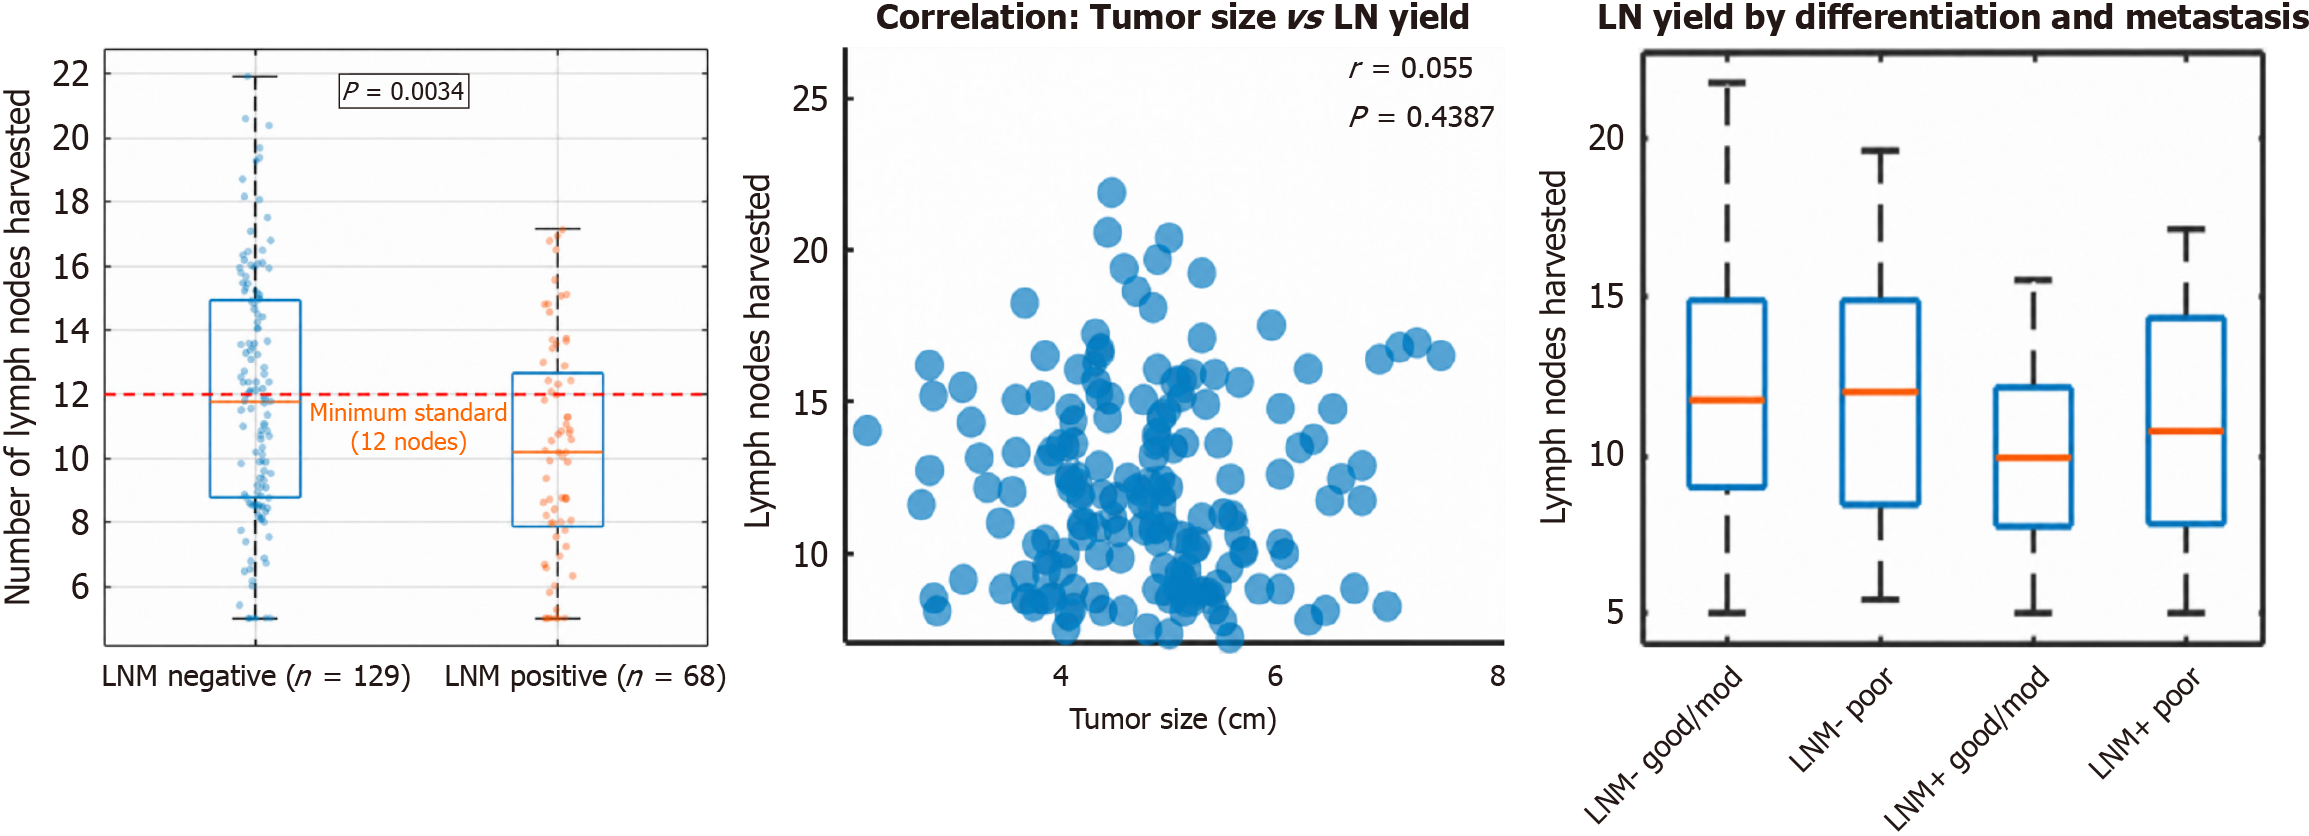
Figure 2 Analysis of lymph node yield and metastasis status.
LN: Lymph node; LNM: Lymph node metastasis.
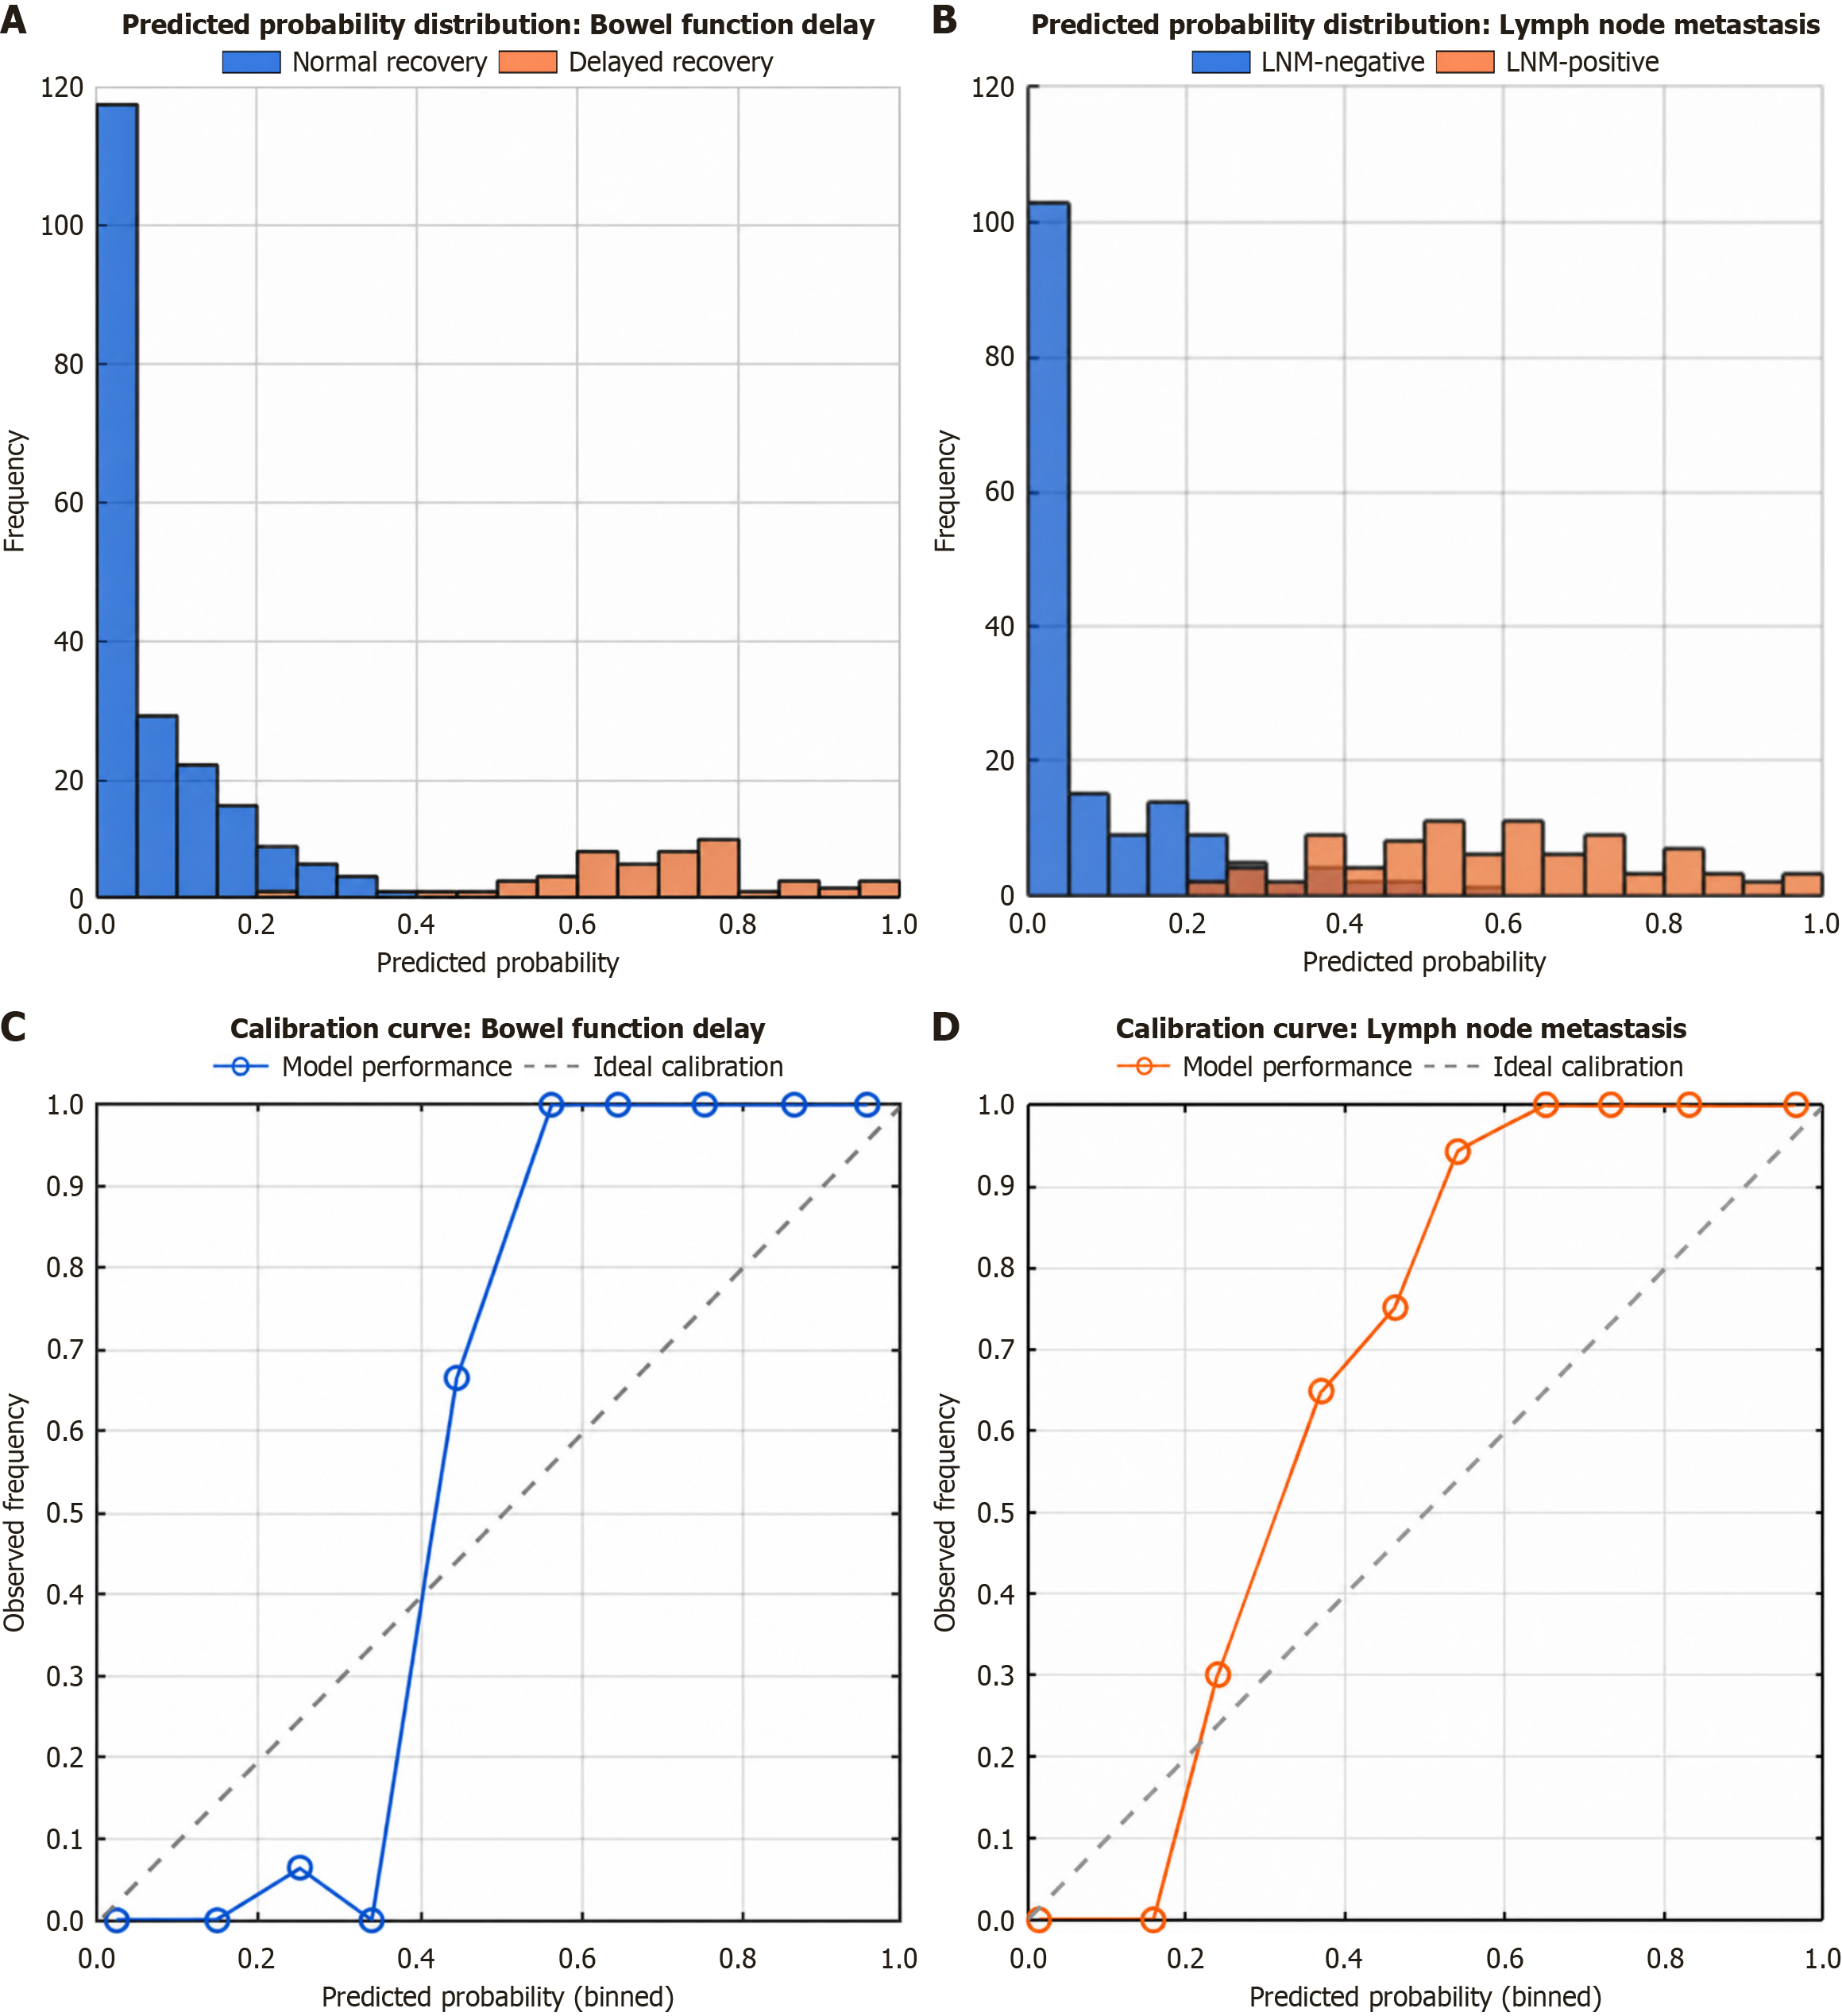
Figure 3 Performance of the multivariate logistic regression prediction models.
The P values from the Hosmer-Lemeshow test were greater than 0.05, indicating good model calibration for both outcomes. The area under the curve was 0.82 for the intestinal function model and 0.79 for the lymph node metastasis model. Calibration plots showing agreement between the predicted probabilities and actual observed outcomes. The dotted line represents the ideal fit (Figure 3C and D). Evaluation of models for predicting (Figure 3A and C) delayed intestinal function recovery and (Figure 3B and D) lymph node metastasis. A: Predicted probability distribution: Bowel function delay; B: Predicted probability distribution: Lymph node metastasis; C: Calibration curve: Bowel function delay; D: Calibration curve: Lymph node metastasis.
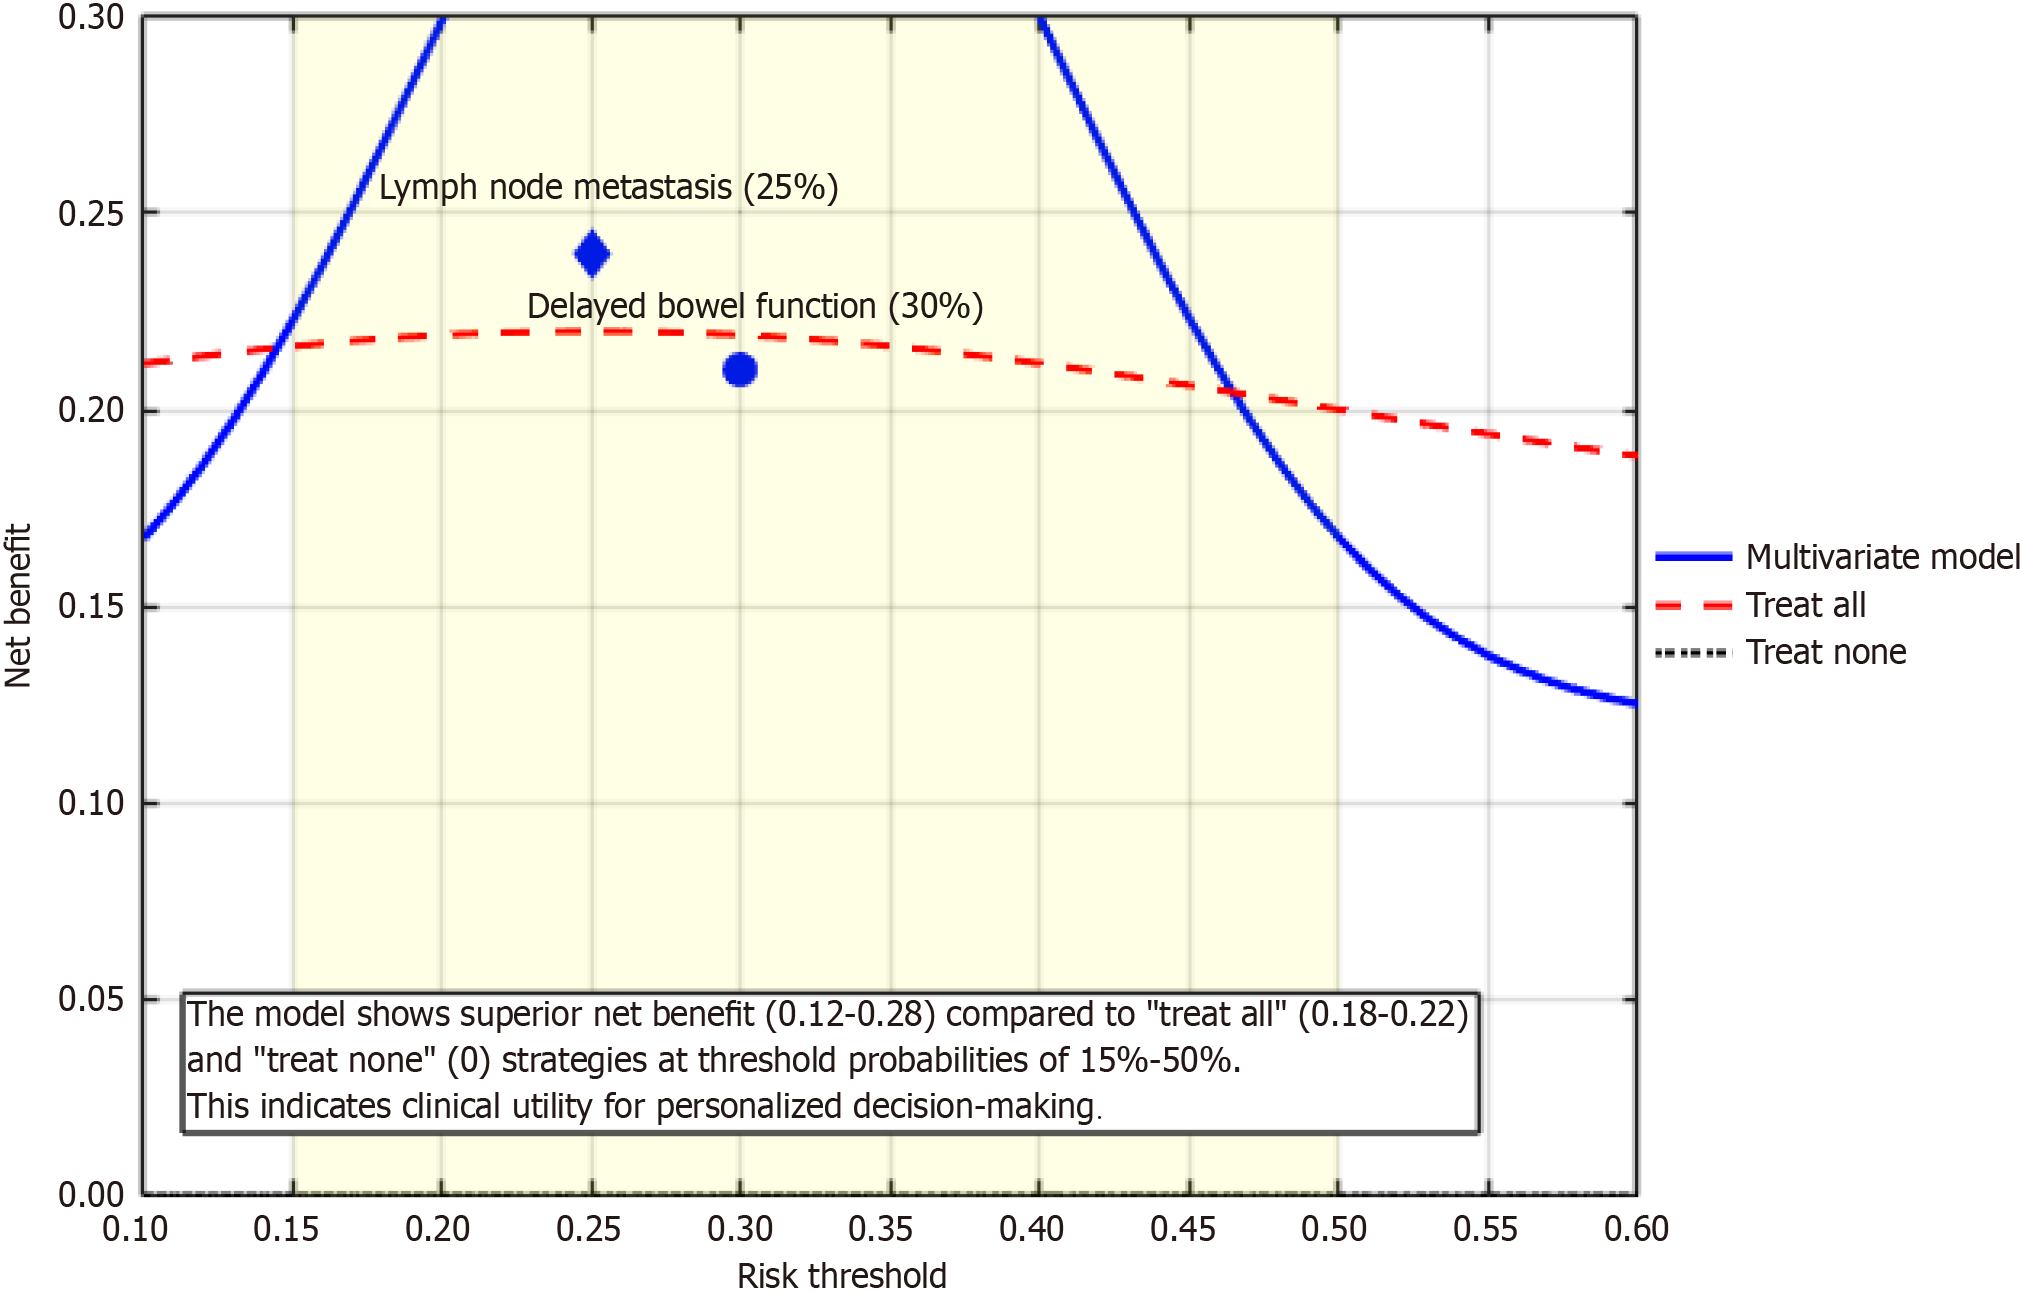
Figure 4
Decision curve analysis.
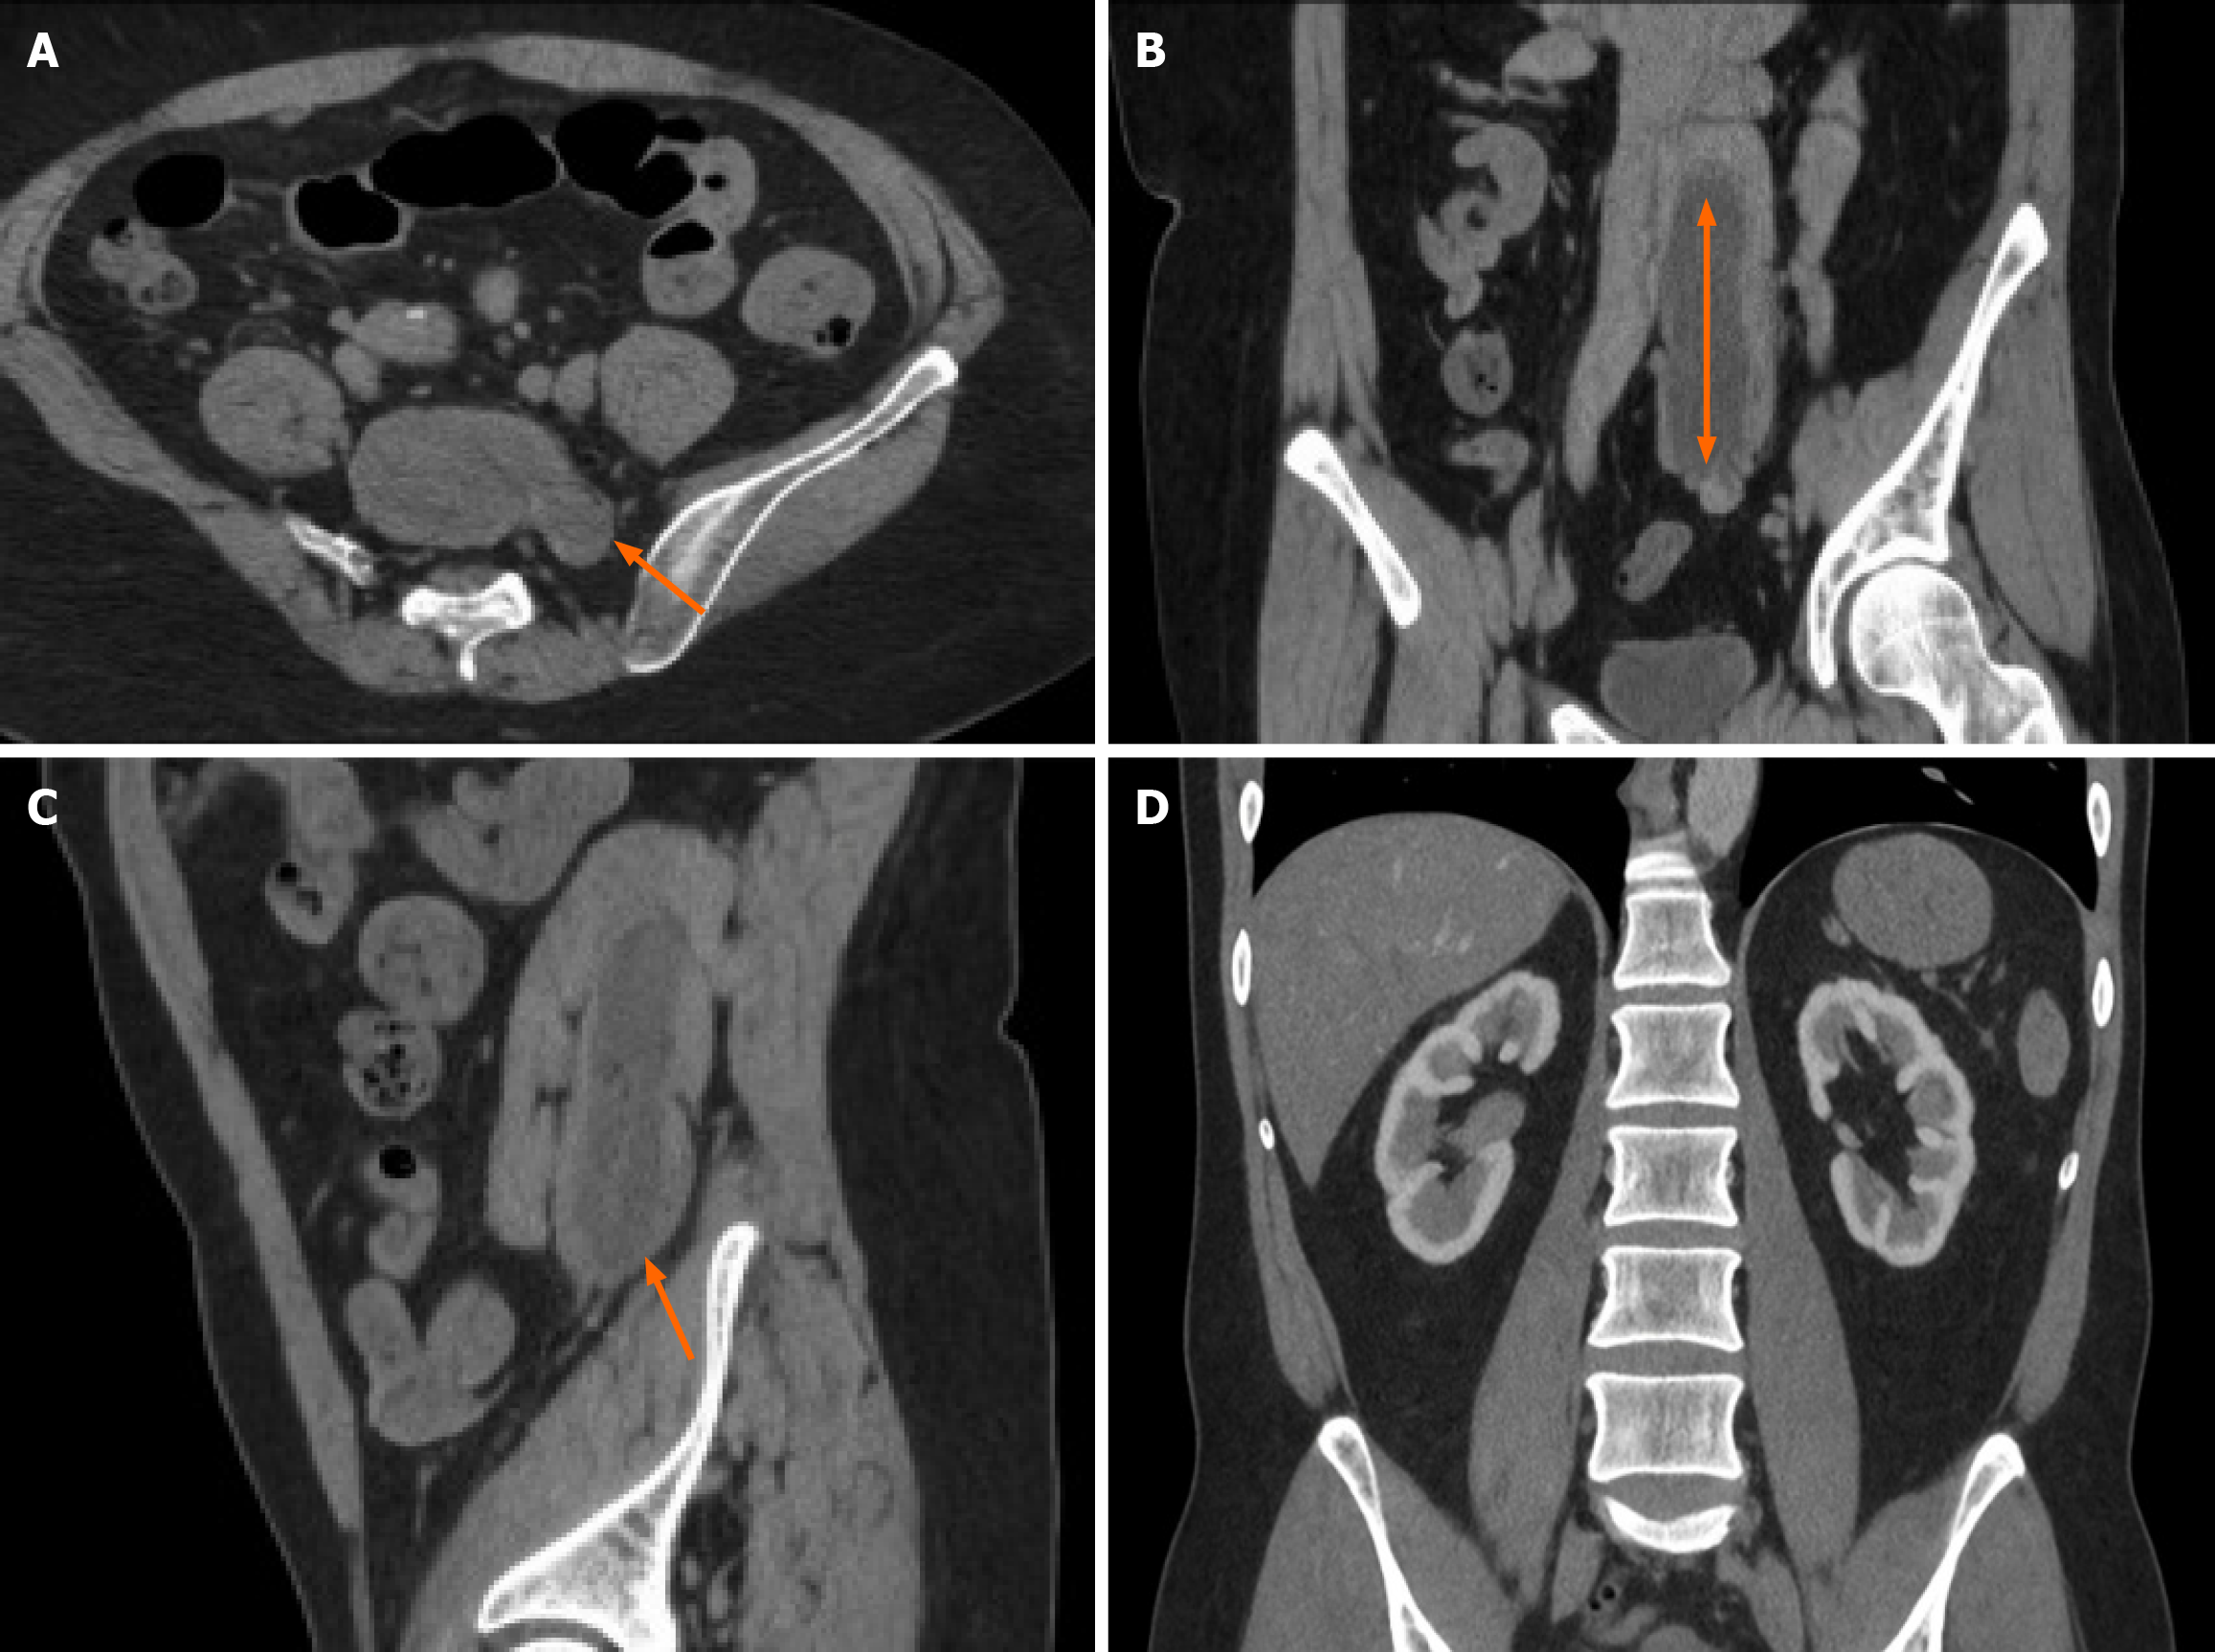
Figure 5 Typical preoperative computed tomography imaging findings in a patient from the study cohort.
These images illustrate the common tumor characteristics integral to the prediction models. A: Axial contrast-enhanced computed tomography image showing irregular sigmoid colon wall thickening (arrow) with a maximum thickness of approximately 8.2 mm, consistent with a T3 stage tumor (penetrating the muscularis propria); B: Coronal reconstructed image demonstrating the craniocaudal extent of the tumor measuring approximately 4.6 cm (double-headed arrow); C: The sagittal image clearly depicts the relationship between the tumor and adjacent structures; the presence of preserved fat planes suggests no invasion of the surrounding organs; D: Coronal enhancement image showing homogeneous enhancement of the tumor with no evidence of distant metastasis. These features (T stage and tumor size) were key variables in the multivariate analysis.
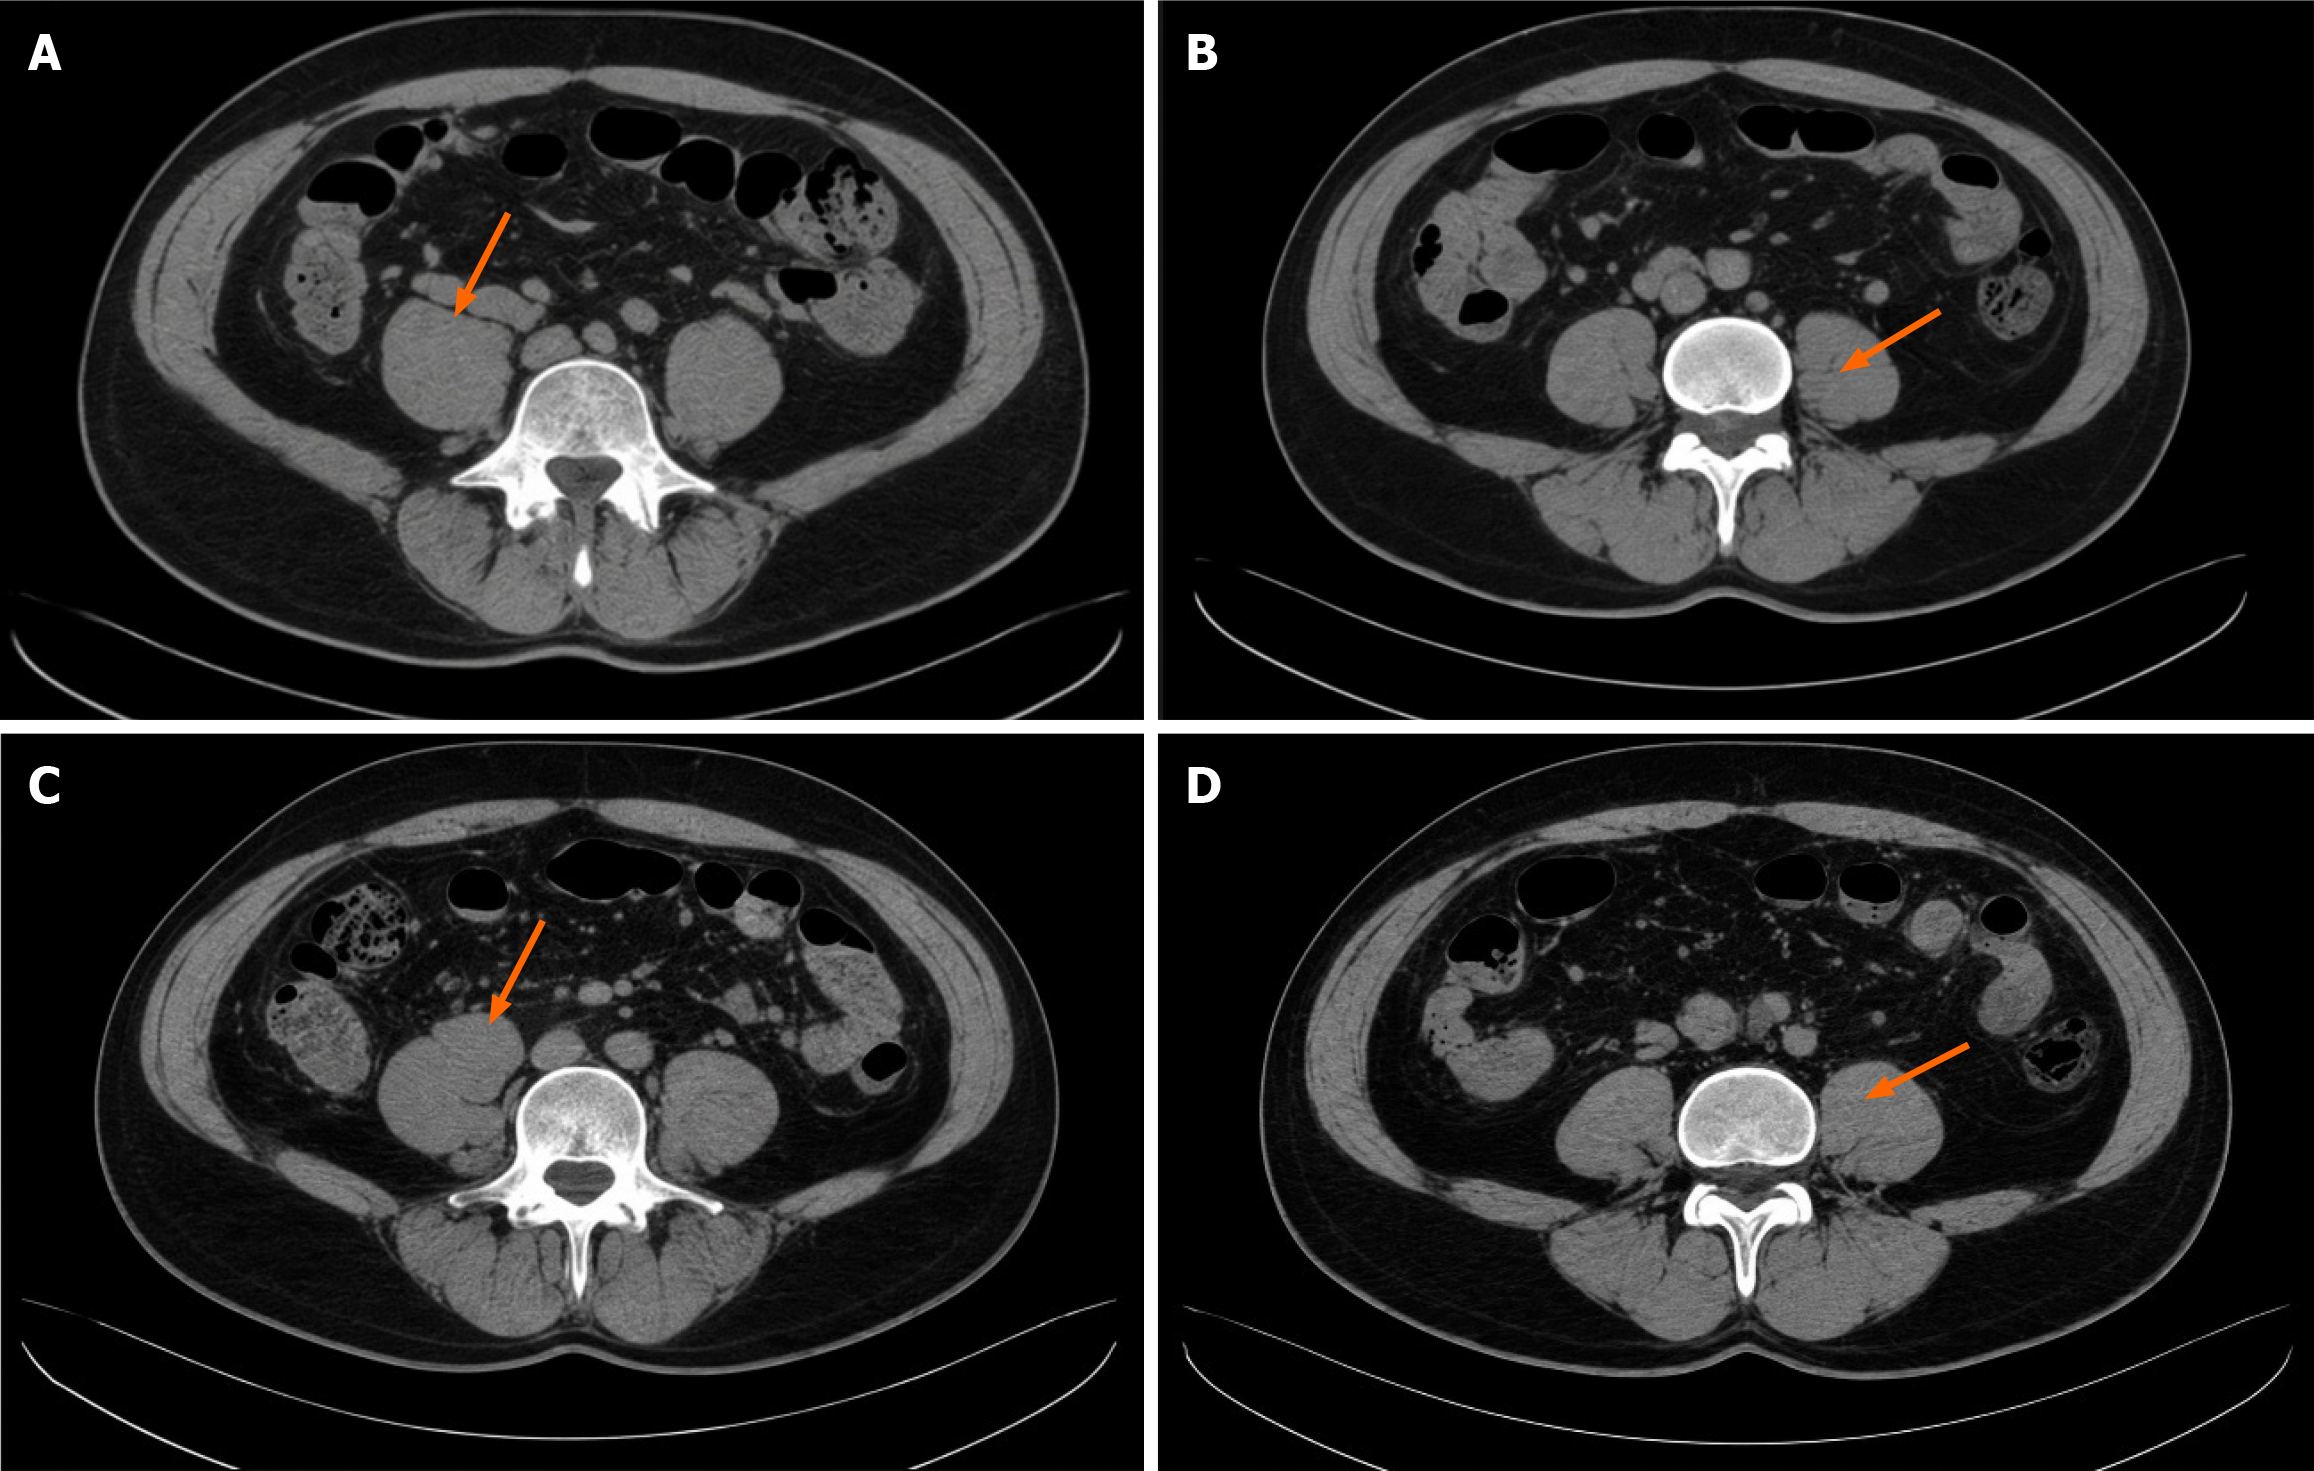
Figure 6 Representative imaging comparisons highlighting features associated with different outcomes.
This figure compares patients with divergent postoperative outcomes, underscoring the imaging basis for risk stratification. A: Preoperative computed tomography (CT) image of a patient who subsequently developed delayed intestinal function recovery, showing T3N1M0 rectal cancer (arrow). The patient had preoperative hypoalbuminemia and significant intraoperative blood loss; B: Preoperative CT image of a patient with uncomplicated normal recovery of intestinal function showing T2N0M0 colon cancer (arrow). The patient had normal preoperative albumin levels and minimal blood loss; C: Preoperative CT image of a patient in the lymph node metastasis-positive group showing a bulky, poorly differentiated T4aN2 tumor (arrow) with extramural vascular invasion; D: Preoperative CT image of a patient from the lymph node metastasis-negative group showing a well-demarcated T3N0 tumor (arrow). The contrasting features of tumor stage, size, and morphology between these pairs visually represent the risk profiles identified by the prediction models.
- Citation: Qiang JH, Cheng J, Meng F, Zhang SQ. Application of multivariate logistic regression in predicting postoperative intestinal function recovery and lymph node metastasis in colorectal cancer. World J Gastrointest Surg 2026; 18(9): 119675
- URL: https://www.wjgnet.com/1948-9366/full/v18/i9/119675.htm
- DOI: https://dx.doi.org/10.4240/wjgs.119675