
















Copyright: ©Author(s) 2026.
World J Gastrointest Surg. Sep 27, 2026; 18(9): 119666
Published online Sep 27, 2026. doi: 10.4240/wjgs.119666
Published online Sep 27, 2026. doi: 10.4240/wjgs.119666
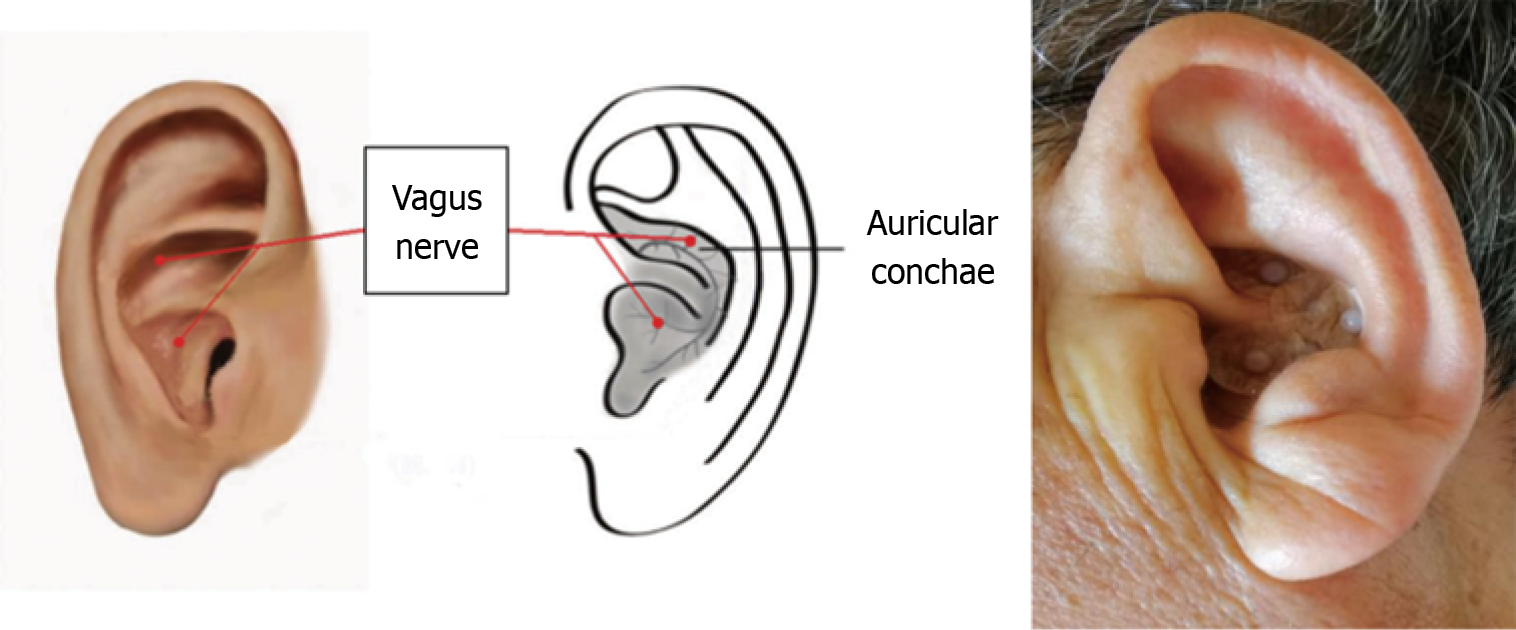
Figure 1
Schematic diagram of treatment.
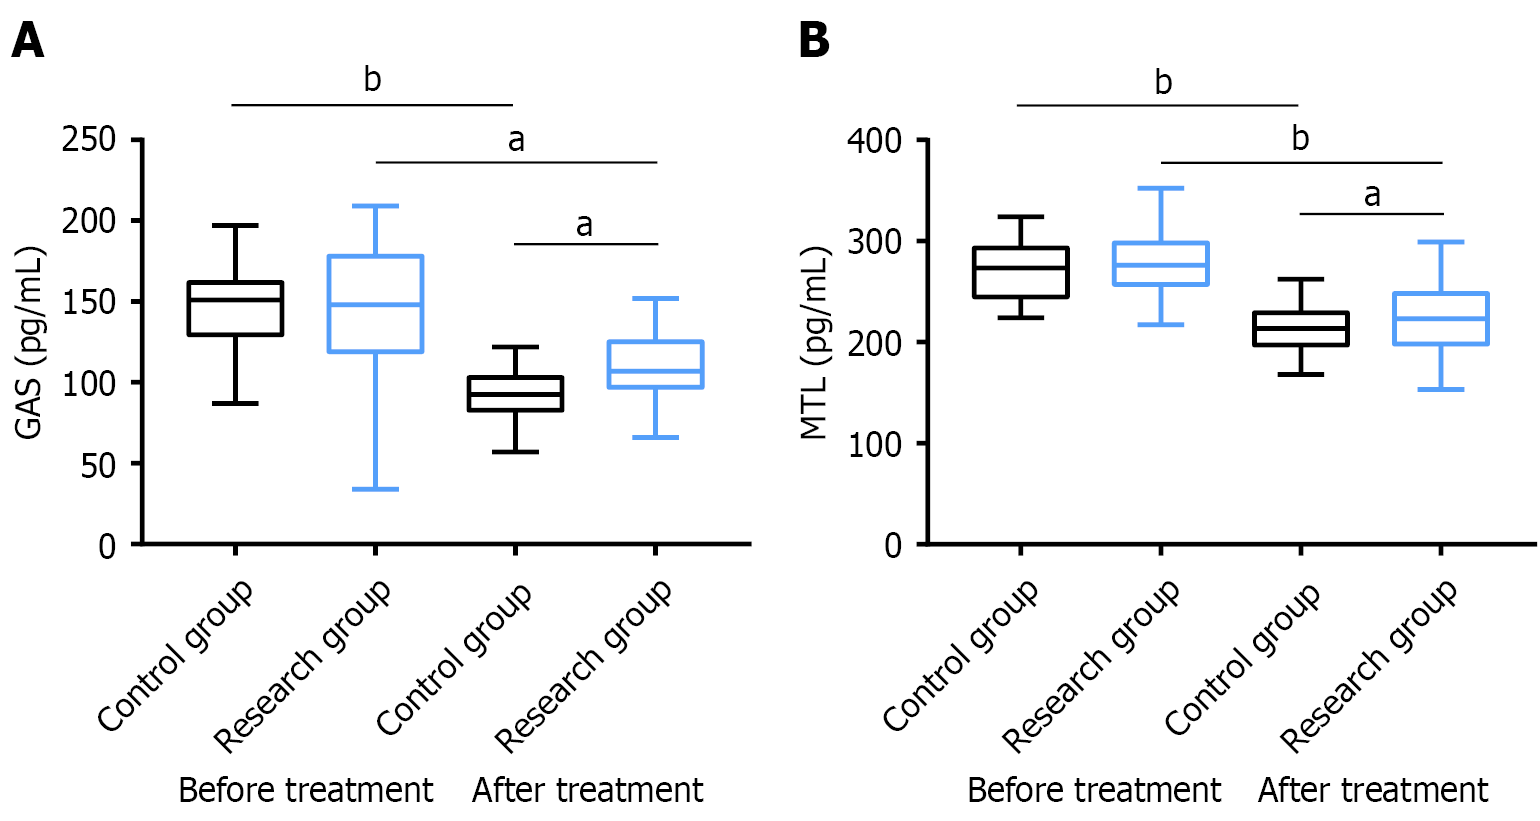
Figure 2 Gastrointestinal hormones.
A: Comparison of changes in gastrin; B: Comparison of changes in motilin. aP < 0.05, bP < 0.01 vs groups. GAS: Gastrin; MTL: Motilin.
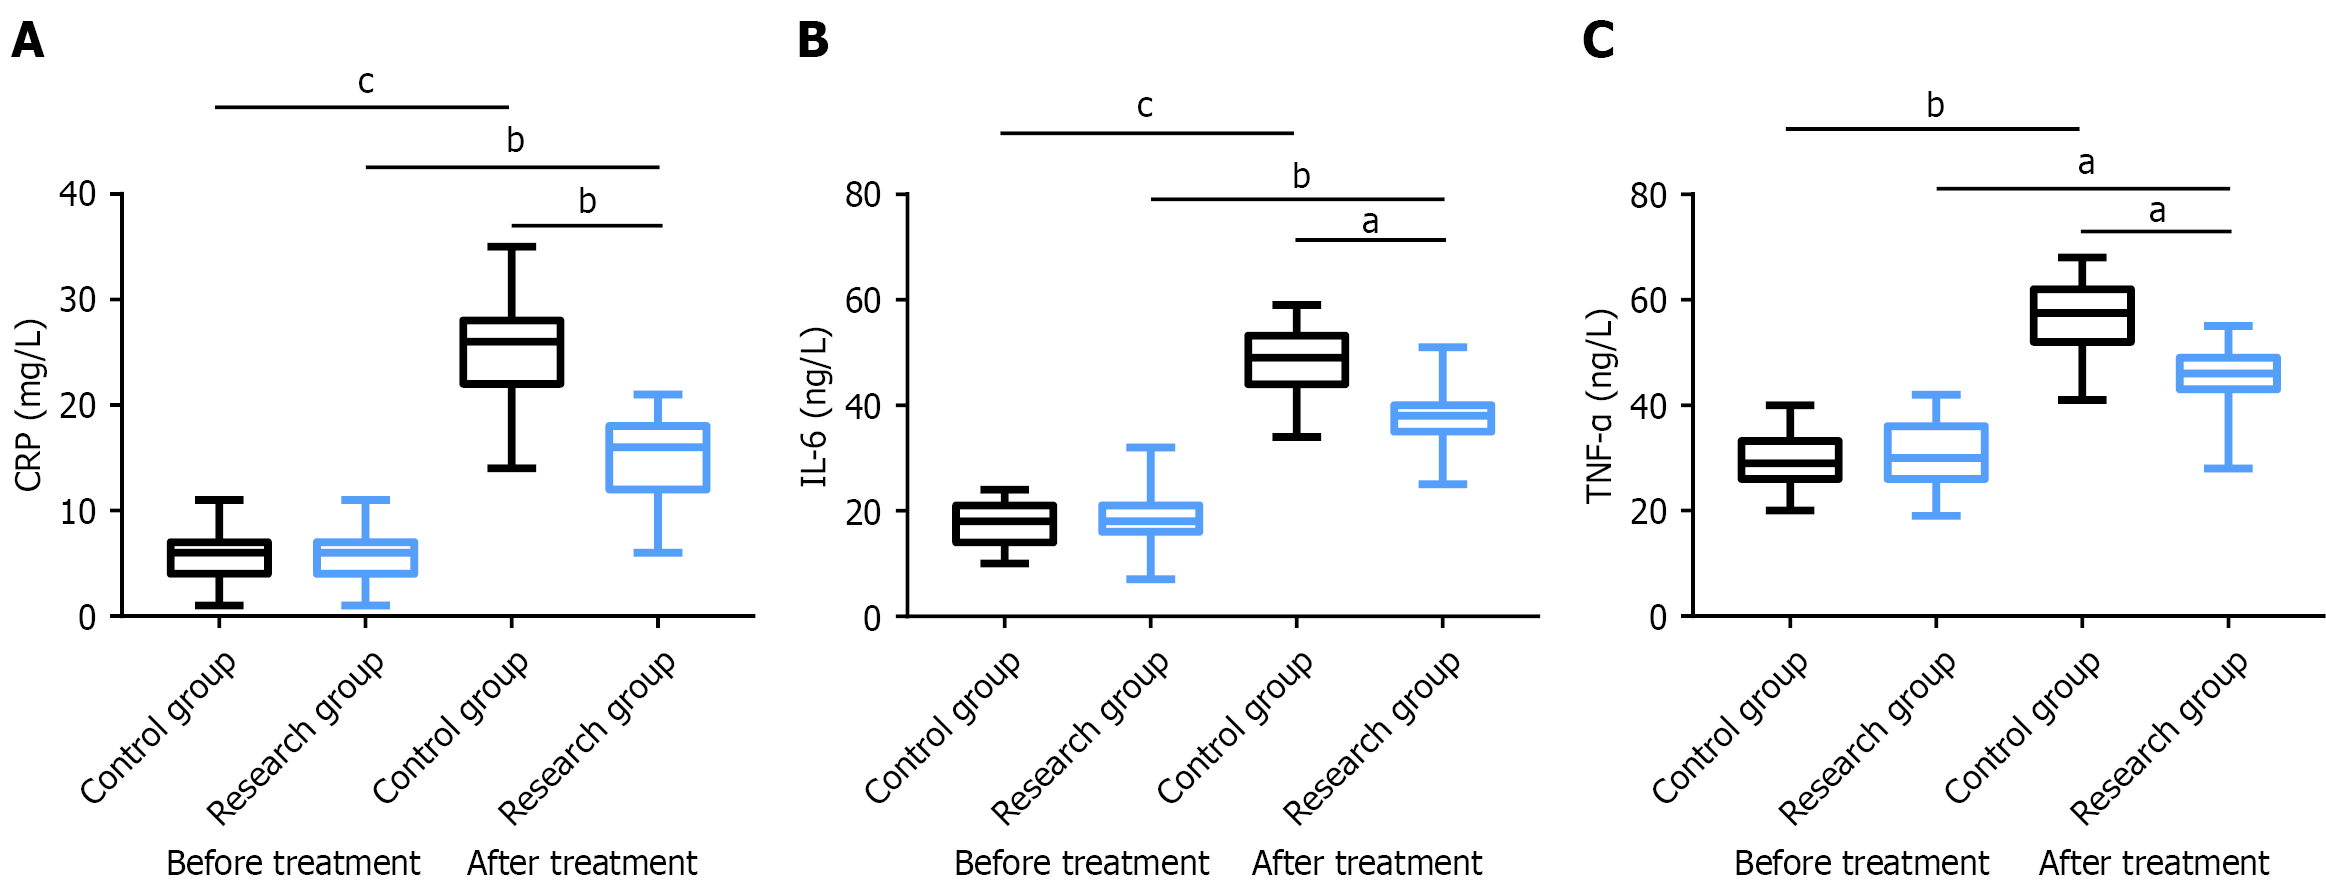
Figure 3 Serum inflammatory markers.
A: Comparison of changes in C-reactive protein; B: Comparison of changes in interleukin-6; C: Comparison of changes in tumor necrosis factor-α. aP < 0.05, bP < 0.01, cP < 0.001 vs groups. CRP: C-reactive protein; IL-6: Interleukin-6; TNF-α: Tumor necrosis factor-α.
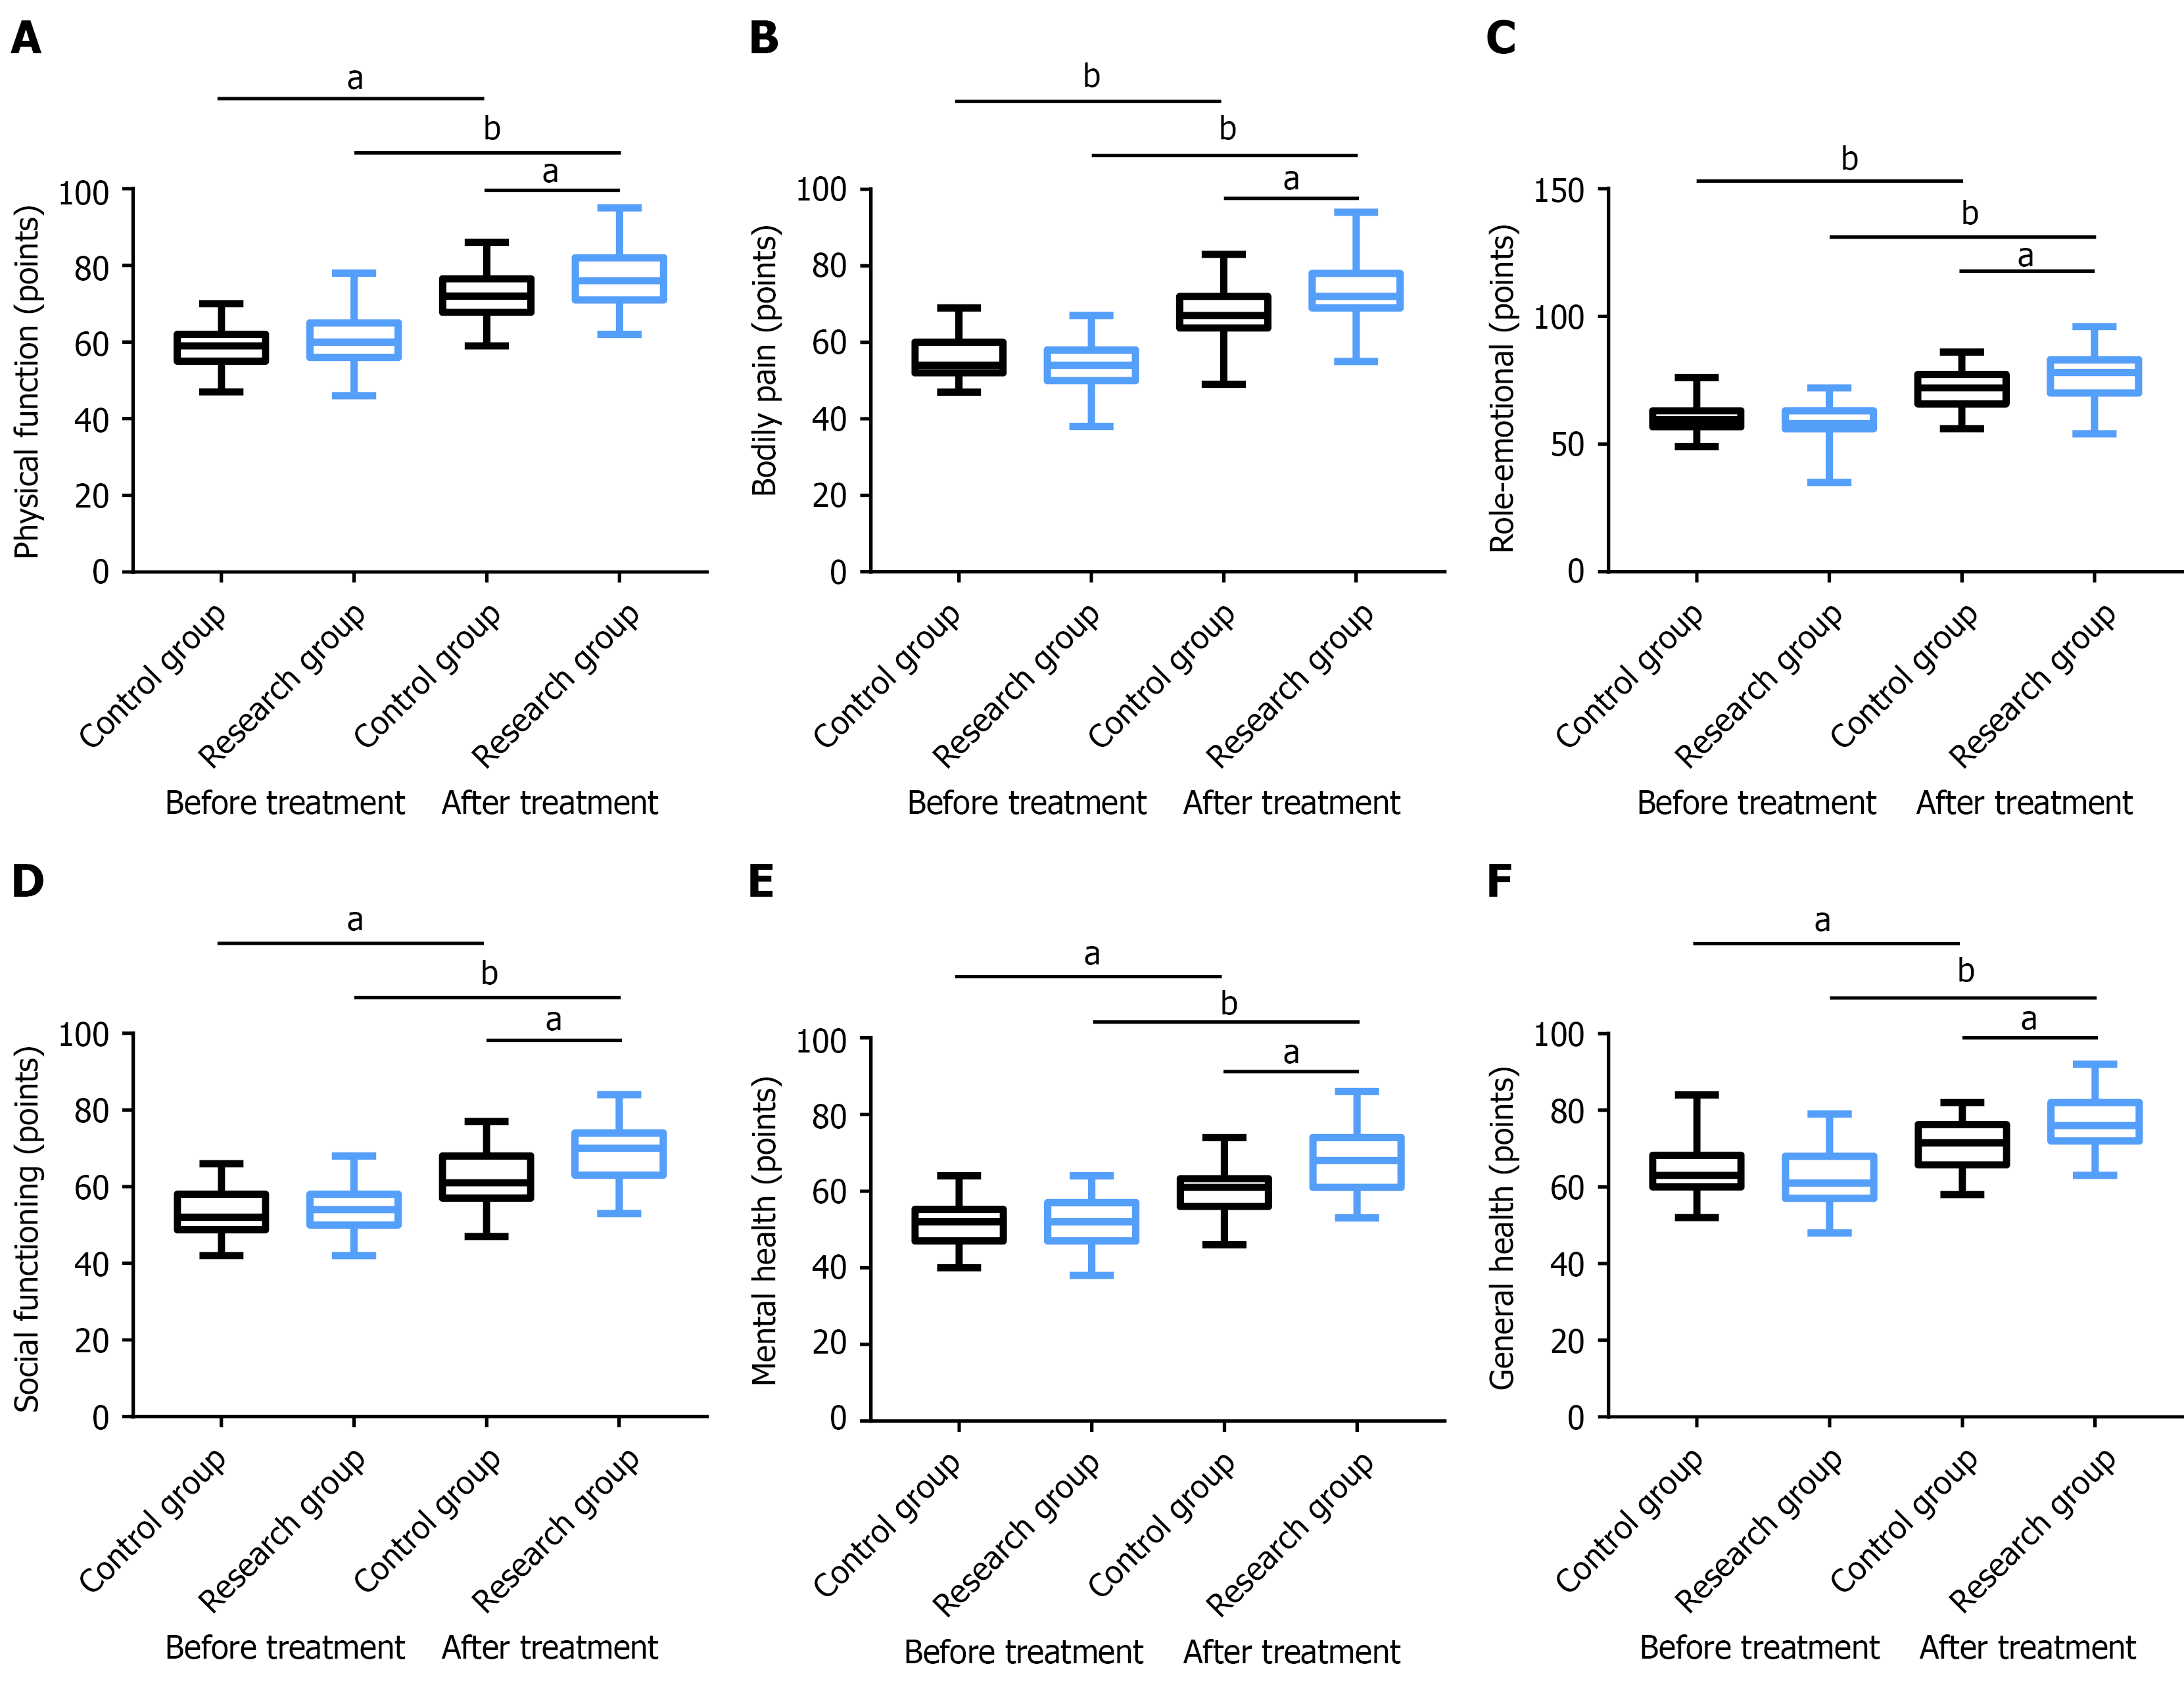
Figure 4 Quality of life.
A: Comparison of changes in physical functioning; B: Comparison of changes in bodily pain; C: Comparison of changes in role-emotional; D: Comparison of changes in social functioning; E: Comparison of changes in mental health before; F: Comparison of changes in general health before. aP < 0.05, bP < 0.01 vs groups.
- Citation: Chen XX, Lin N, Chen YB, Zhou XH, Zhang YJ. Effects of auricular vagus nerve stimulation with press needles plus Zusanli moxibustion on patients with colorectal cancer postoperatively. World J Gastrointest Surg 2026; 18(9): 119666
- URL: https://www.wjgnet.com/1948-9366/full/v18/i9/119666.htm
- DOI: https://dx.doi.org/10.4240/wjgs.119666