
















Copyright: ©Author(s) 2026.
World J Gastrointest Surg. Sep 27, 2026; 18(9): 118081
Published online Sep 27, 2026. doi: 10.4240/wjgs.118081
Published online Sep 27, 2026. doi: 10.4240/wjgs.118081
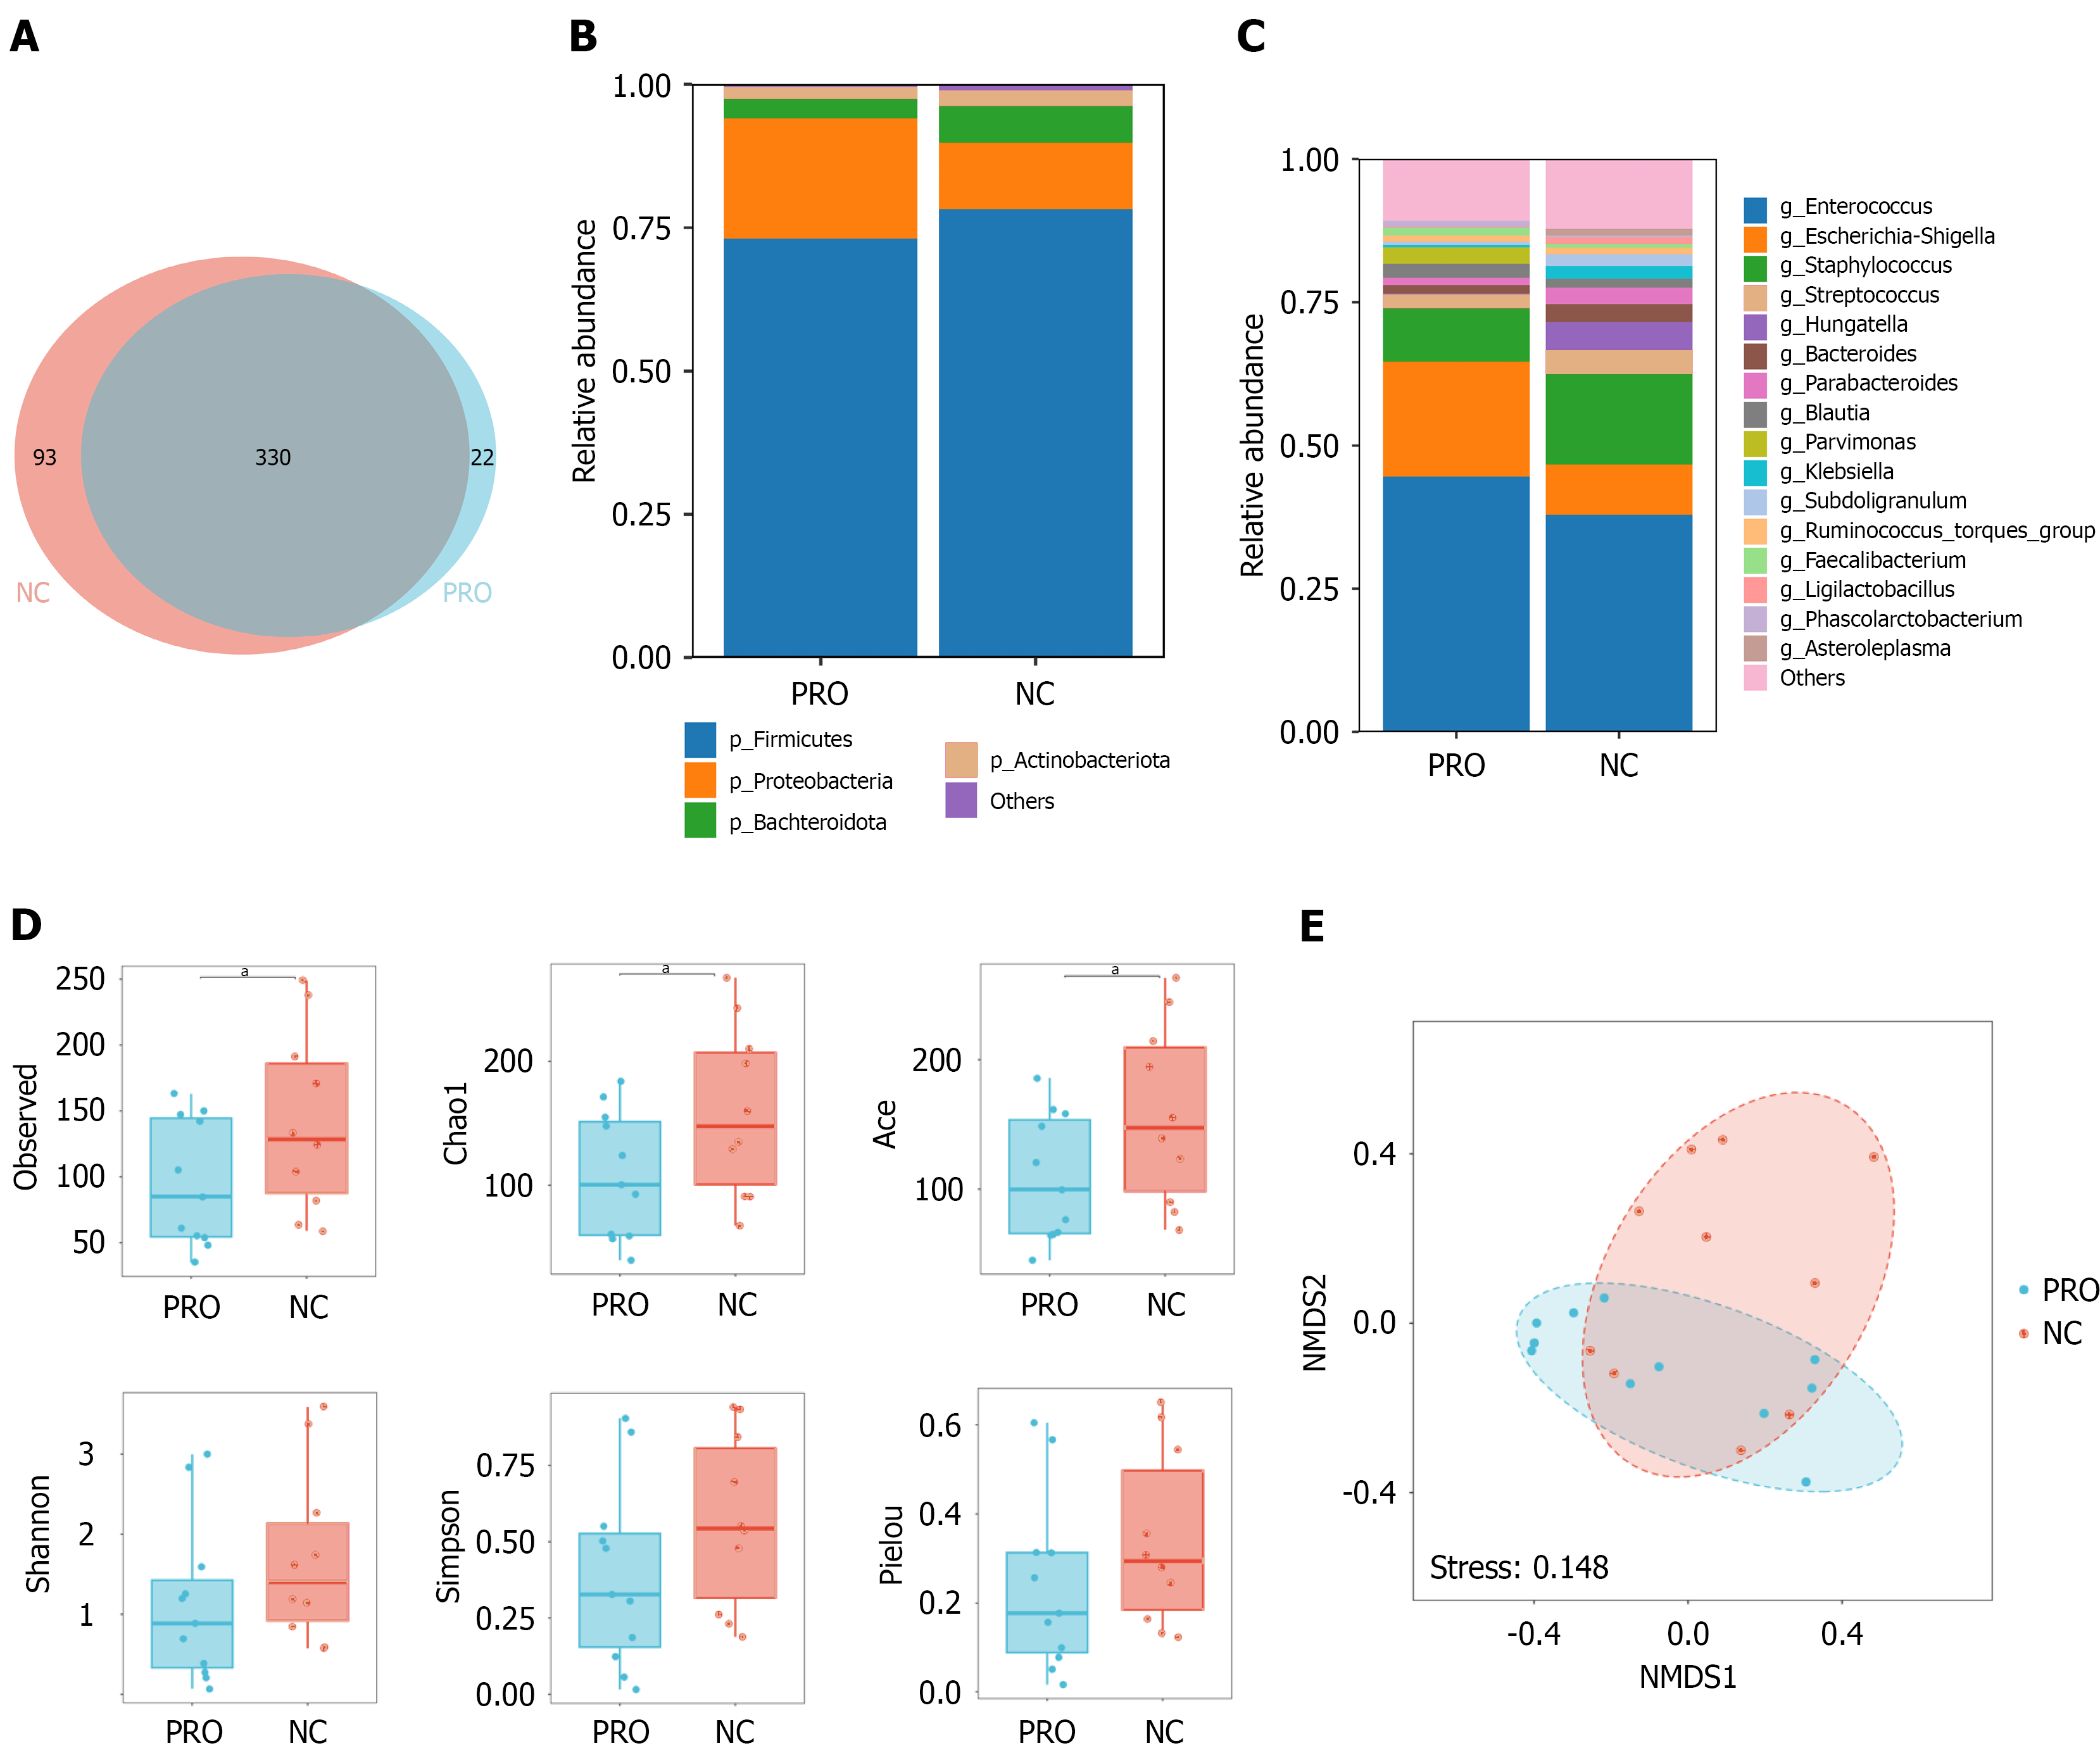
Figure 1 Species composition and diversity analysis in intestinal microbial populations between probiotic and control groups.
A: The Venn chart showed the number of operational taxonomic units between probiotic and control group; B and C: Relative gut microbiota abundance at phylum (B) and genus (C) level; D: Distribution of alpha diversity in each sample group. The horizontal coordinate represents the sample grouping, and the vertical coordinate represents the diversity index value. aP < 0.05; E: For nonmetric multidimensional scaling analysis, points in the nonmetric multidimensional scaling graph represent the sample, and different colors/shapes represent the group information to which the sample belongs. The distance between the lines of each sample point reflects the similarity between each sample. The shorter the distance, the greater the similarity. NC group: Control group; PRO group: Probiotic group; NMDS: Nonmetric multidimensional scaling.
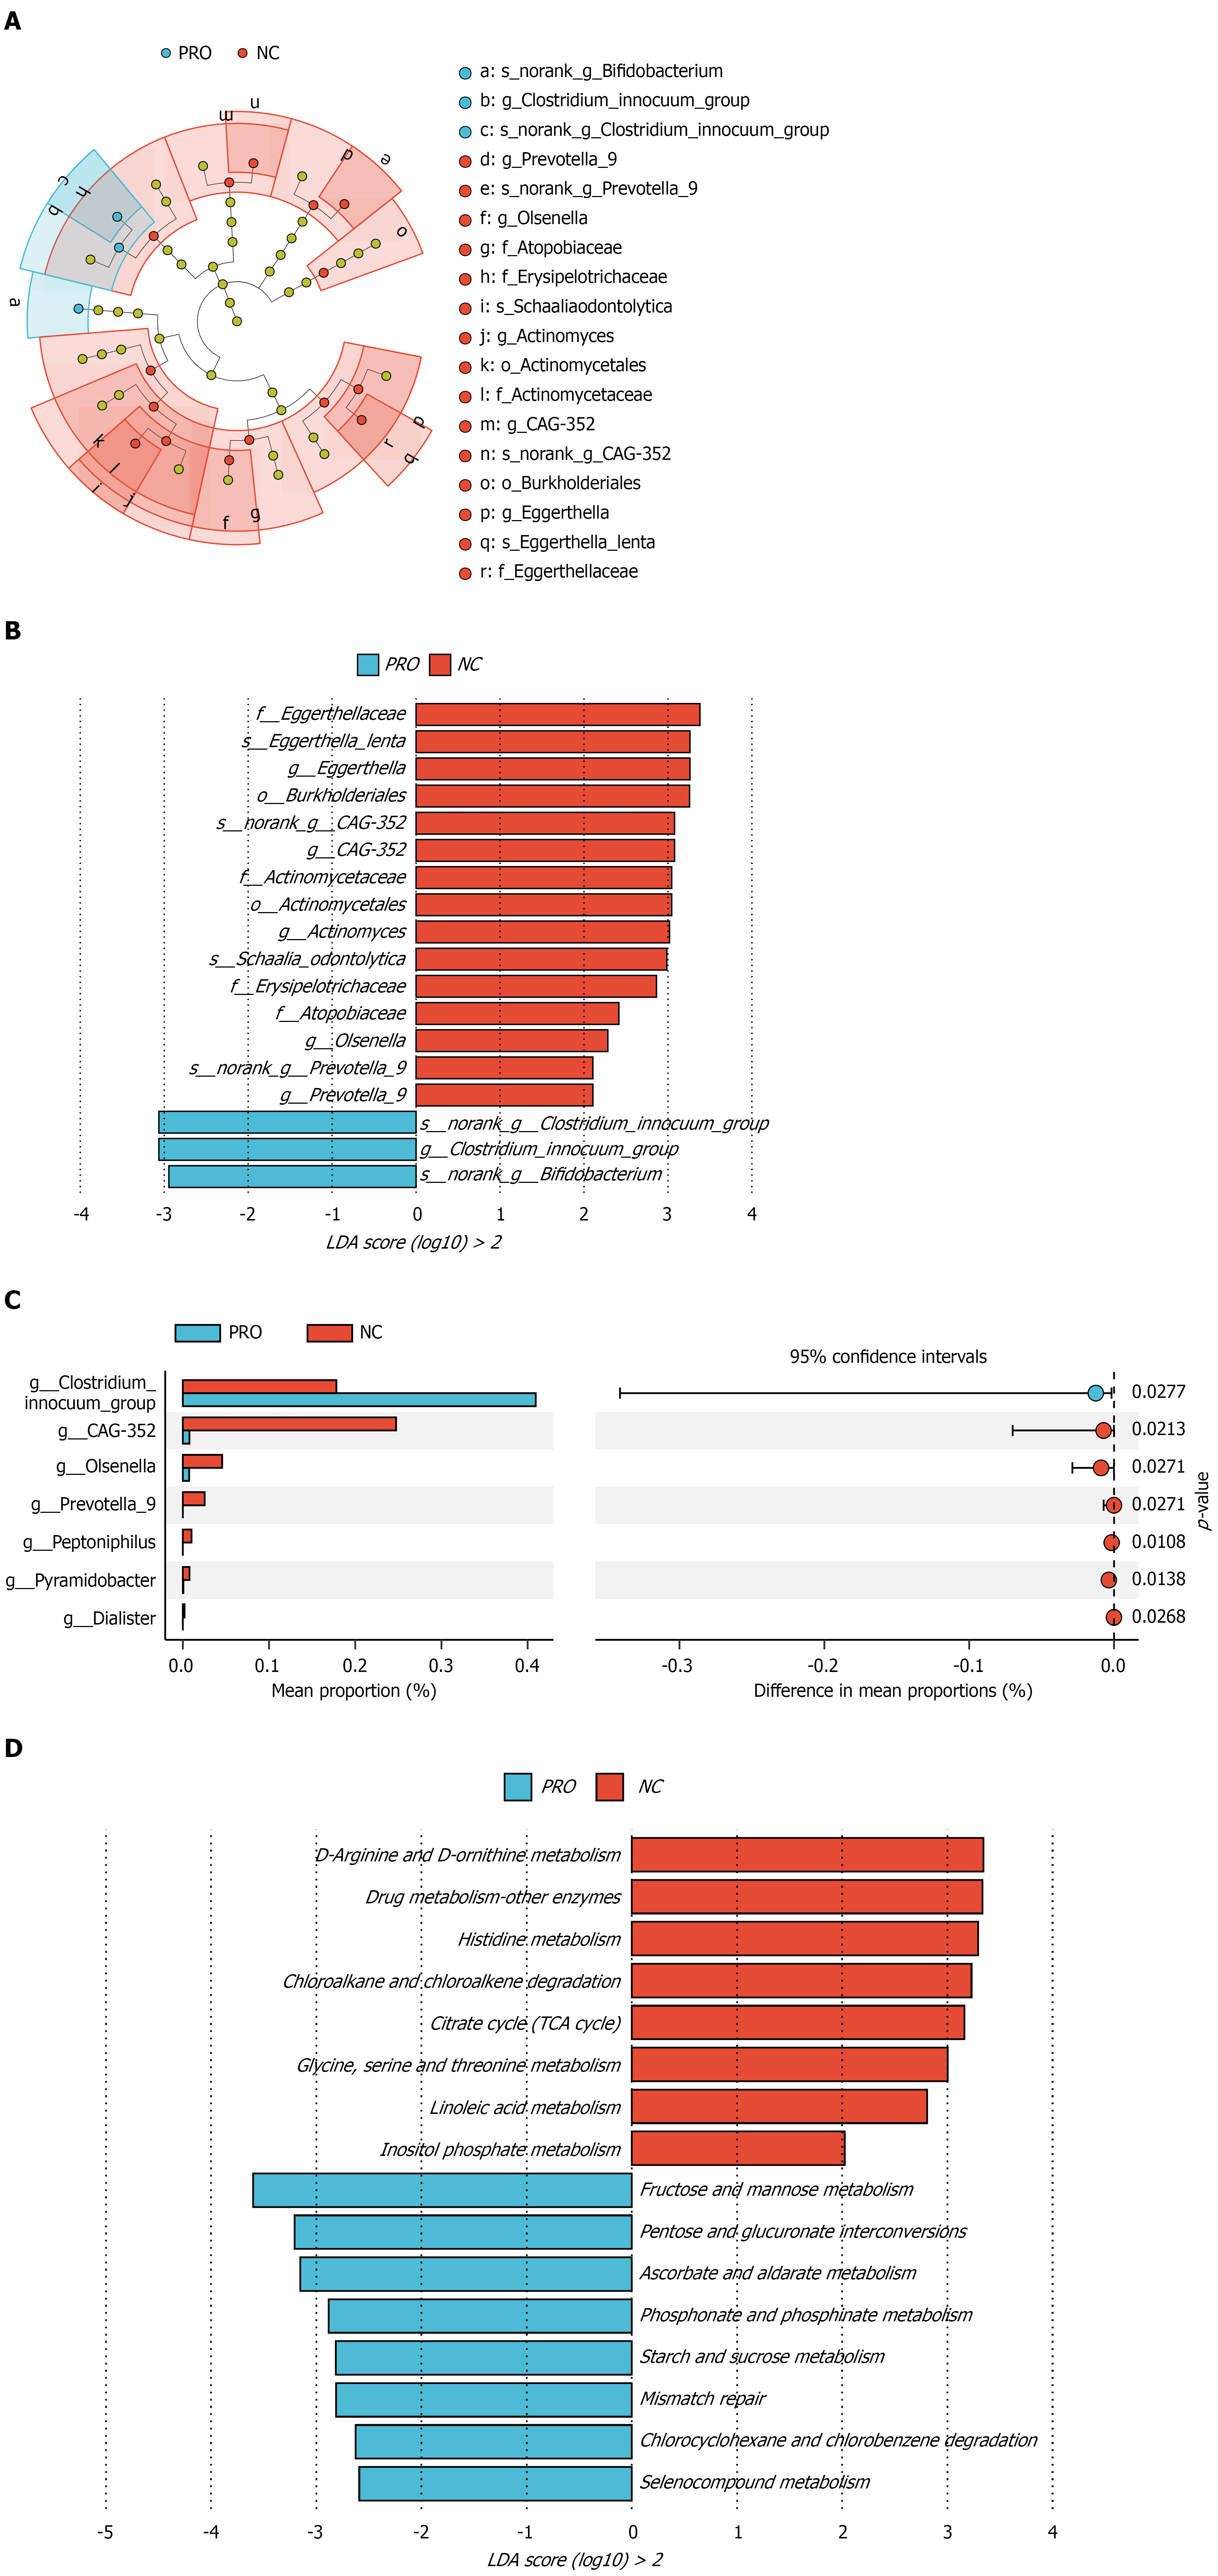
Figure 2 The species differences and functional analysis between probiotic and control groups.
A and B: Intestinal microbial linear discriminant analysis effect size (LEfSe) from domain to species and linear discriminant analysis (LDA) showed scores of these specific bacteria. A significantly different biomarker with an LDA score greater than 2 and a P < 0.05 is a biomarker with a statistical difference; C: The Wilcoxon rank sum test was used to compare the characteristic abundance of bacteria between two groups of samples. The left side shows the abundance proportion of different features in each sample, the middle shows the difference effect within the 95% confidence interval, and the far right shows the P value; D: The Kyoto Encyclopedia of Genes and Genomes pathway analysis by PICRUSt2 and LEfSe tools were used to predict the potential function of the differential gut microbiota. A significantly different biomarker with an LDA score greater than 2 and a P < 0.05 is a biomarker with a statistical difference. NC group: Control group; PRO group: Probiotic group; LDA: Linear discriminant analysis.
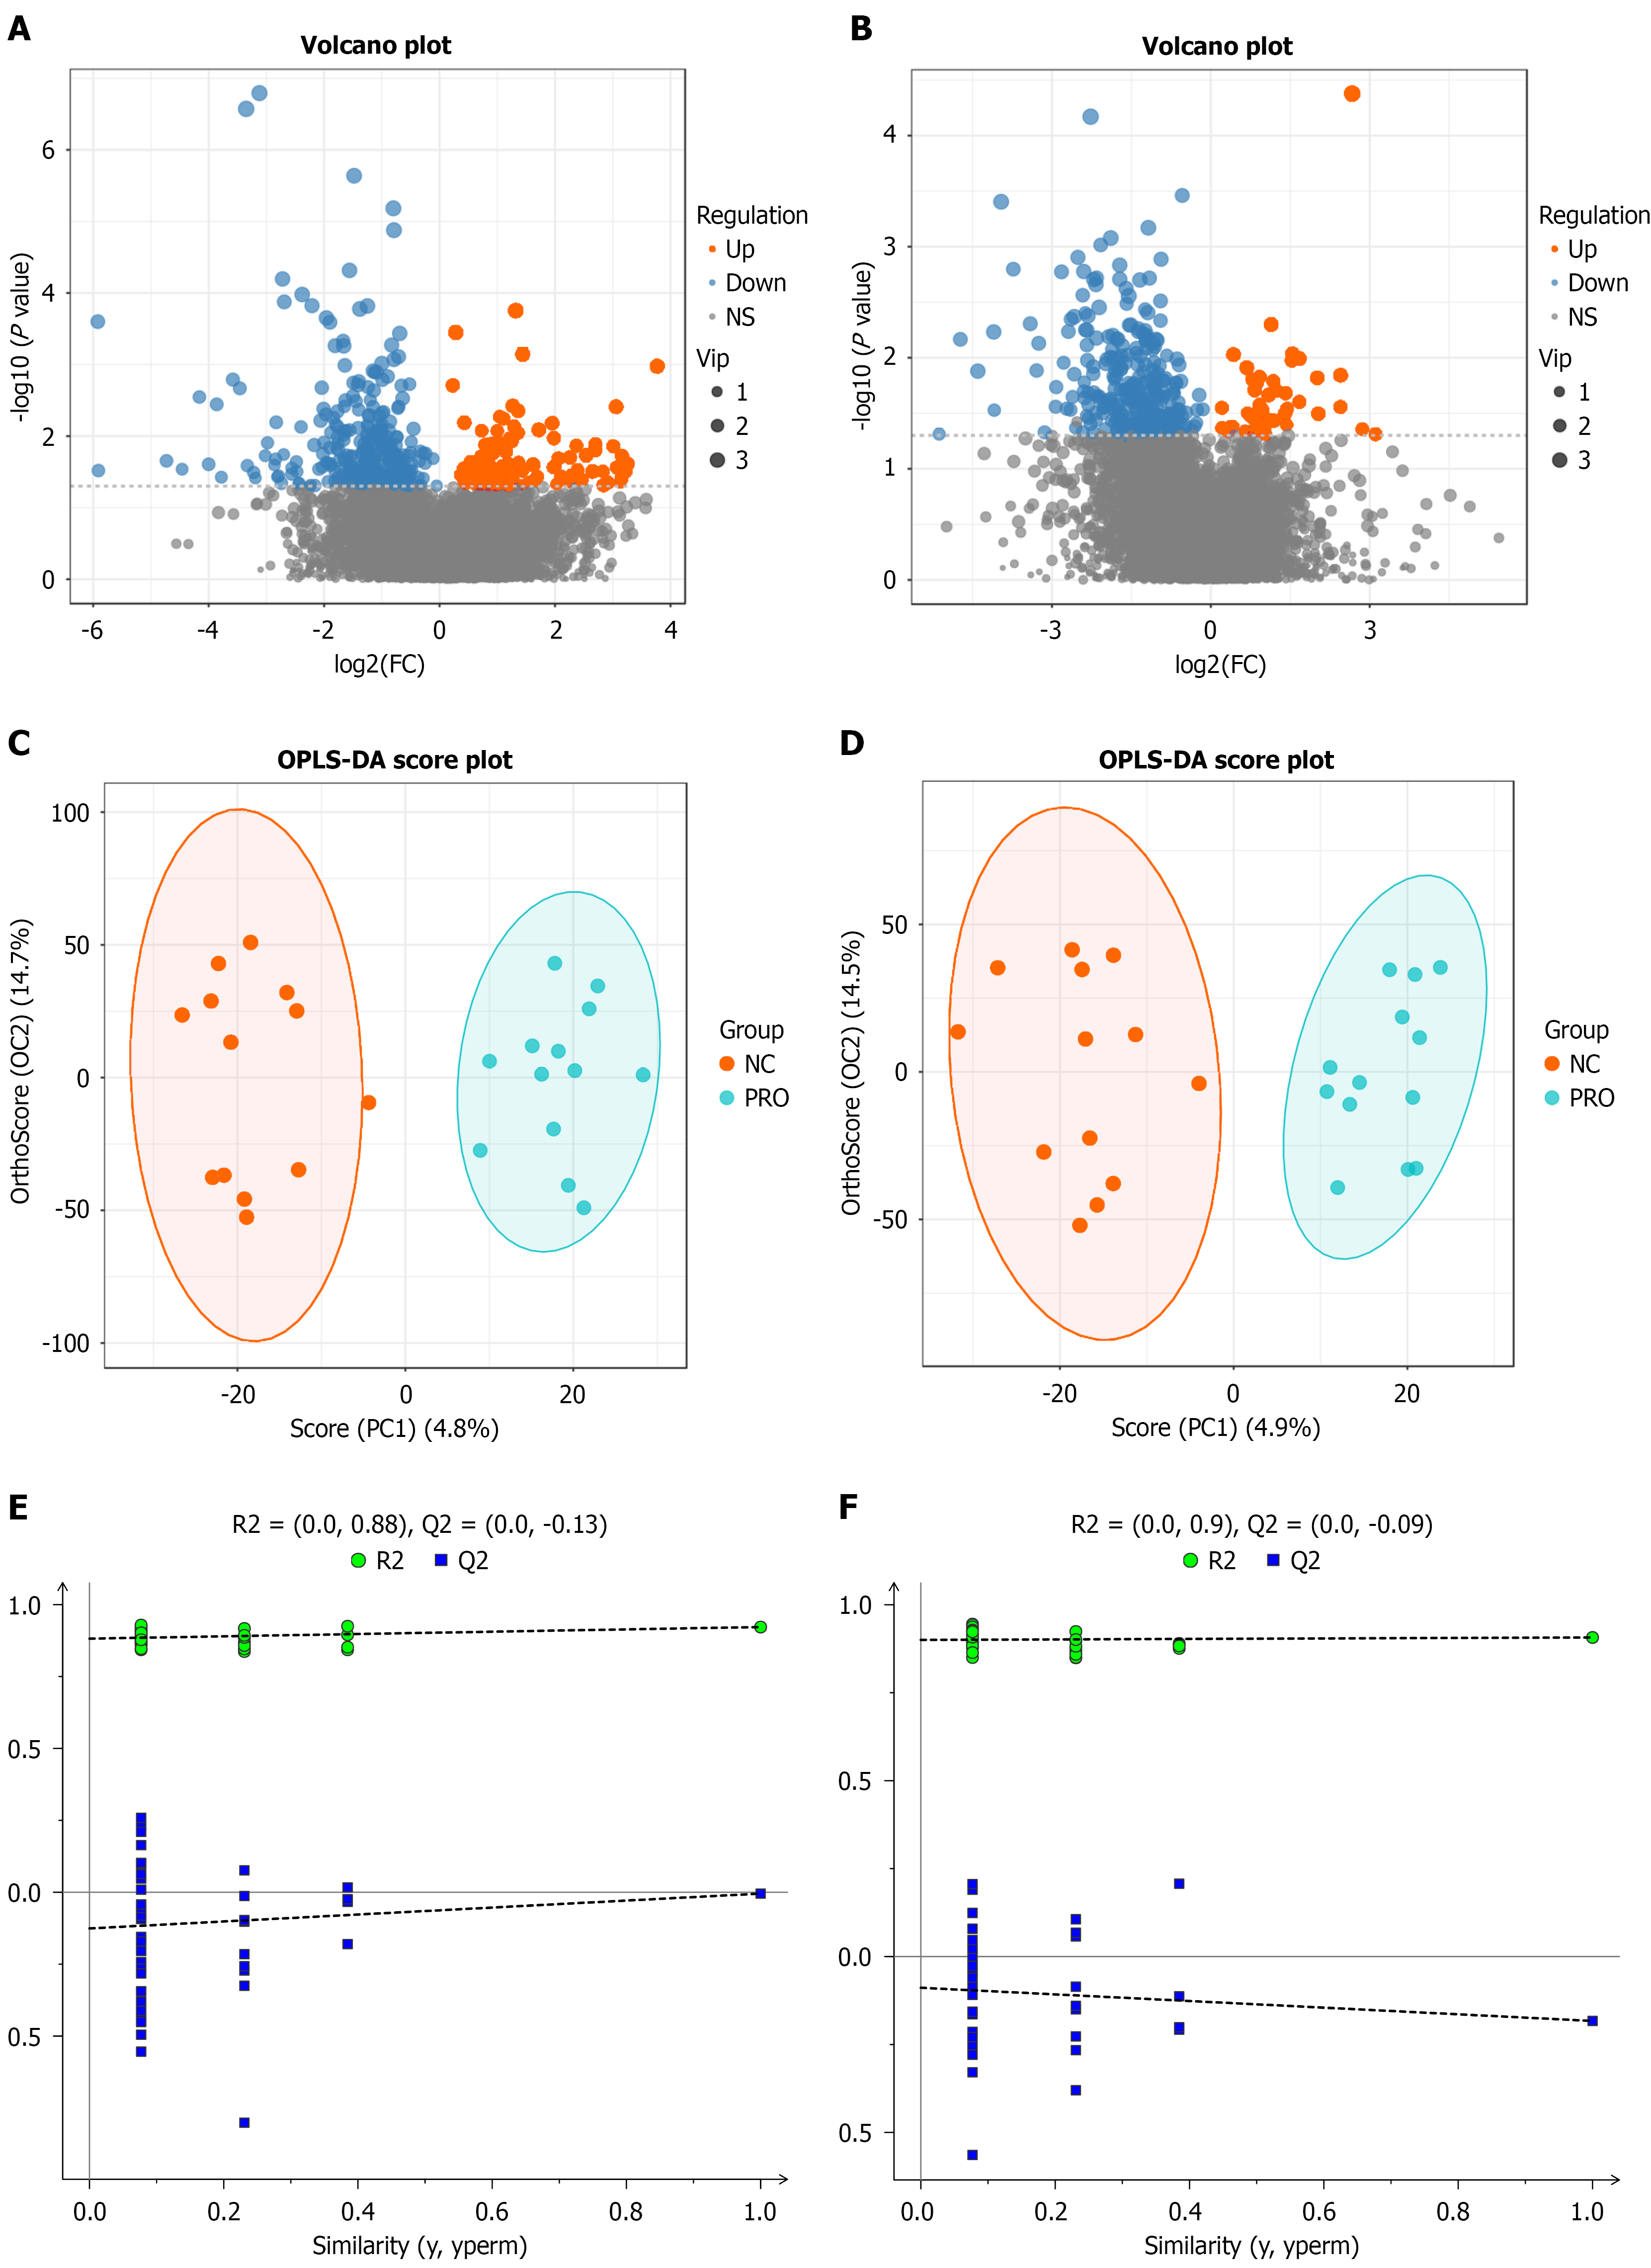
Figure 3 Probiotic therapy influenced feces metabolic profiles after operation.
A: A volcano plot of the MS1 differentially abundant metabolites under the positive ion mode; B: A volcano plot of the MS1 differentially abundant metabolites under the negative ion mode; C-F: An orthogonal partial least squares discriminant analysis (OPLS-DA) score map and OPLS-DA permutation test in the positive ion mode; the abscissa represents the decomposition degree of the first main component, and the ordinate represents the decomposition degree of the second main component (C and E). An OPLS-DA score map and OPLS-DA permutation test in the negative ion mode; the abscissa represents the decomposition degree of the first main component, and the ordinate represents the decomposition degree of the second main component (D and F). NC group: Control group; PRO group: Probiotic group; FC: Fold change; OPLS-DA: Orthogonal partial least squares discriminant analysis.
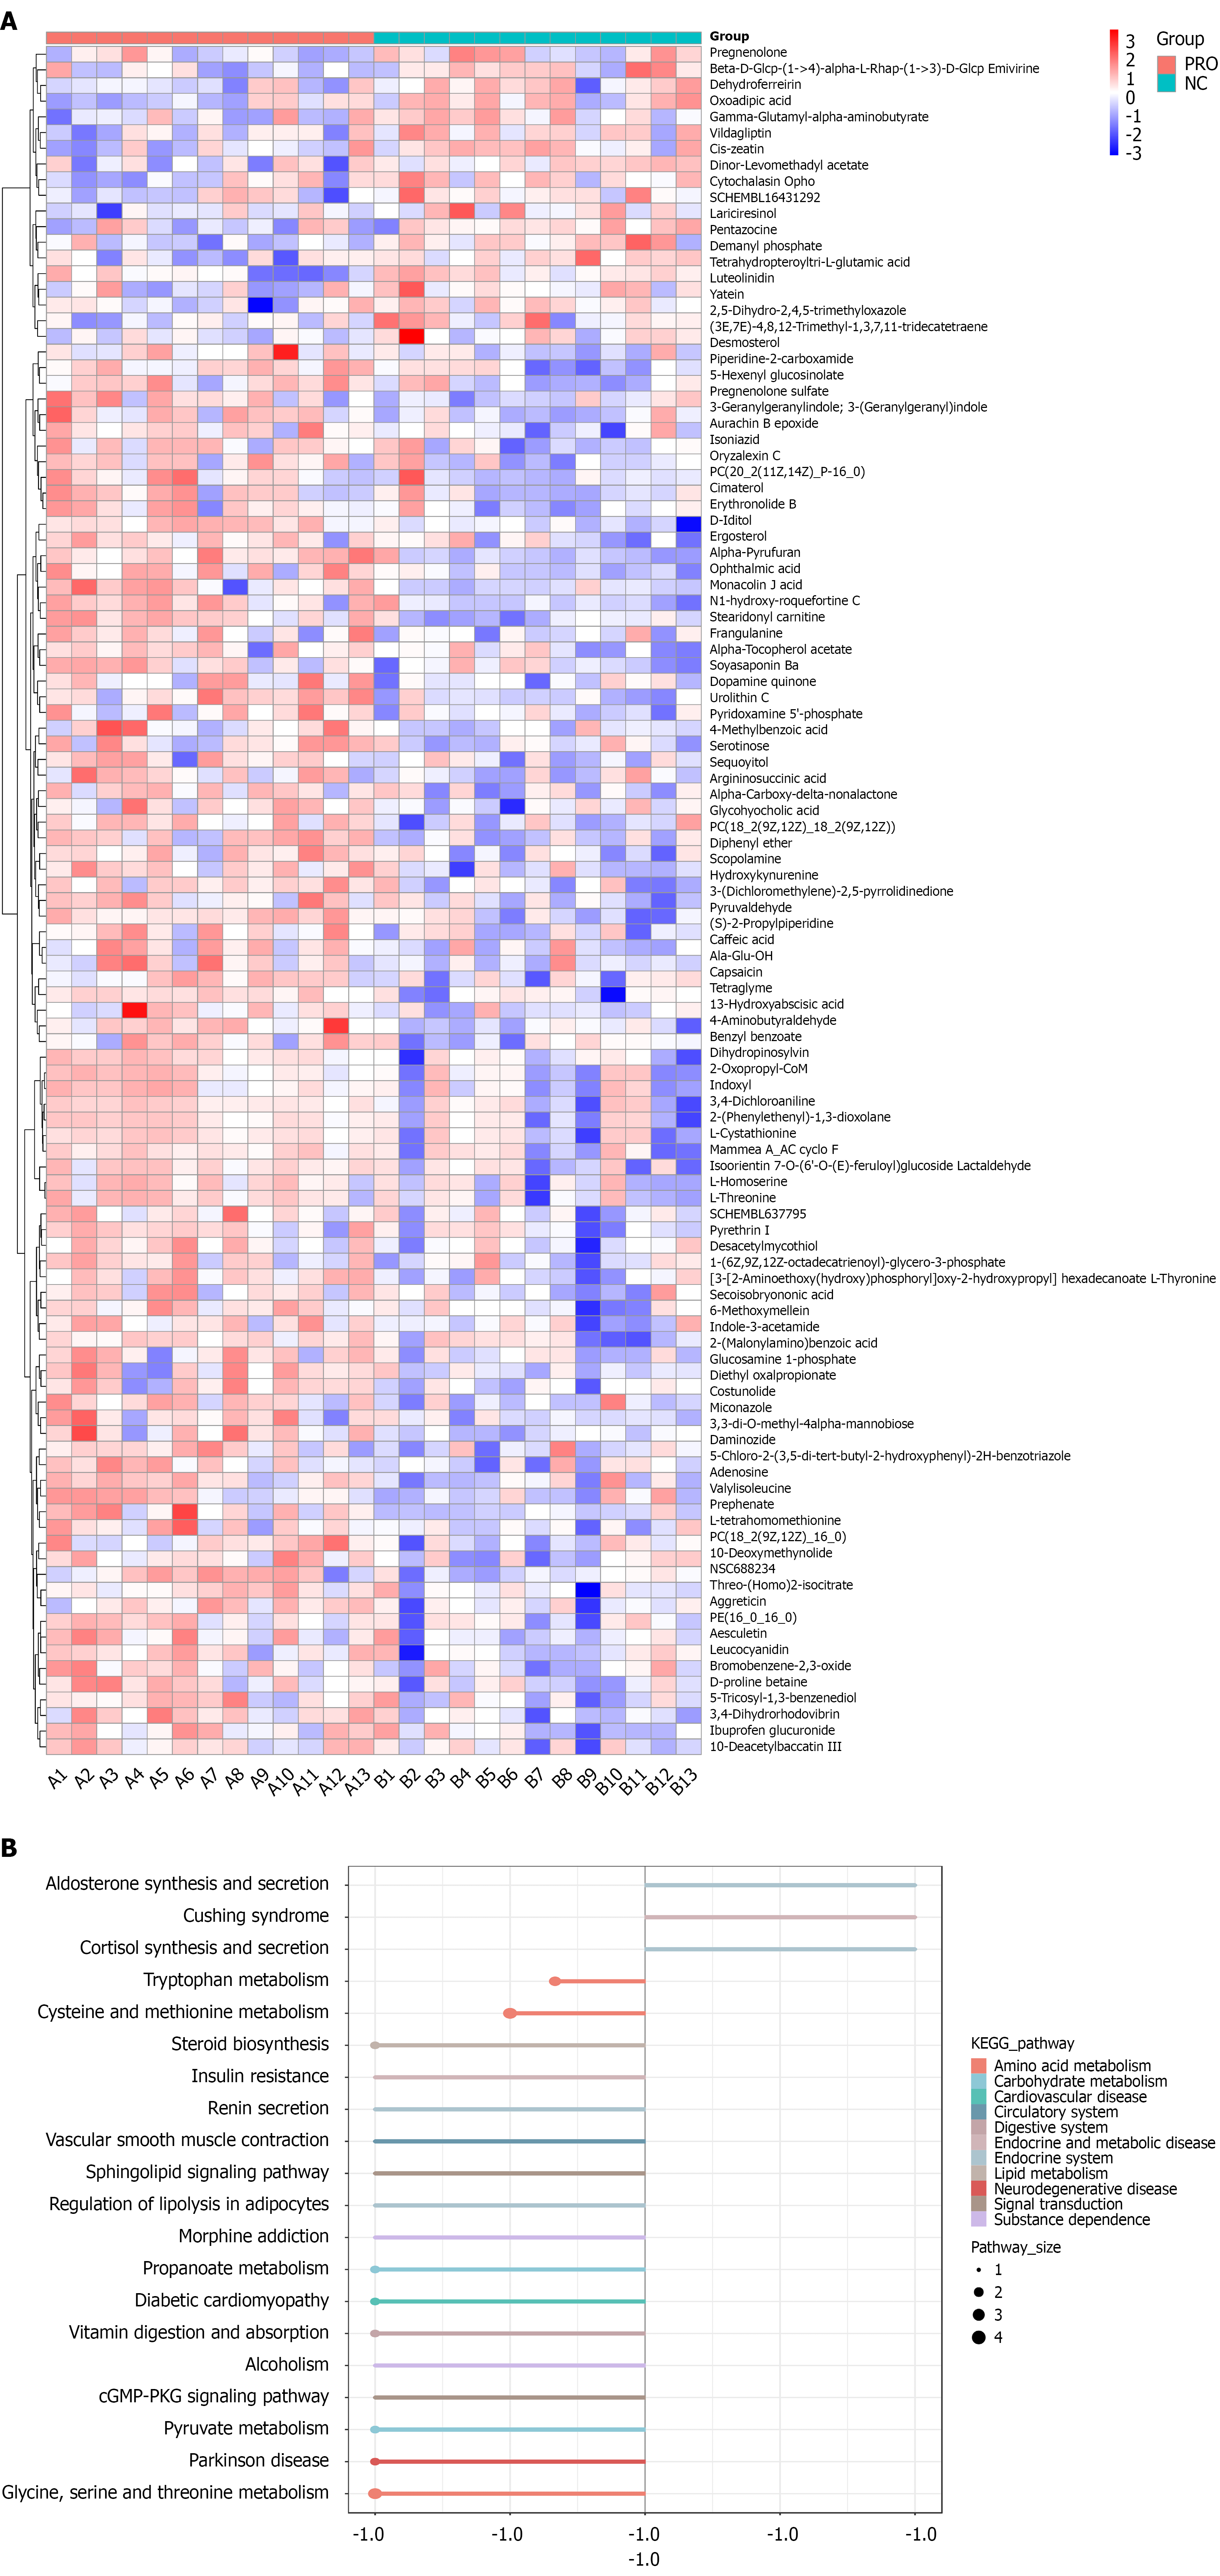
Figure 4 The pathway enrichment analysis of the MS2 differentially abundant metabolites.
A: The heatmap of the differentially abundant metabolites. Variable Importance in Projection > 1 and P < 0.05 were significantly different metabolites; B: In the differential enrichment score plot, the horizontal axis represents the DA score, where DA score = (number of substances with increased levels - number of substances with decreased levels)/total number of differentially regulated substances in the pathway. The columns on the left and right represent the pathways inhibited and activated in the probiotic group. NC group: Control group; PRO group: Probiotic group; KEGG: Kyoto Encyclopedia of Genes and Genomes.
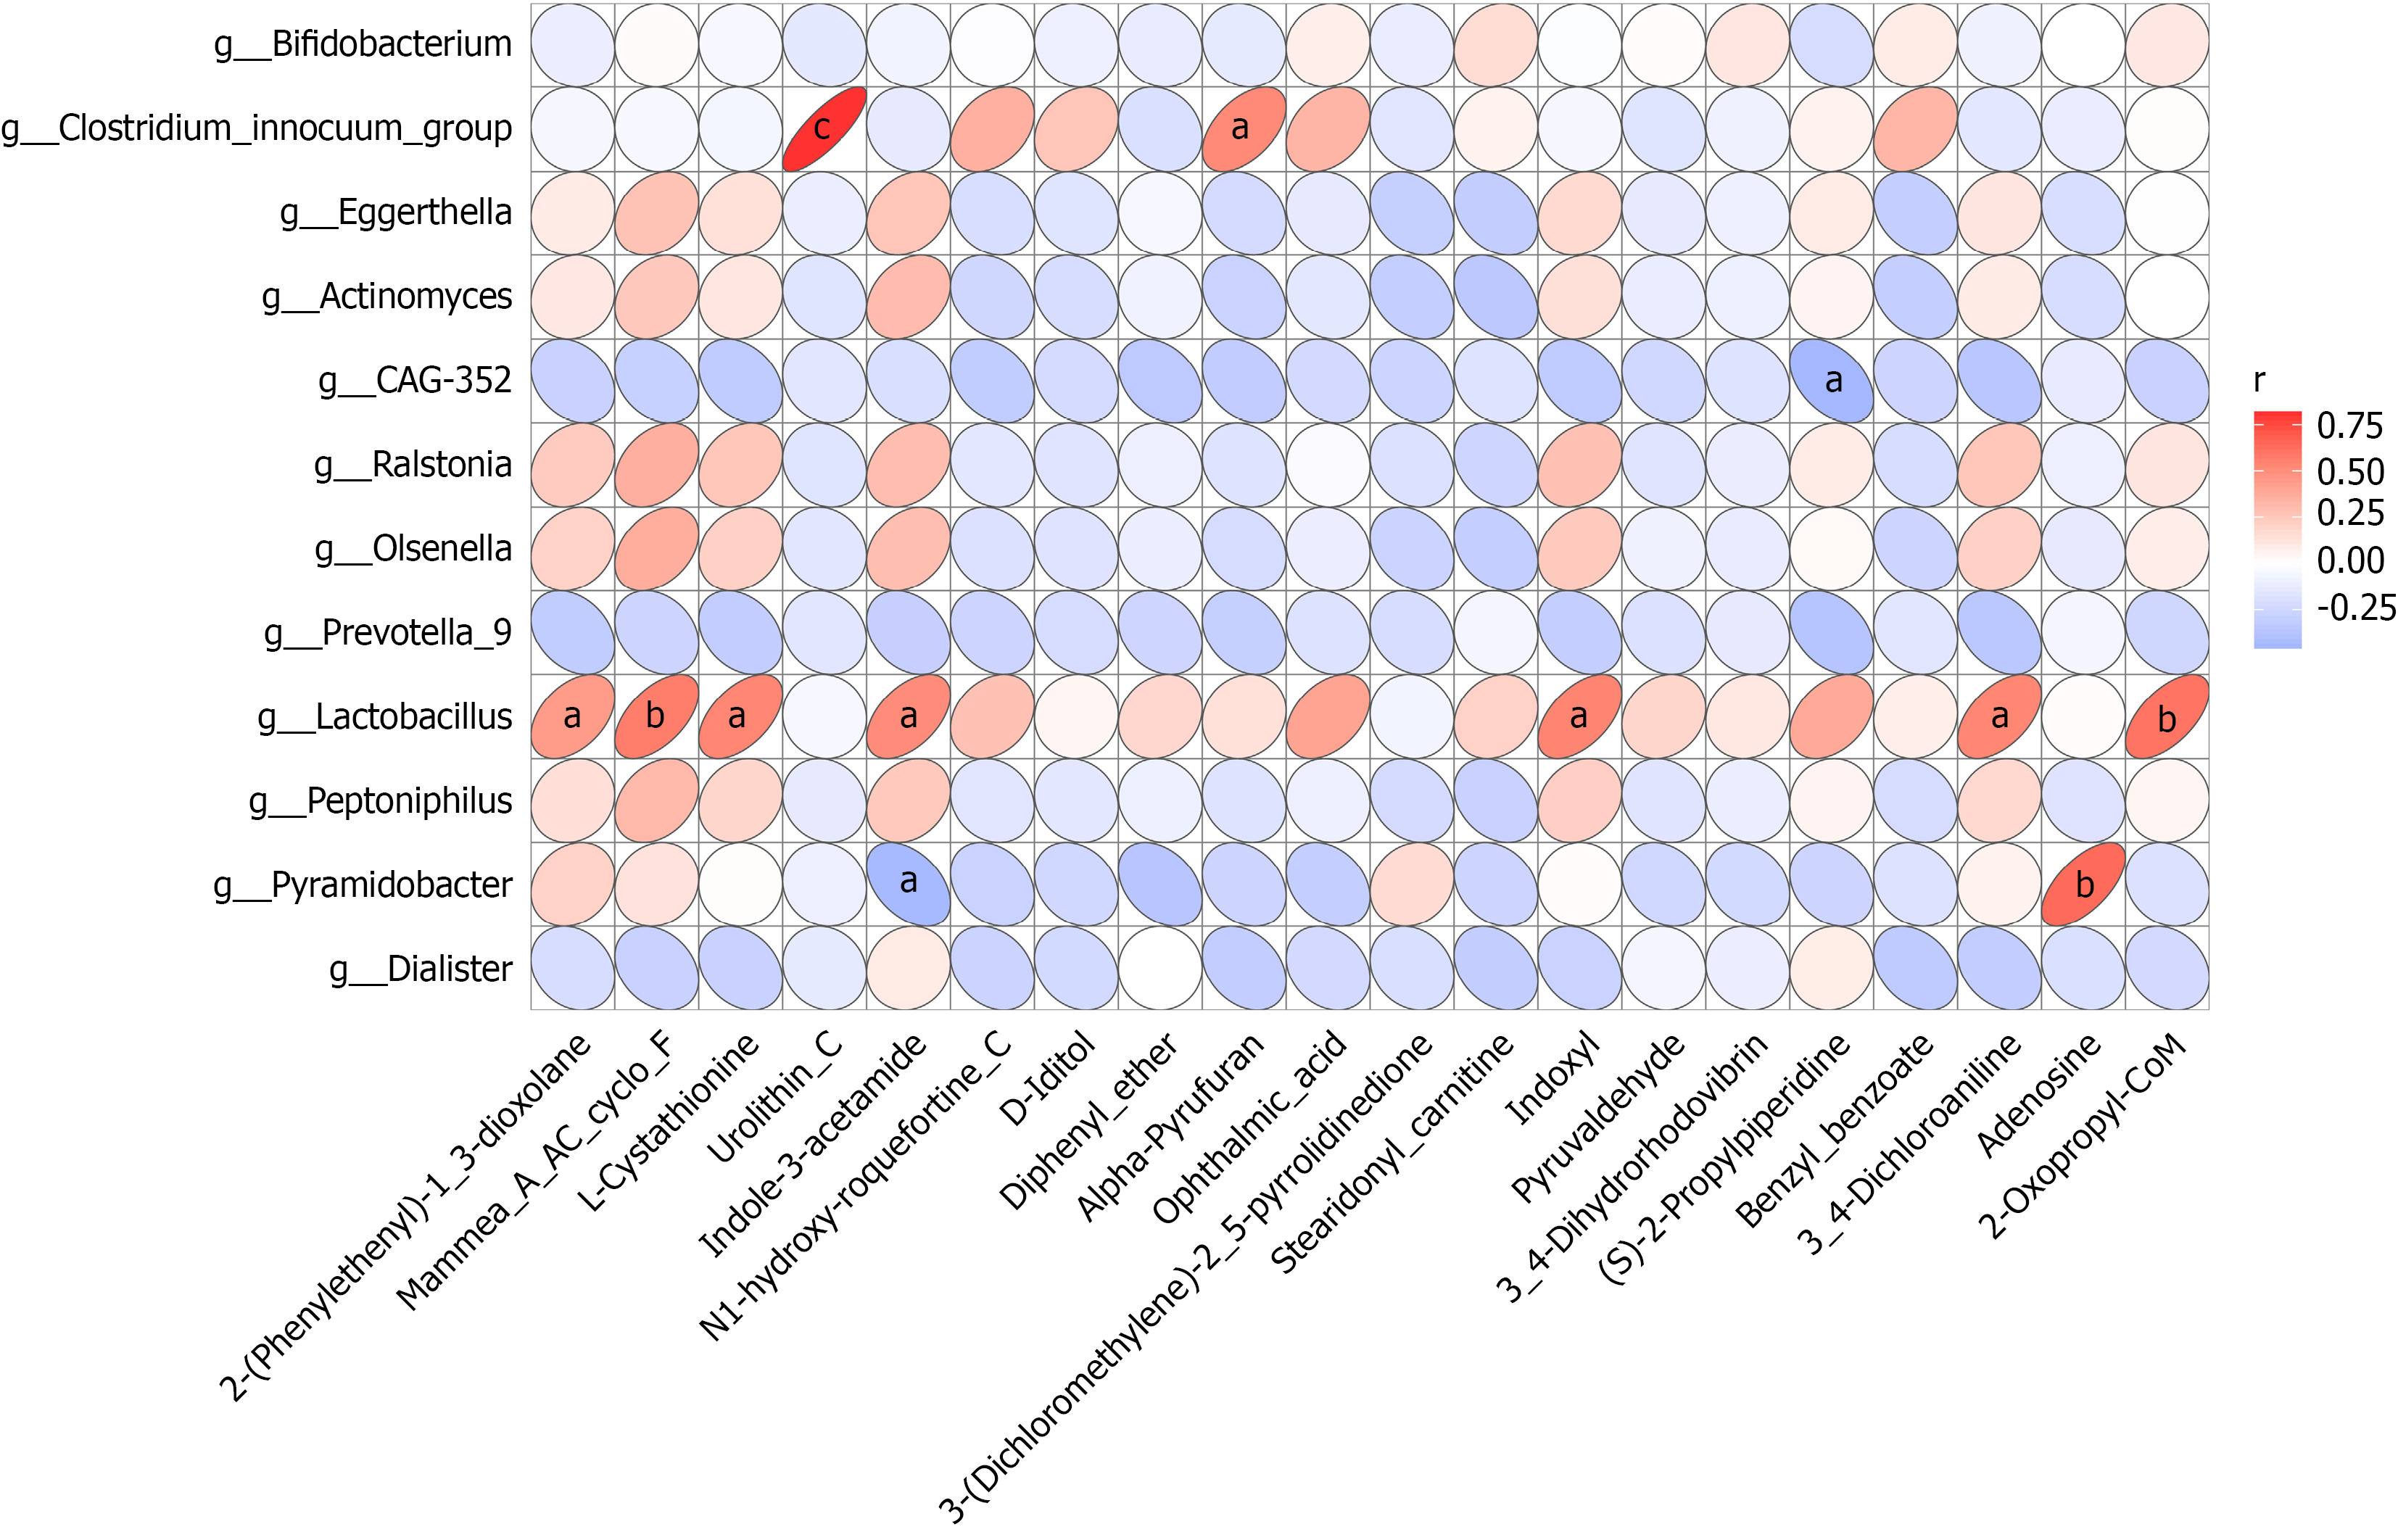
Figure 5 Intestinal microbial populations associated with differentially abundant metabolites.
Spearman correlation heat map of top 20 differentially abundant metabolites and microorganisms. Left row shows the microorganisms, and the bottom are listed as metabolites. Benjamini-Hochberg method was used to the results of the Spearman correlation analysis for false discovery rate (FDR) correction. The red ovals represent a positive correlation and the blue ovals represent a negative correlation. The larger the correlation pairs, the finer the ellipse. The blank grid indicates a significant FDR-value greater than 0.05. aFDR < 0.05, bFDR < 0.01 and cFDR < 0.001.
- Citation: Chen XF, Zhang HY, Gao PQ, Zhuang FN, Chen WJ, Wang F. Multi-omics reveal the effects of probiotics on the postoperative rehabilitation of patients with esophageal cancer. World J Gastrointest Surg 2026; 18(9): 118081
- URL: https://www.wjgnet.com/1948-9366/full/v18/i9/118081.htm
- DOI: https://dx.doi.org/10.4240/wjgs.118081