
















Copyright: ©Author(s) 2026.
World J Gastrointest Surg. Aug 27, 2026; 18(8): 119417
Published online Aug 27, 2026. doi: 10.4240/wjgs.119417
Published online Aug 27, 2026. doi: 10.4240/wjgs.119417
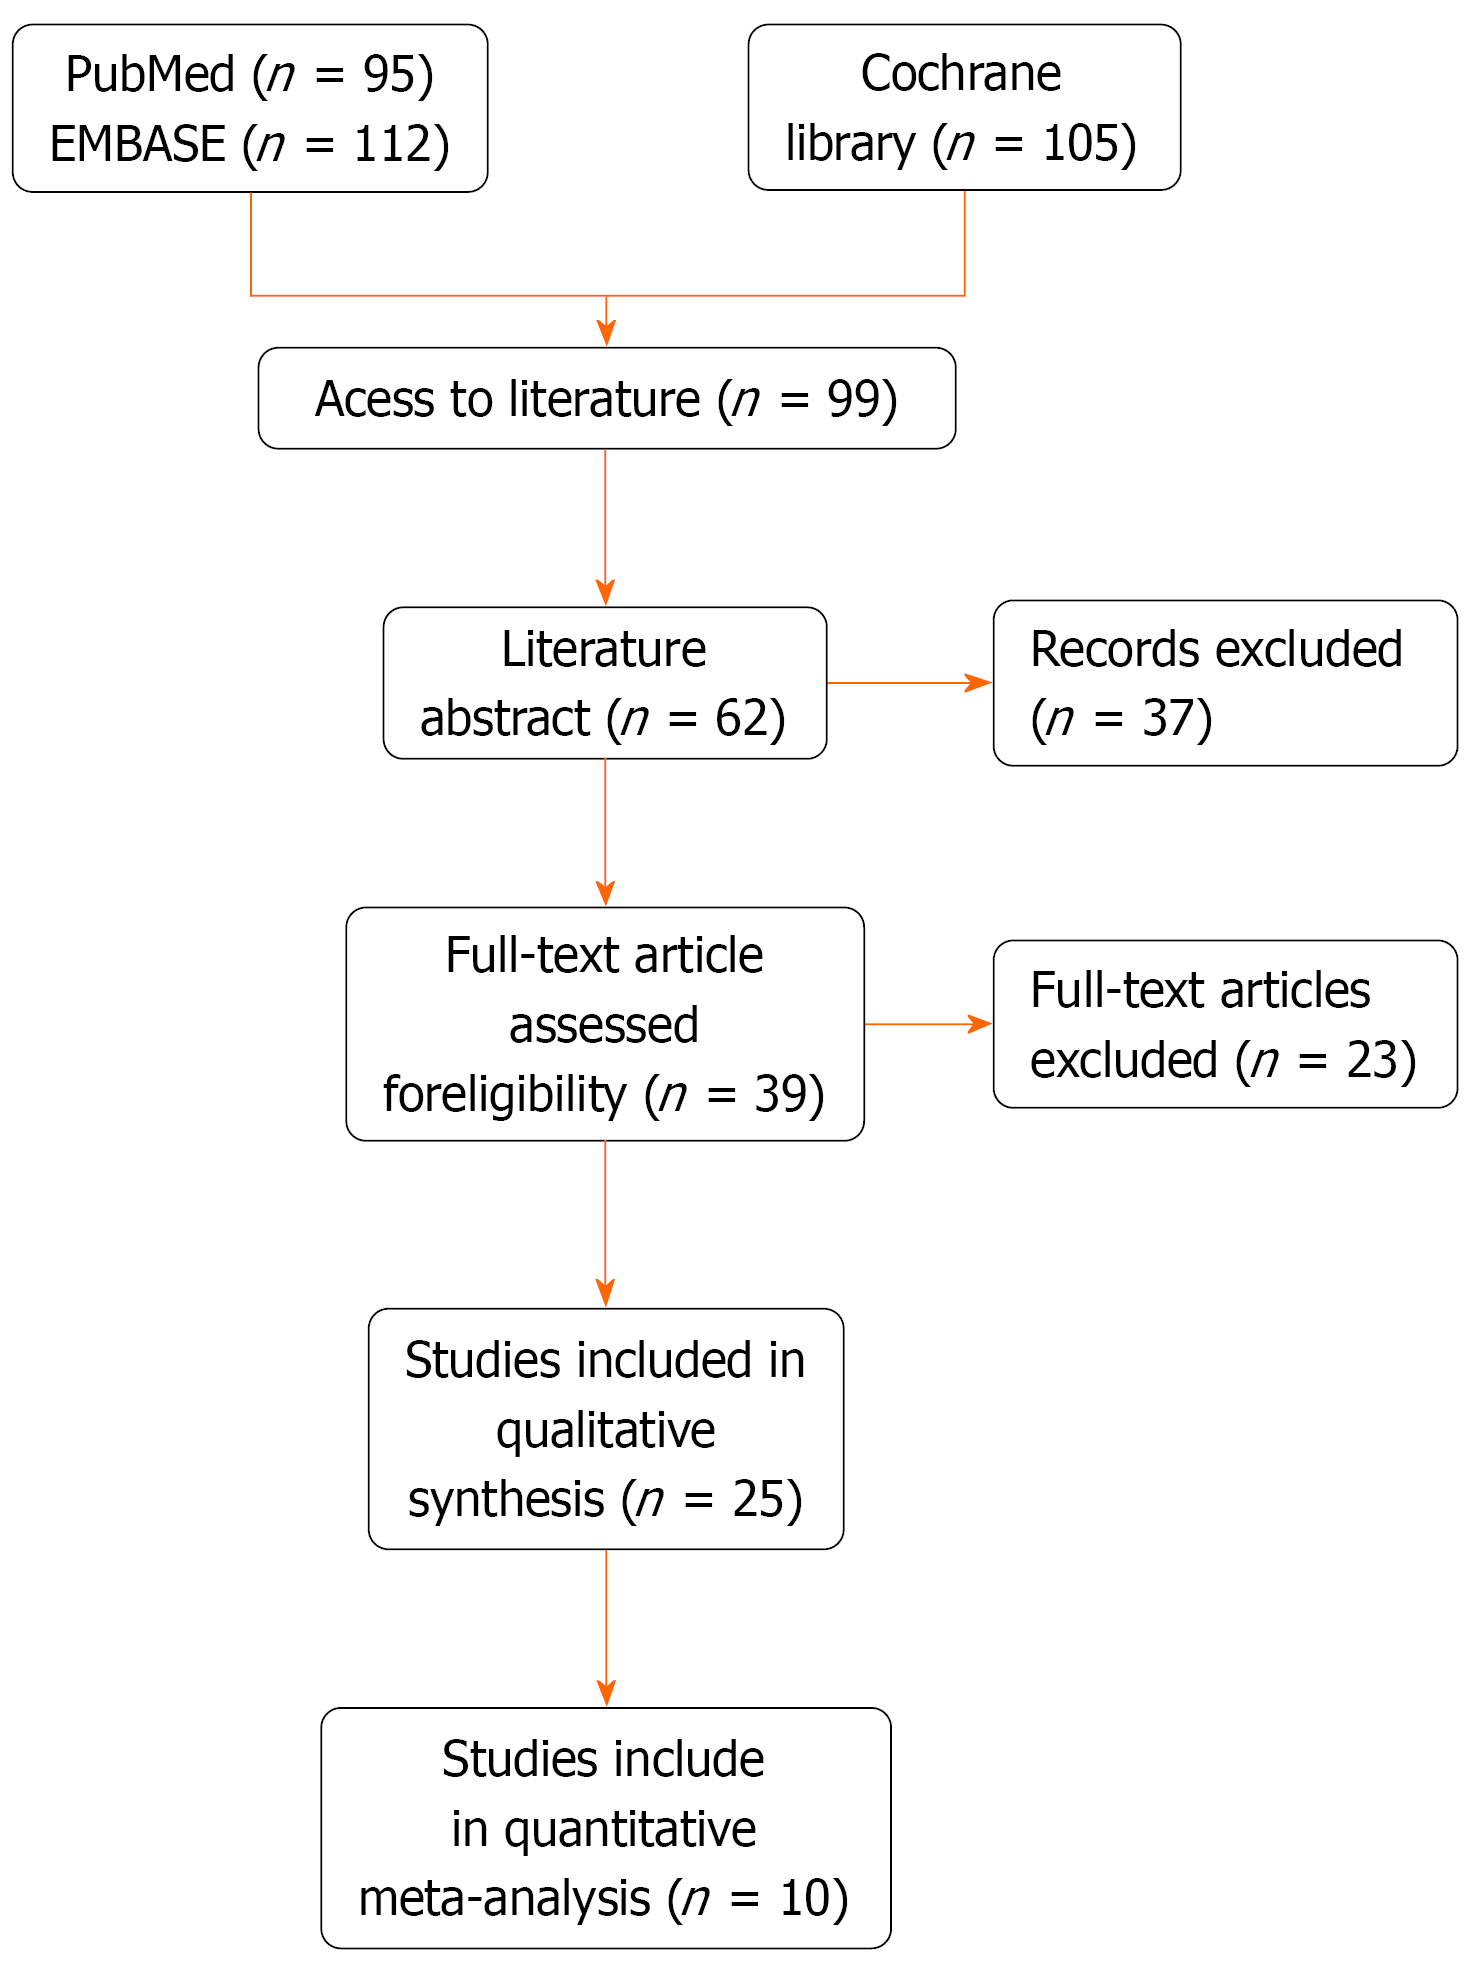
Figure 1 PRISMA flow diagram of study selection process.
PRISMA flow diagram of study selection process. A total of 312 records were identified through database searching, including PubMed/MEDLINE (n = 95), EMBASE (n = 112), and the Cochrane Library (n = 105). After duplicate removal and preliminary screening, 99 records were assessed. After abstract screening of 62 records, 37 records were excluded. Thirty-nine full-text articles were assessed for eligibility, and 23 were excluded. Finally, 25 studies were included in the qualitative synthesis, of which 10 studies provided sufficient data for quantitative meta-analysis.
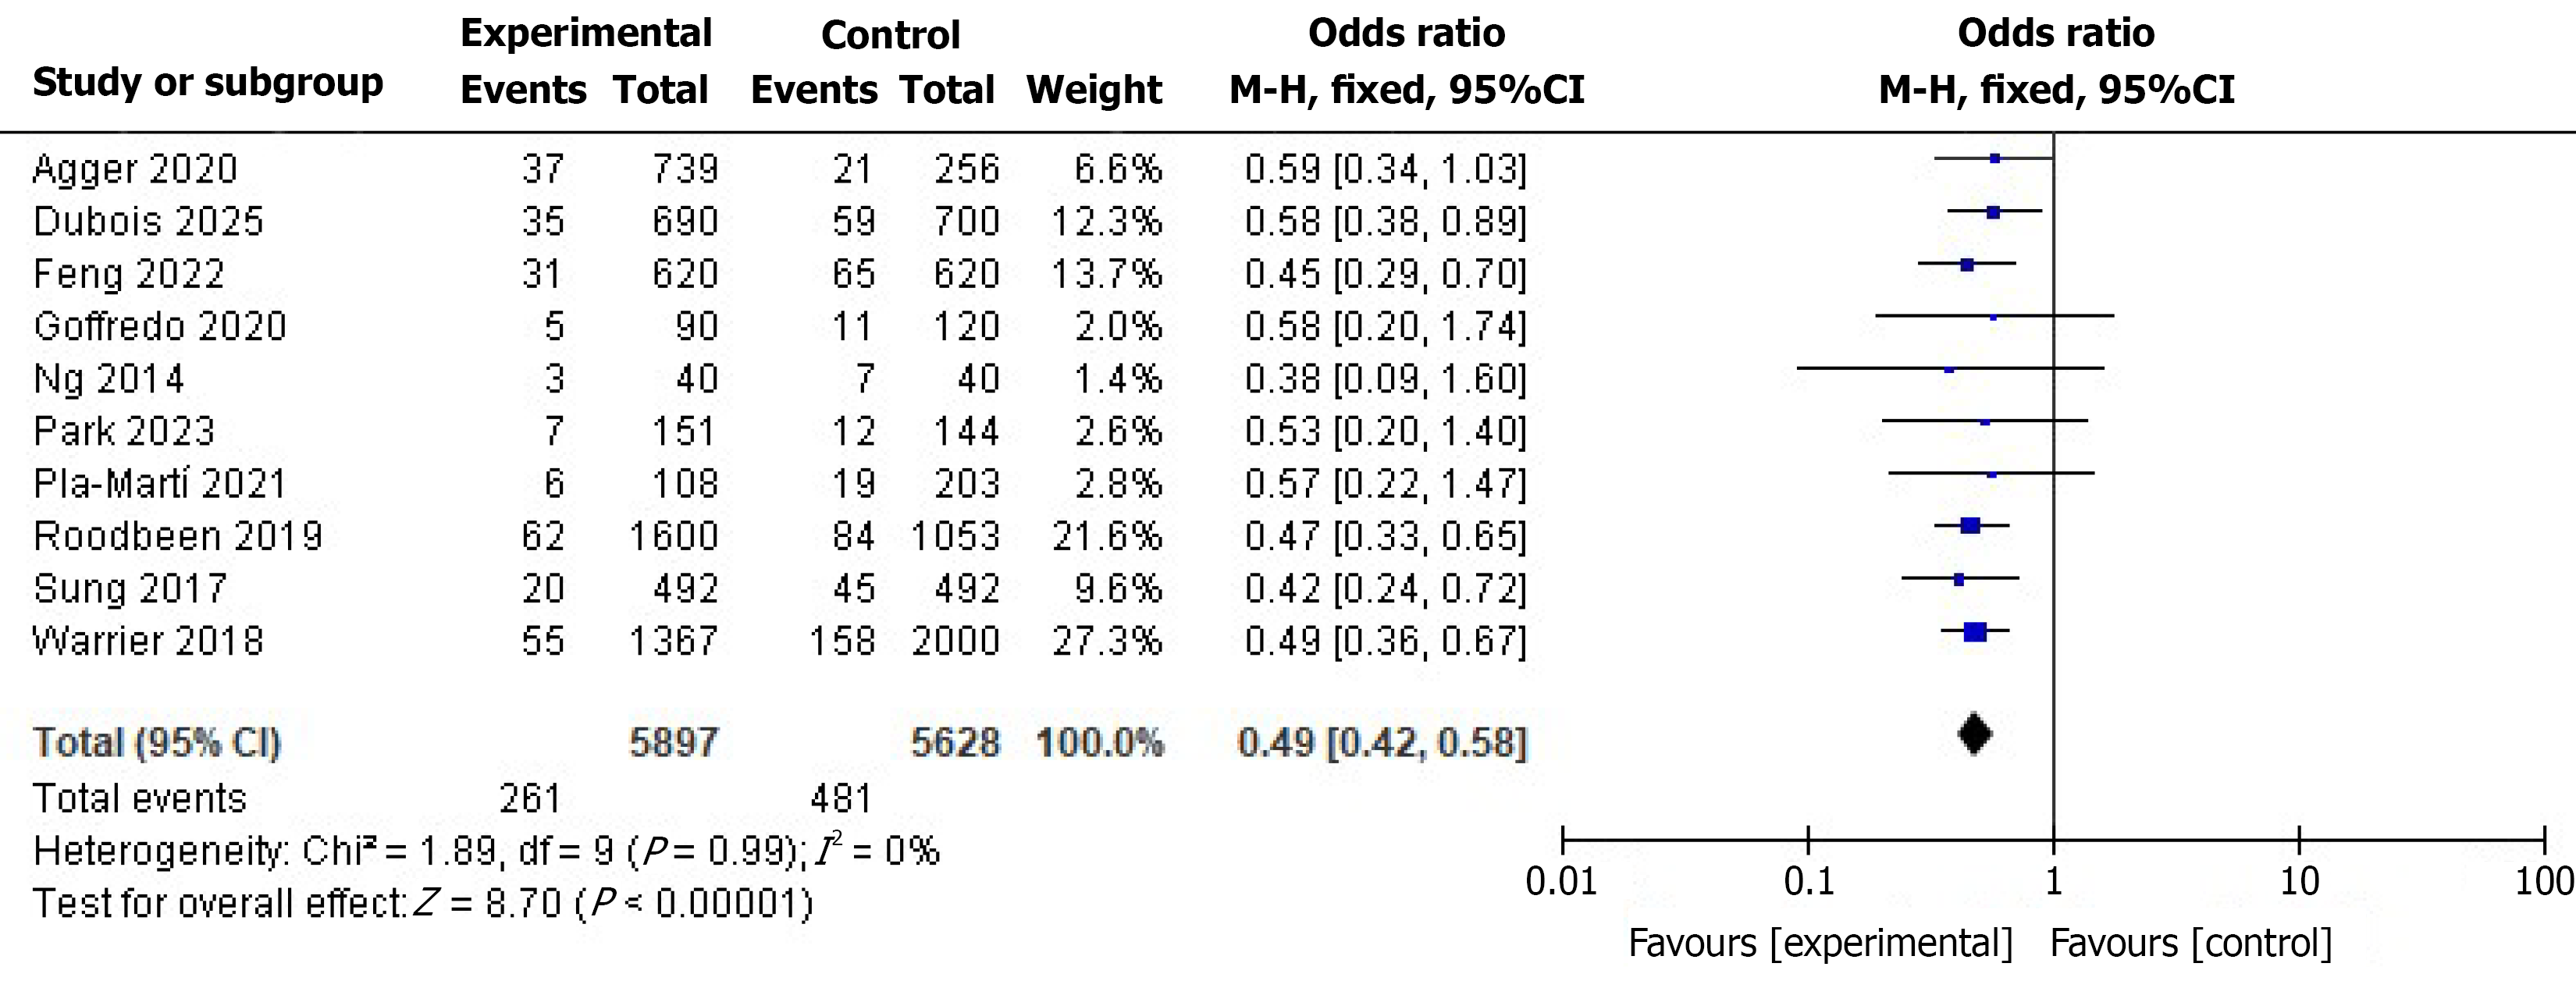
Figure 2 Forest plot of total mesorectal excision quality and local recurrence with dose-response trend.
The forest plot illustrates a clear dose-response relationship between total mesorectal excision (TME) quality and local recurrence risk, with incomplete TME conferring the highest risk [odds ratio (OR) = 3.16], followed by nearly complete TME (OR = 1.82) compared to complete TME (P for trend < 0.001). 95%CI: 95% confidence interval.
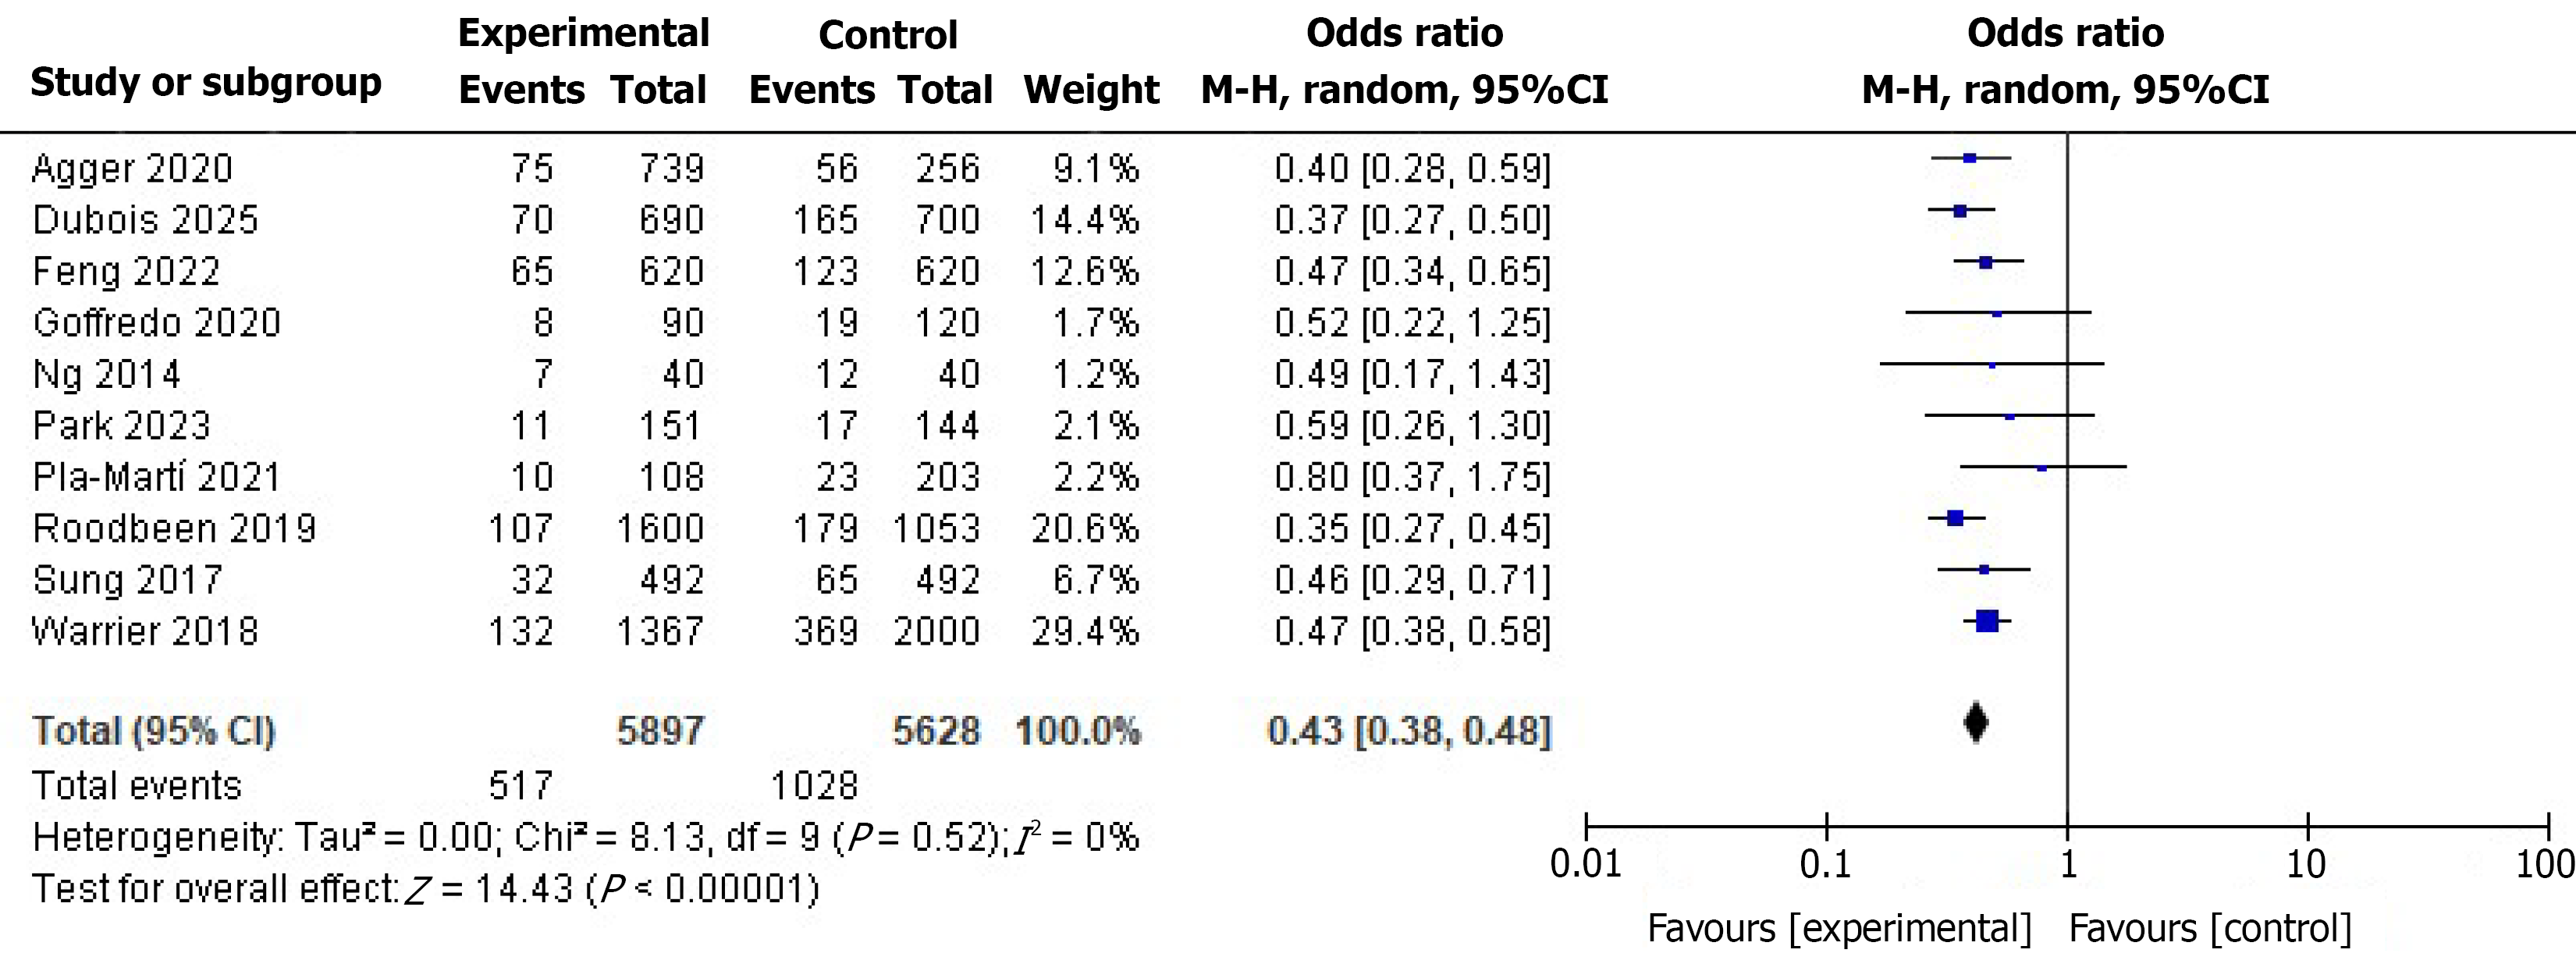
Figure 3 Subgroup analysis of circumferential resection margin status and local recurrence by neoadjuvant therapy use.
Subgroup analysis stratified by neoadjuvant therapy demonstrated consistent associations between positive circumferential resection margin and increased local recurrence risk, both in patients receiving neoadjuvant therapy [odds ratio (OR) = 4.15] and those undergoing primary surgery (OR = 4.48), with no significant interaction between subgroups (P for interaction = 0.68). 95%CI: 95% confidence interval.
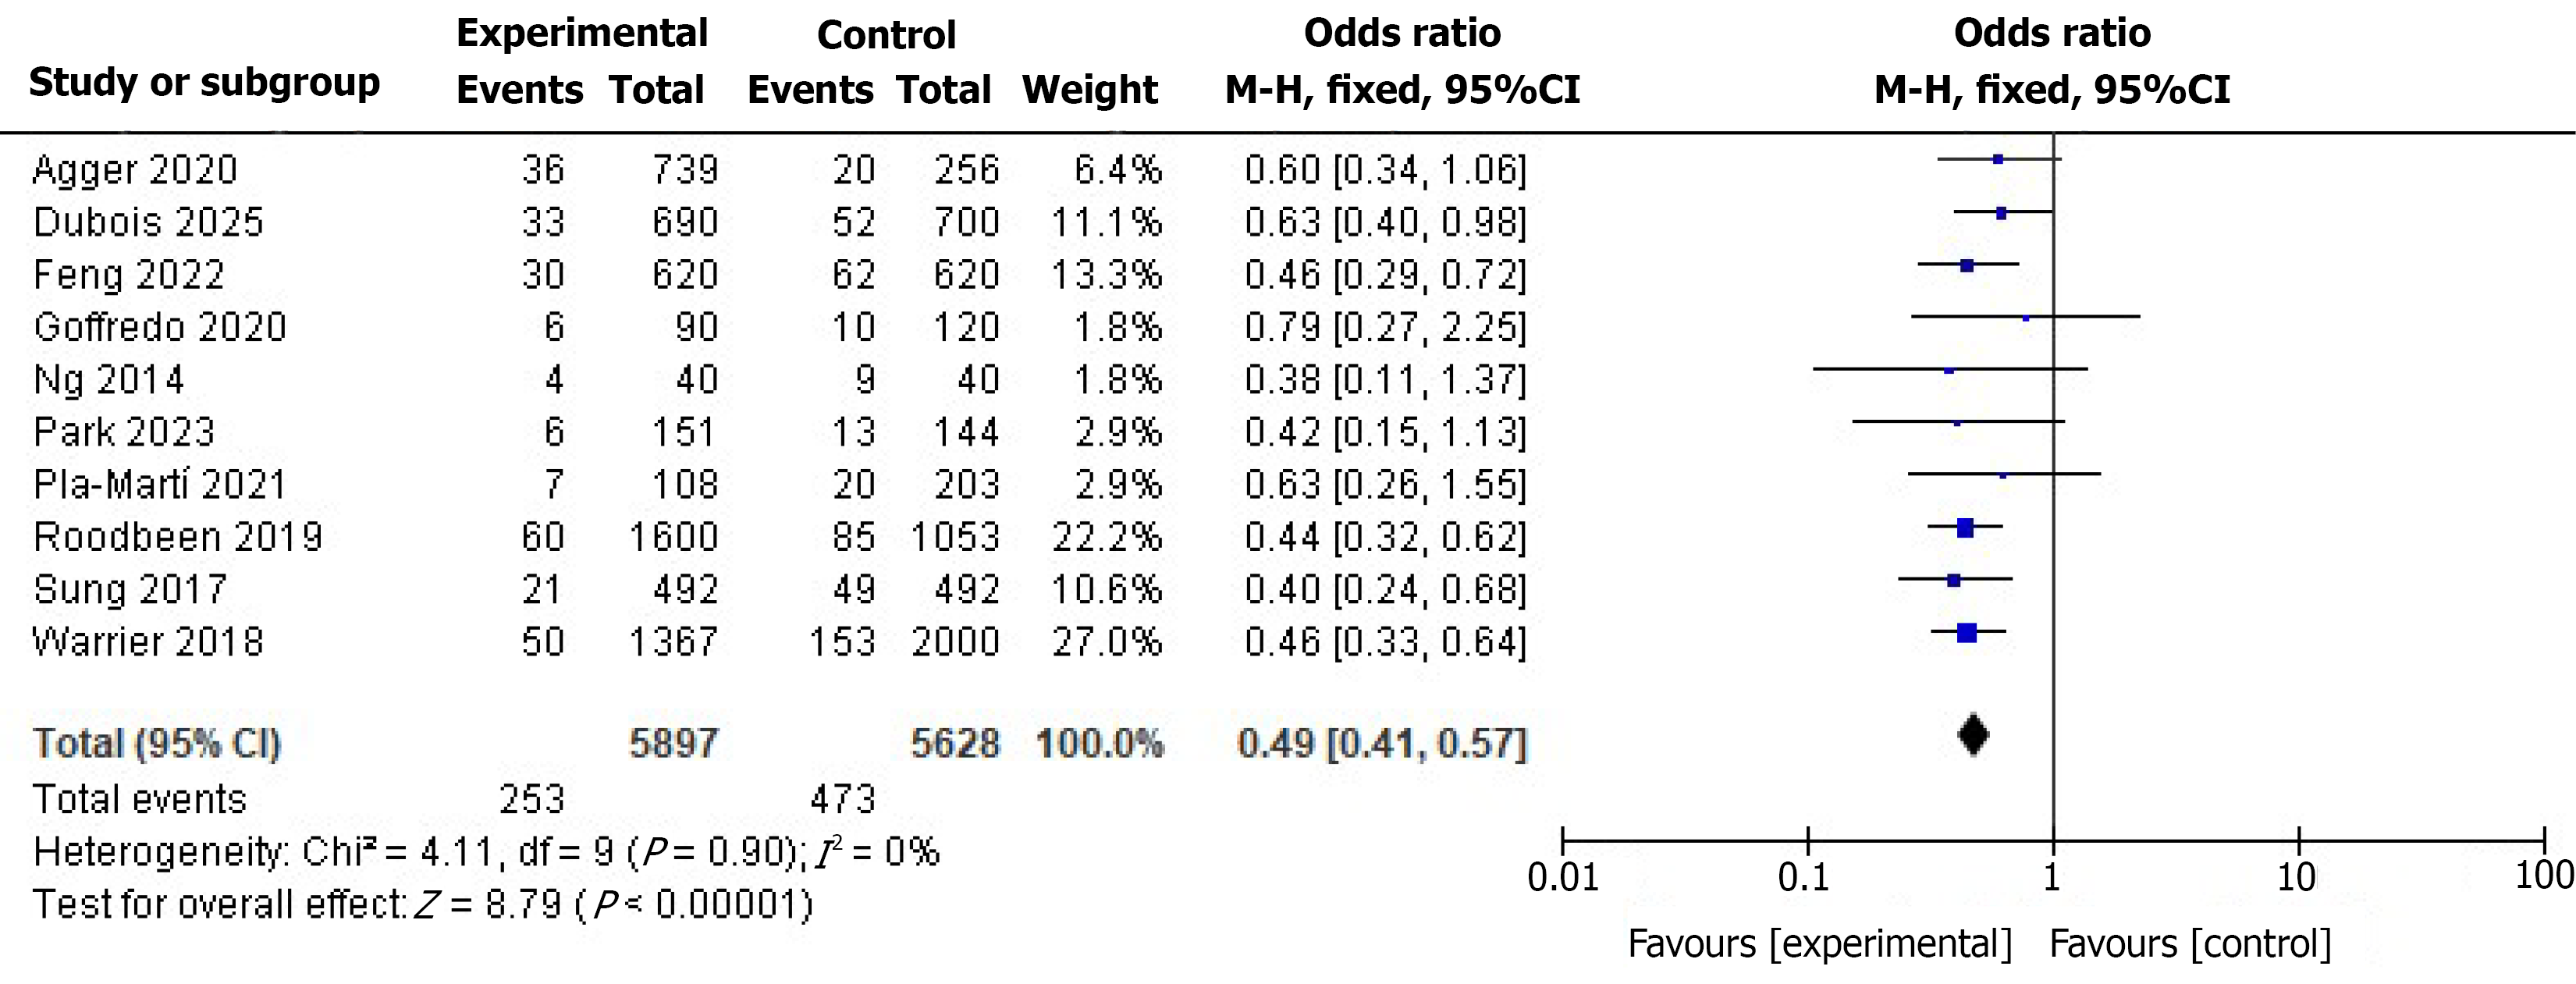
Figure 4 Forest plot of circumferential resection margin status and local recurrence with meta-regression analysis.
The forest plot demonstrates a strong association between positive circumferential resection margin and local recurrence (odds ratio = 4.28) across ten studies. Meta-regression further revealed that each 10-case annual increase in surgeon volume was independently associated with a 15% relative reduction in local recurrence risk (P = 0.008). 95%CI: 95% confidence interval.
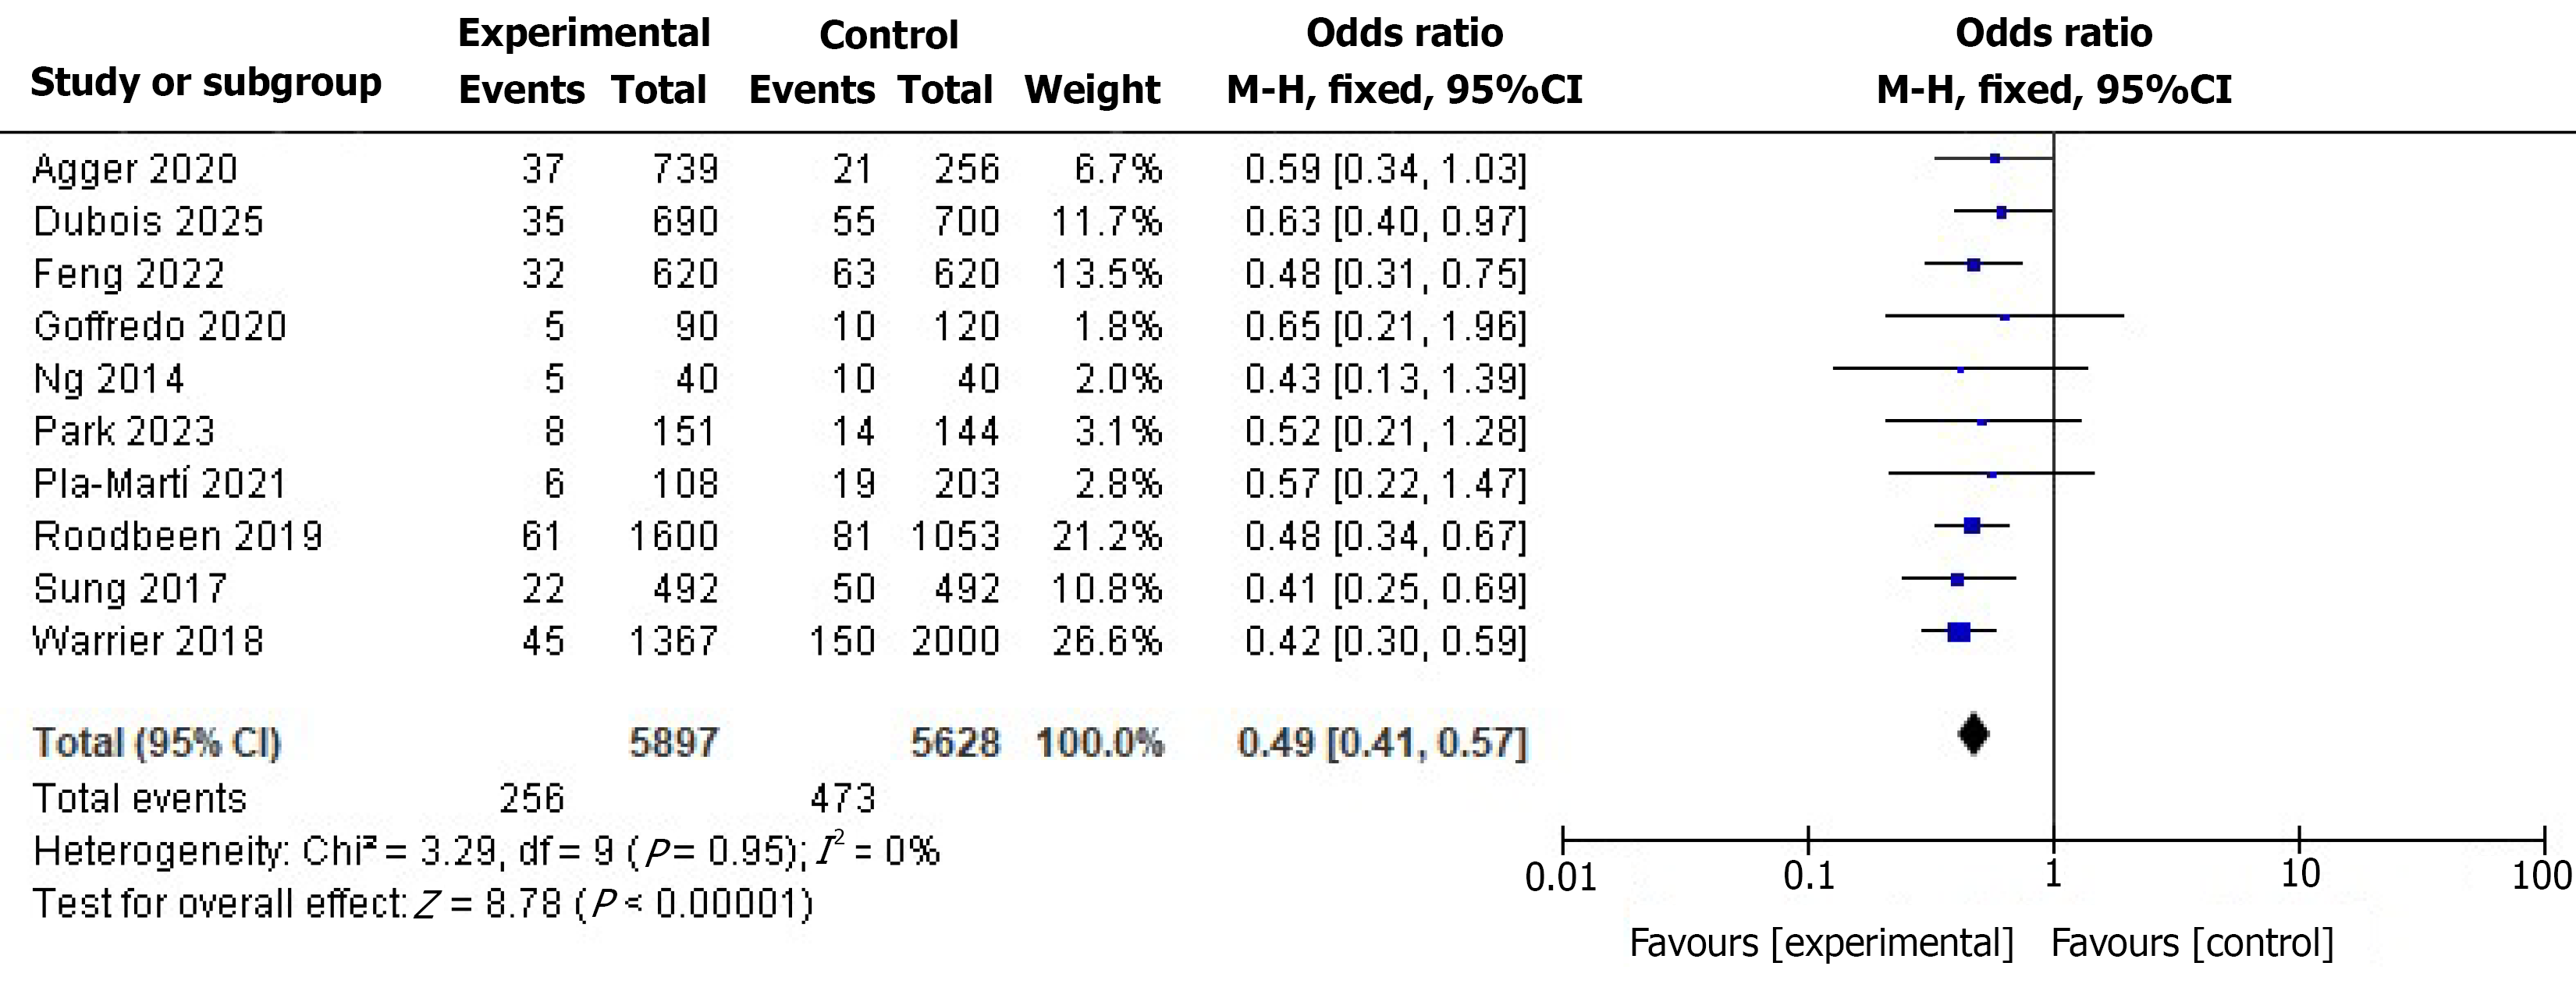
Figure 5 Forest plots of surgeon volume and hospital volume on local recurrence.
High-volume surgeons achieved significantly lower local recurrence rates compared to low-volume surgeons [odds ratio (OR) = 0.58], with intermediate-volume surgeons showing intermediate outcomes. High-volume hospitals similarly demonstrated reduced local recurrence vs low-volume centers (OR = 0.66), with the effect remaining significant after adjusting for surgeon volume. 95%CI: 95% confidence interval.
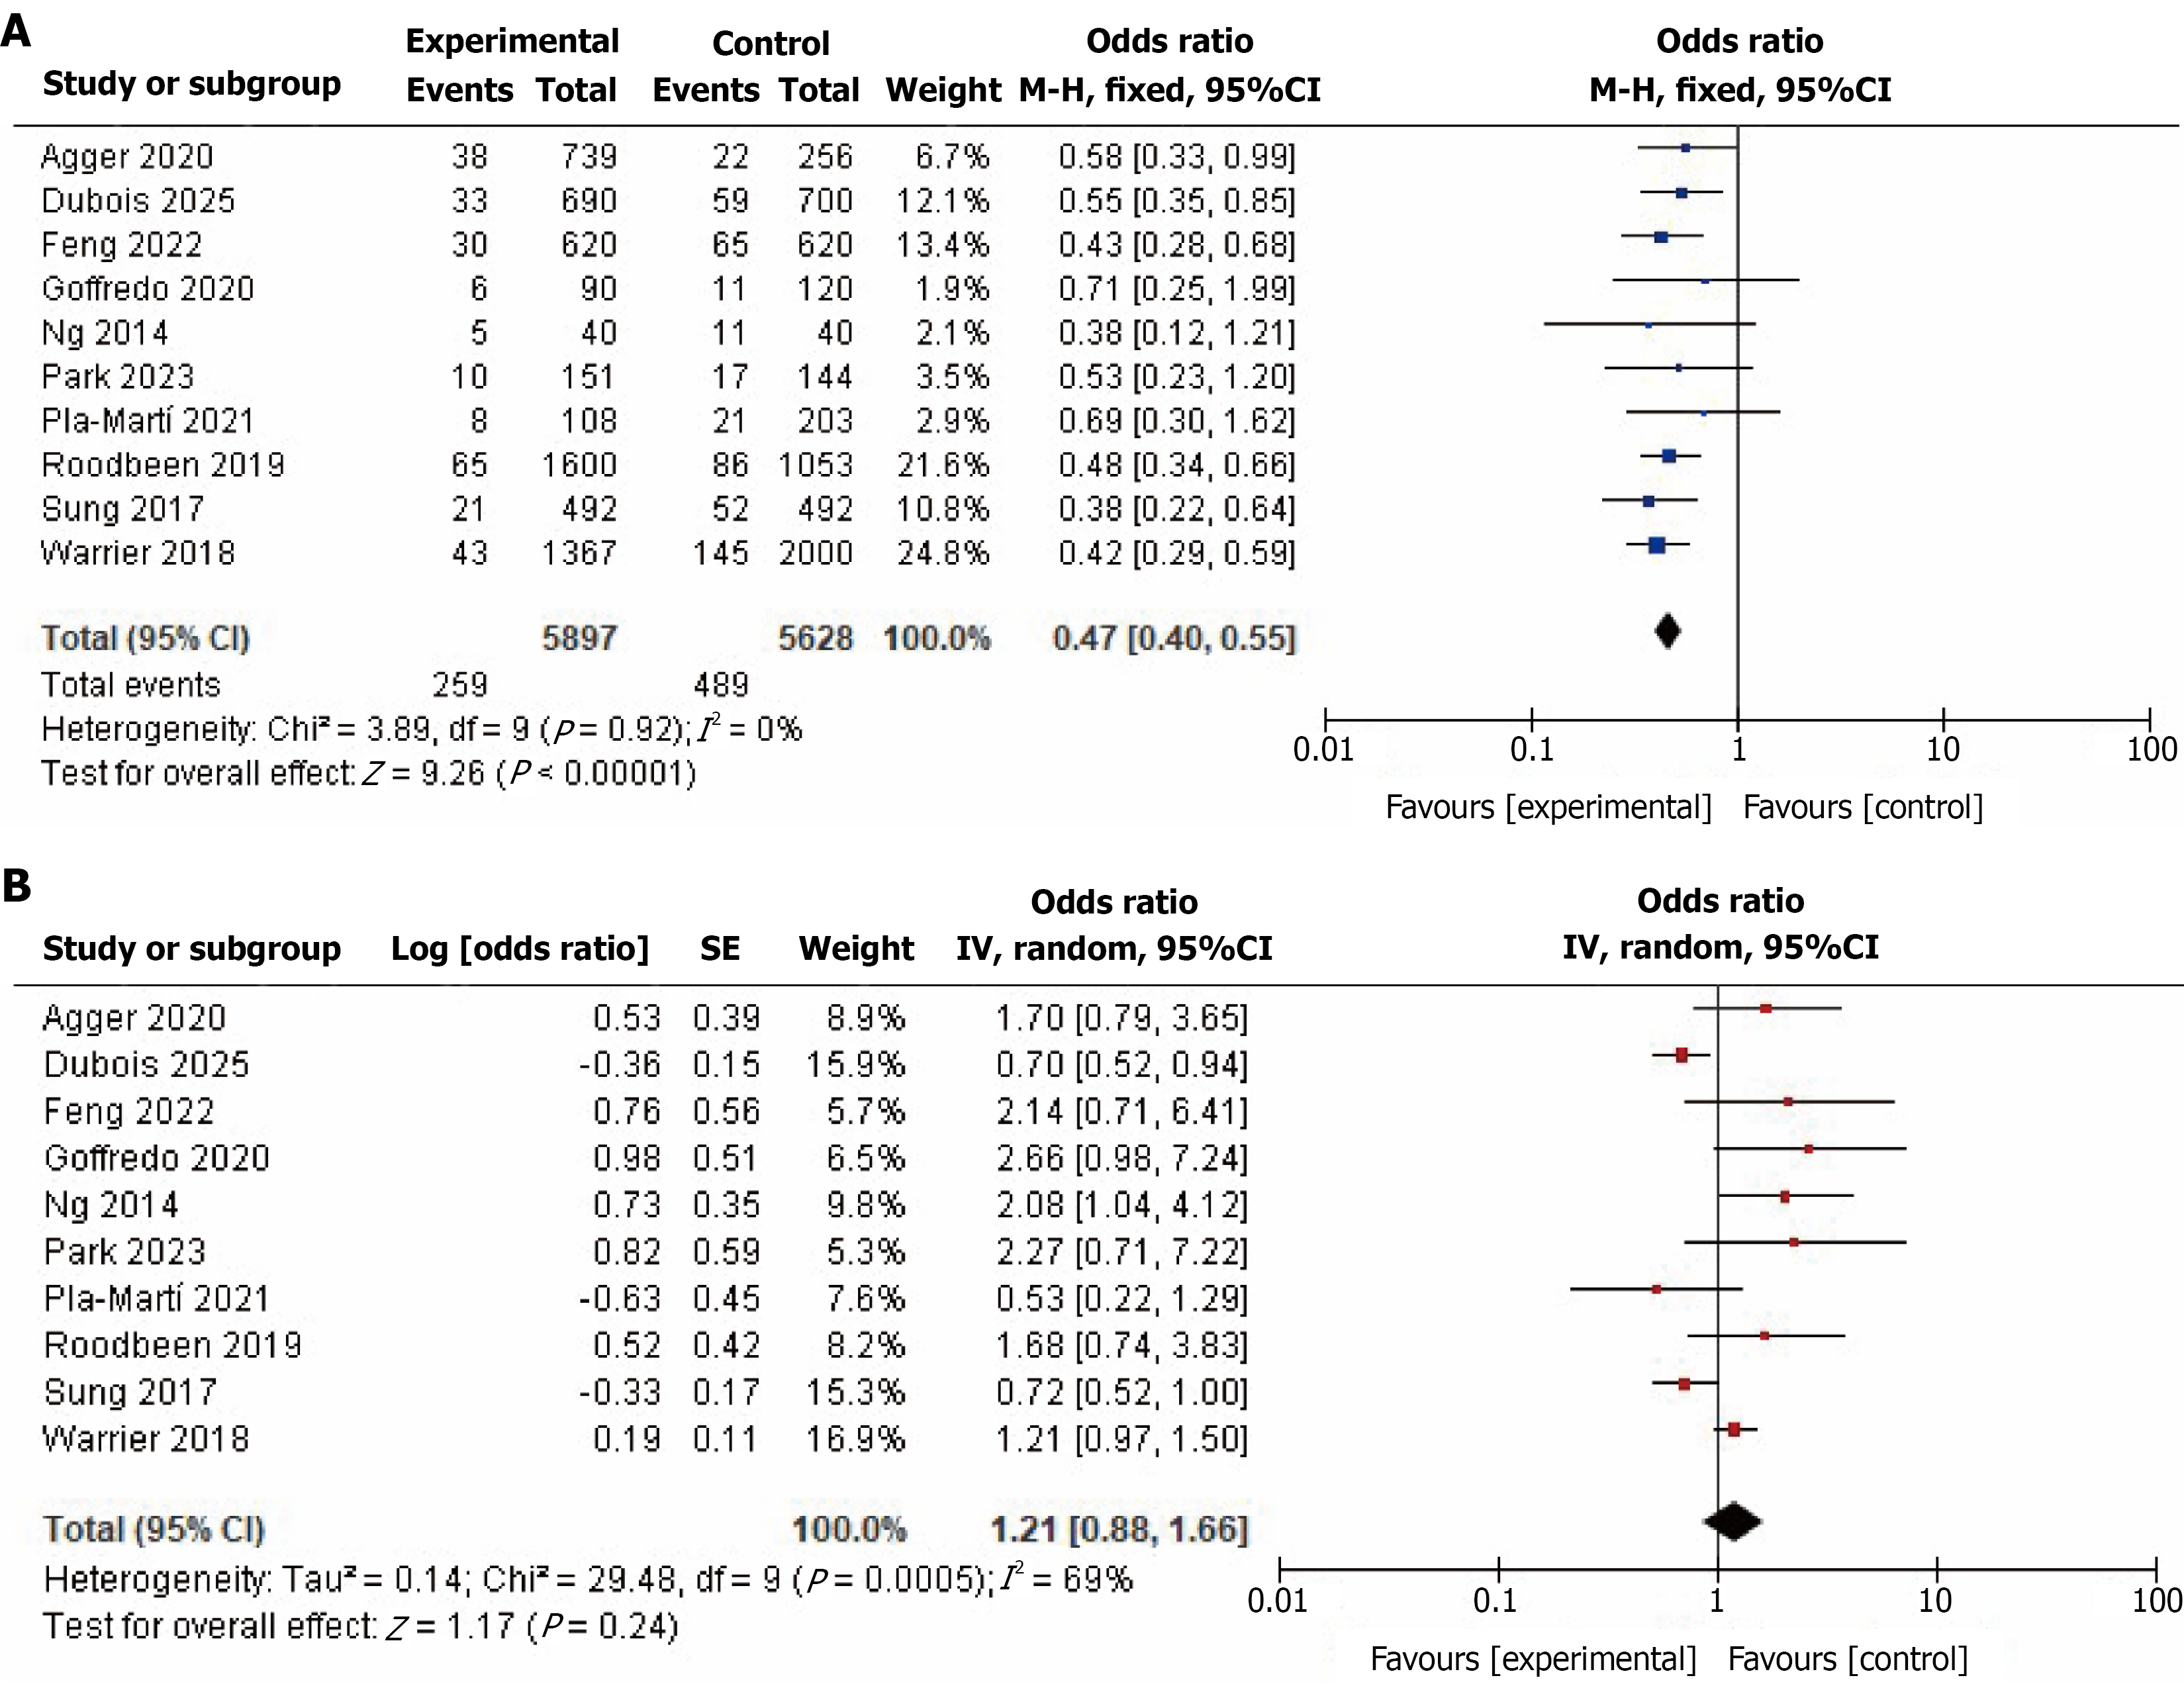
Figure 6 Association of operative time and circumferential resection margin status with oncological outcomes.
A: Prolonged operative time exceeding 240 minutes was associated with increased local recurrence risk (odds ratio = 1.52); however, meta-regression showed that this association was attenuated after controlling for total mesorectal excision quality (P = 0.18), suggesting that operative time may reflect technical difficulty rather than serve as an independent risk factor; B: Positive circumferential resection margin was associated with significantly worse disease-free survival [DFS; hazard ratio (HR) = 2.84; 5-year DFS 42.3% vs 71.8%] and overall survival (OS; HR = 2.56; 5-year OS 48.7% vs 76.4%) compared with negative circumferential resection margin. 95%CI: 95% confidence interval.
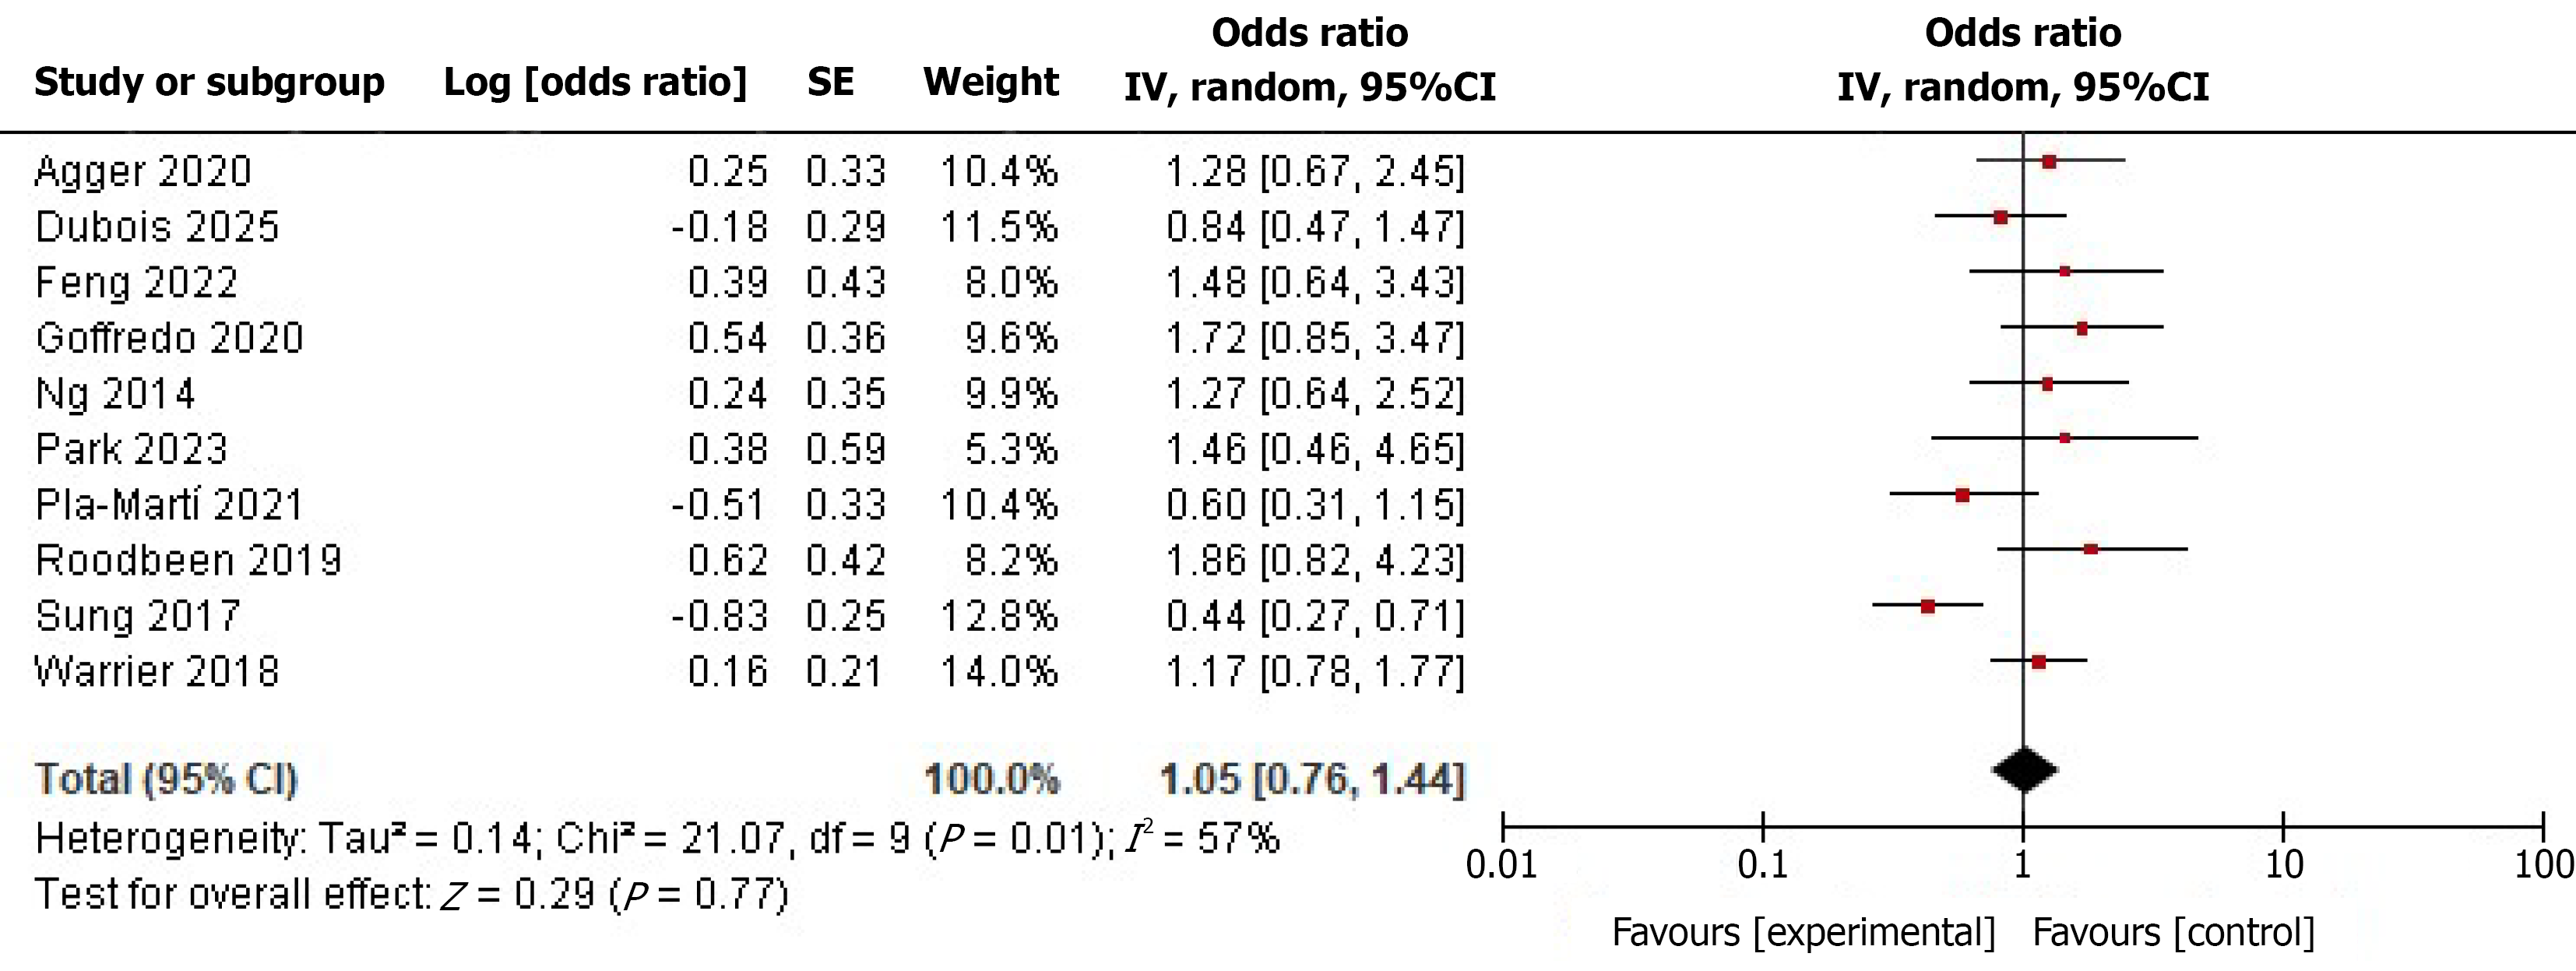
Figure 7 Forest plots of total mesorectal excision quality and surgeon volume on disease-free survival and overall survival.
Incomplete total mesorectal excision (TME) was associated with inferior disease-free survival [DFS; hazard ratio (HR) = 2.12] and overall survival (OS; HR = 1.89) relative to complete TME. High surgeon volume conferred improved DFS (HR = 0.72) and OS (HR = 0.68) compared to low-volume surgeons, consistent across all included studies. 95%CI: 95% confidence interval.
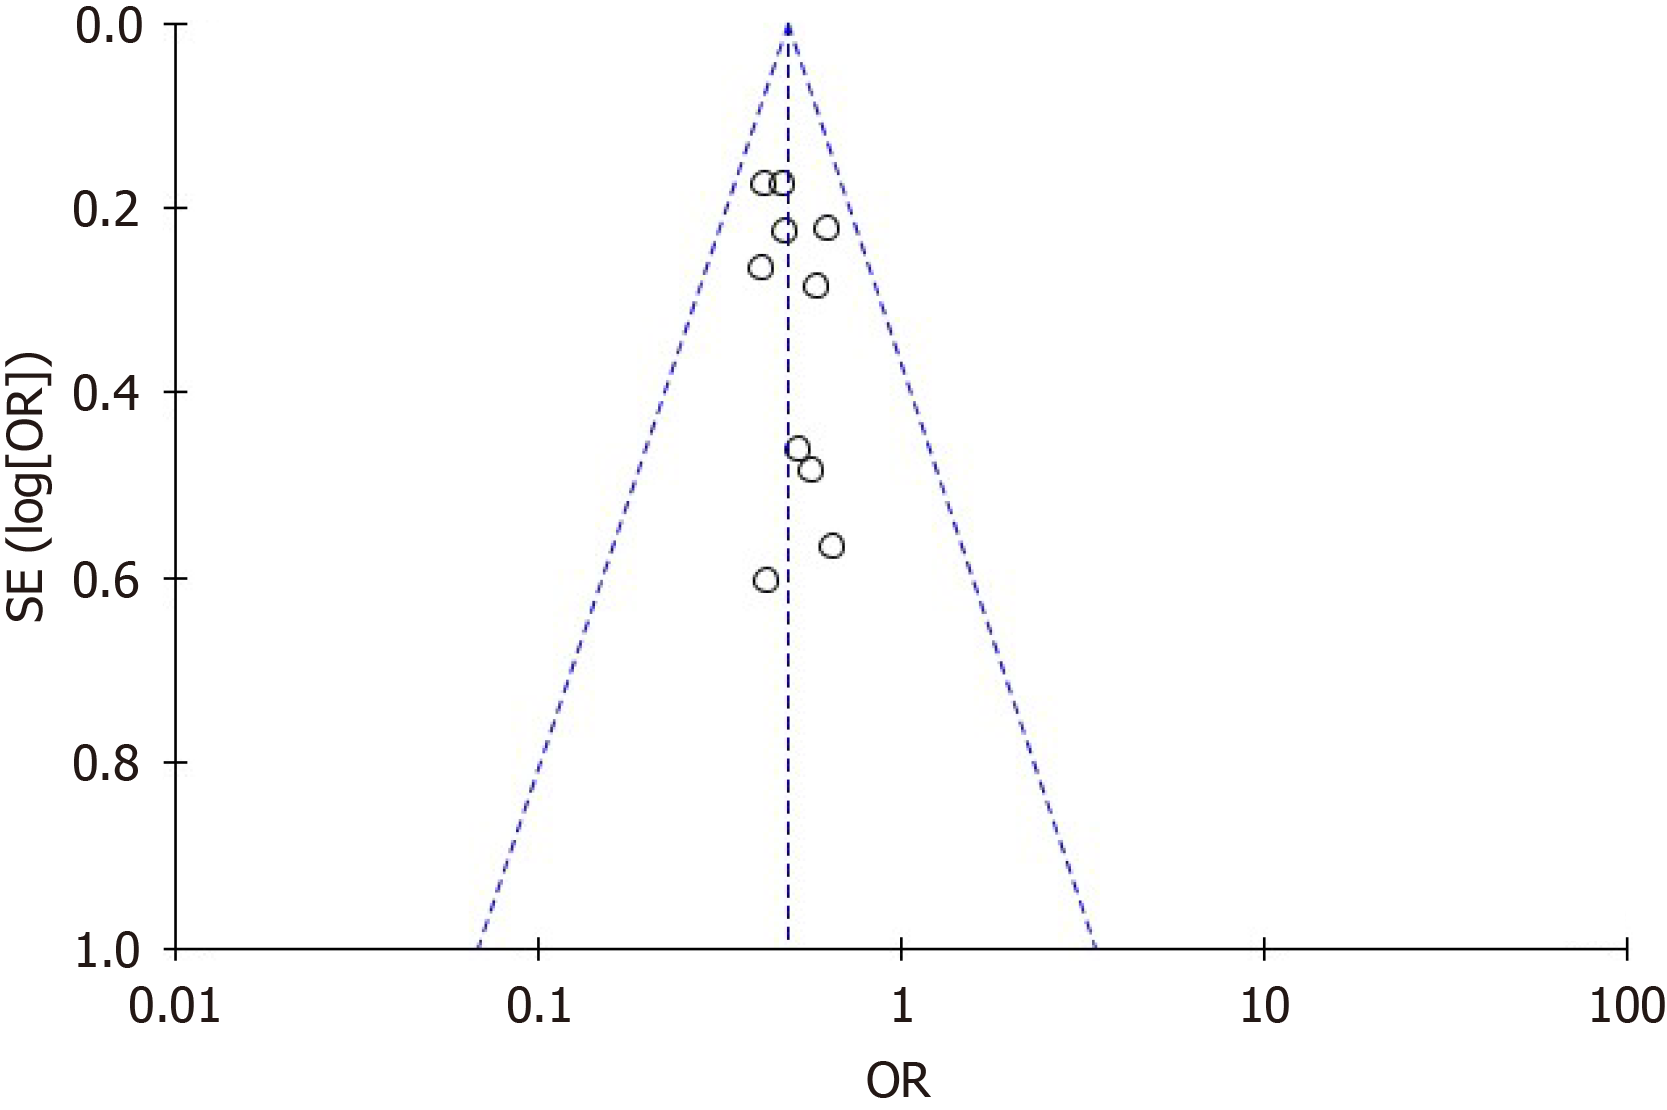
Figure 8 Funnel plots and publication bias assessment.
Funnel plots for all primary outcomes demonstrated approximate symmetry. Egger's regression test (P = 0.34) and Begg's test (P = 0.42) indicated no significant publication bias, and trim-and-fill analysis suggested no missing studies, confirming the robustness of pooled estimates. OR: Odds ratio.
- Citation: Wang JK, Yu CT, Qin BX, Cheng HB. Meta-analysis of surgical quality-related factors associated with local recurrence rate after rectal cancer surgery. World J Gastrointest Surg 2026; 18(8): 119417
- URL: https://www.wjgnet.com/1948-9366/full/v18/i8/119417.htm
- DOI: https://dx.doi.org/10.4240/wjgs.119417