
















Copyright: ©Author(s) 2026.
World J Gastrointest Surg. Aug 27, 2026; 18(8): 119341
Published online Aug 27, 2026. doi: 10.4240/wjgs.119341
Published online Aug 27, 2026. doi: 10.4240/wjgs.119341
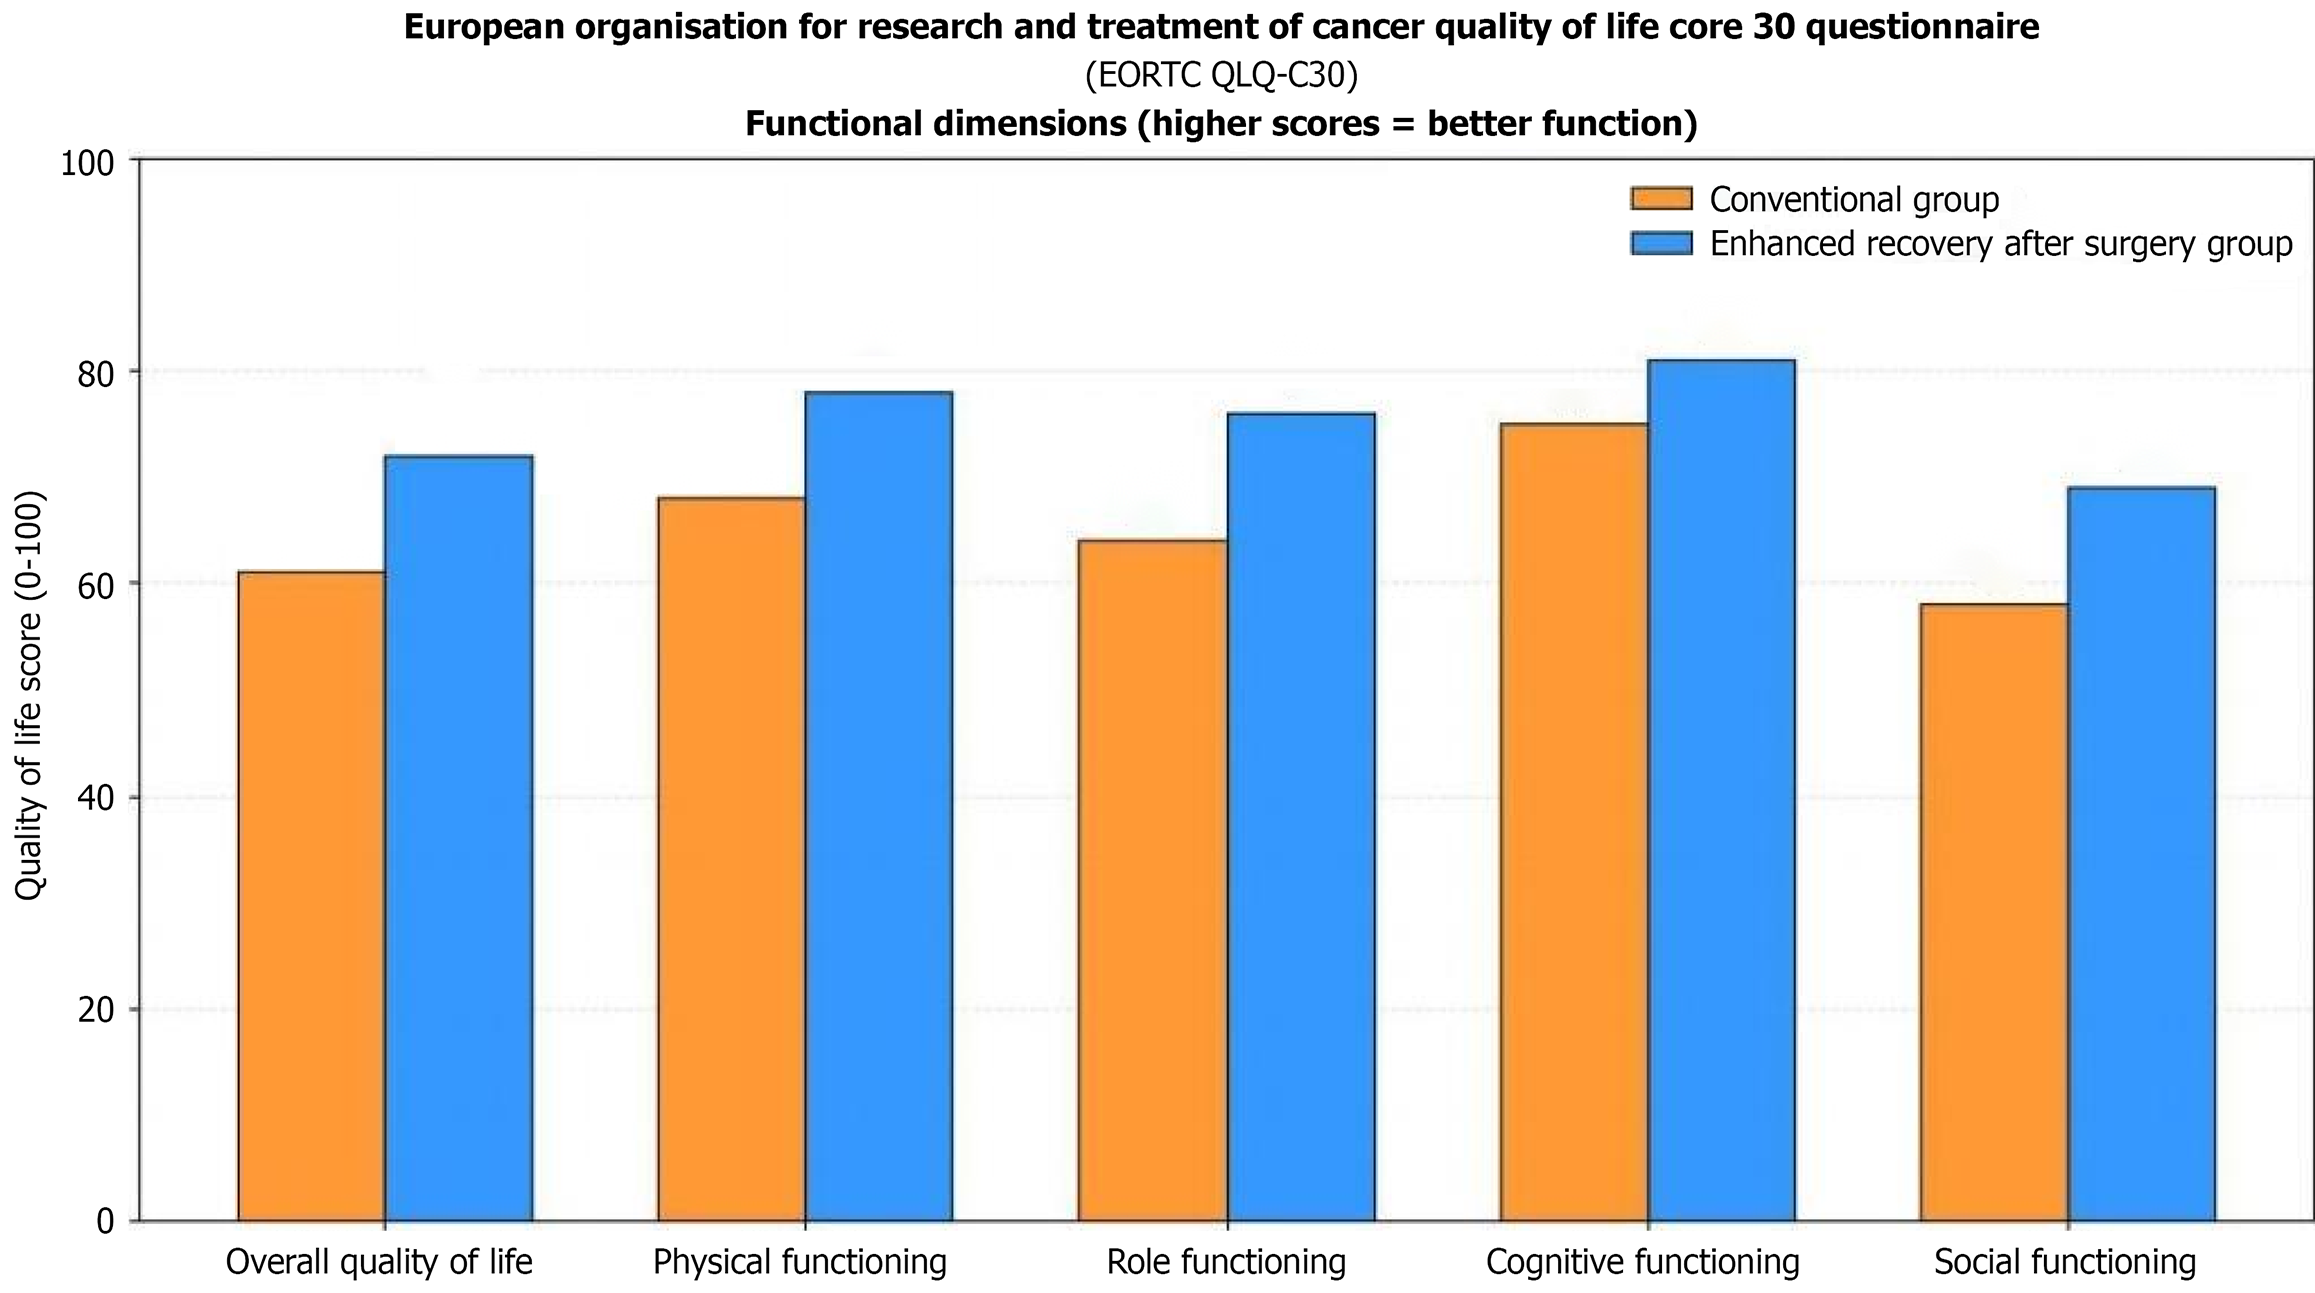
Figure 1 Comparison of European Organisation for Research and Treatment of Cancer Quality of Life Questionnaire functional scales between conventional and enhanced recovery after surgery groups at 14 days postoperatively.
The bar chart displays quality of life functional domain scores using the European Organisation for Research and Treatment of Cancer Quality of Life Questionnaire. Higher scores indicate better functioning. The nutritional risk-guided intervention group (blue bars, n = 40) outperformed the conventional group (orange bars, n = 40) across all functional domains: Overall quality of life (72.8 ± 8.4 vs 61.5 ± 9.7), physical functioning (78.6 ± 7.2 vs 68.9 ± 8.5). EORTC QLQ-C30: European Organisation for Research and Treatment of Cancer Quality of Life Questionnaire.
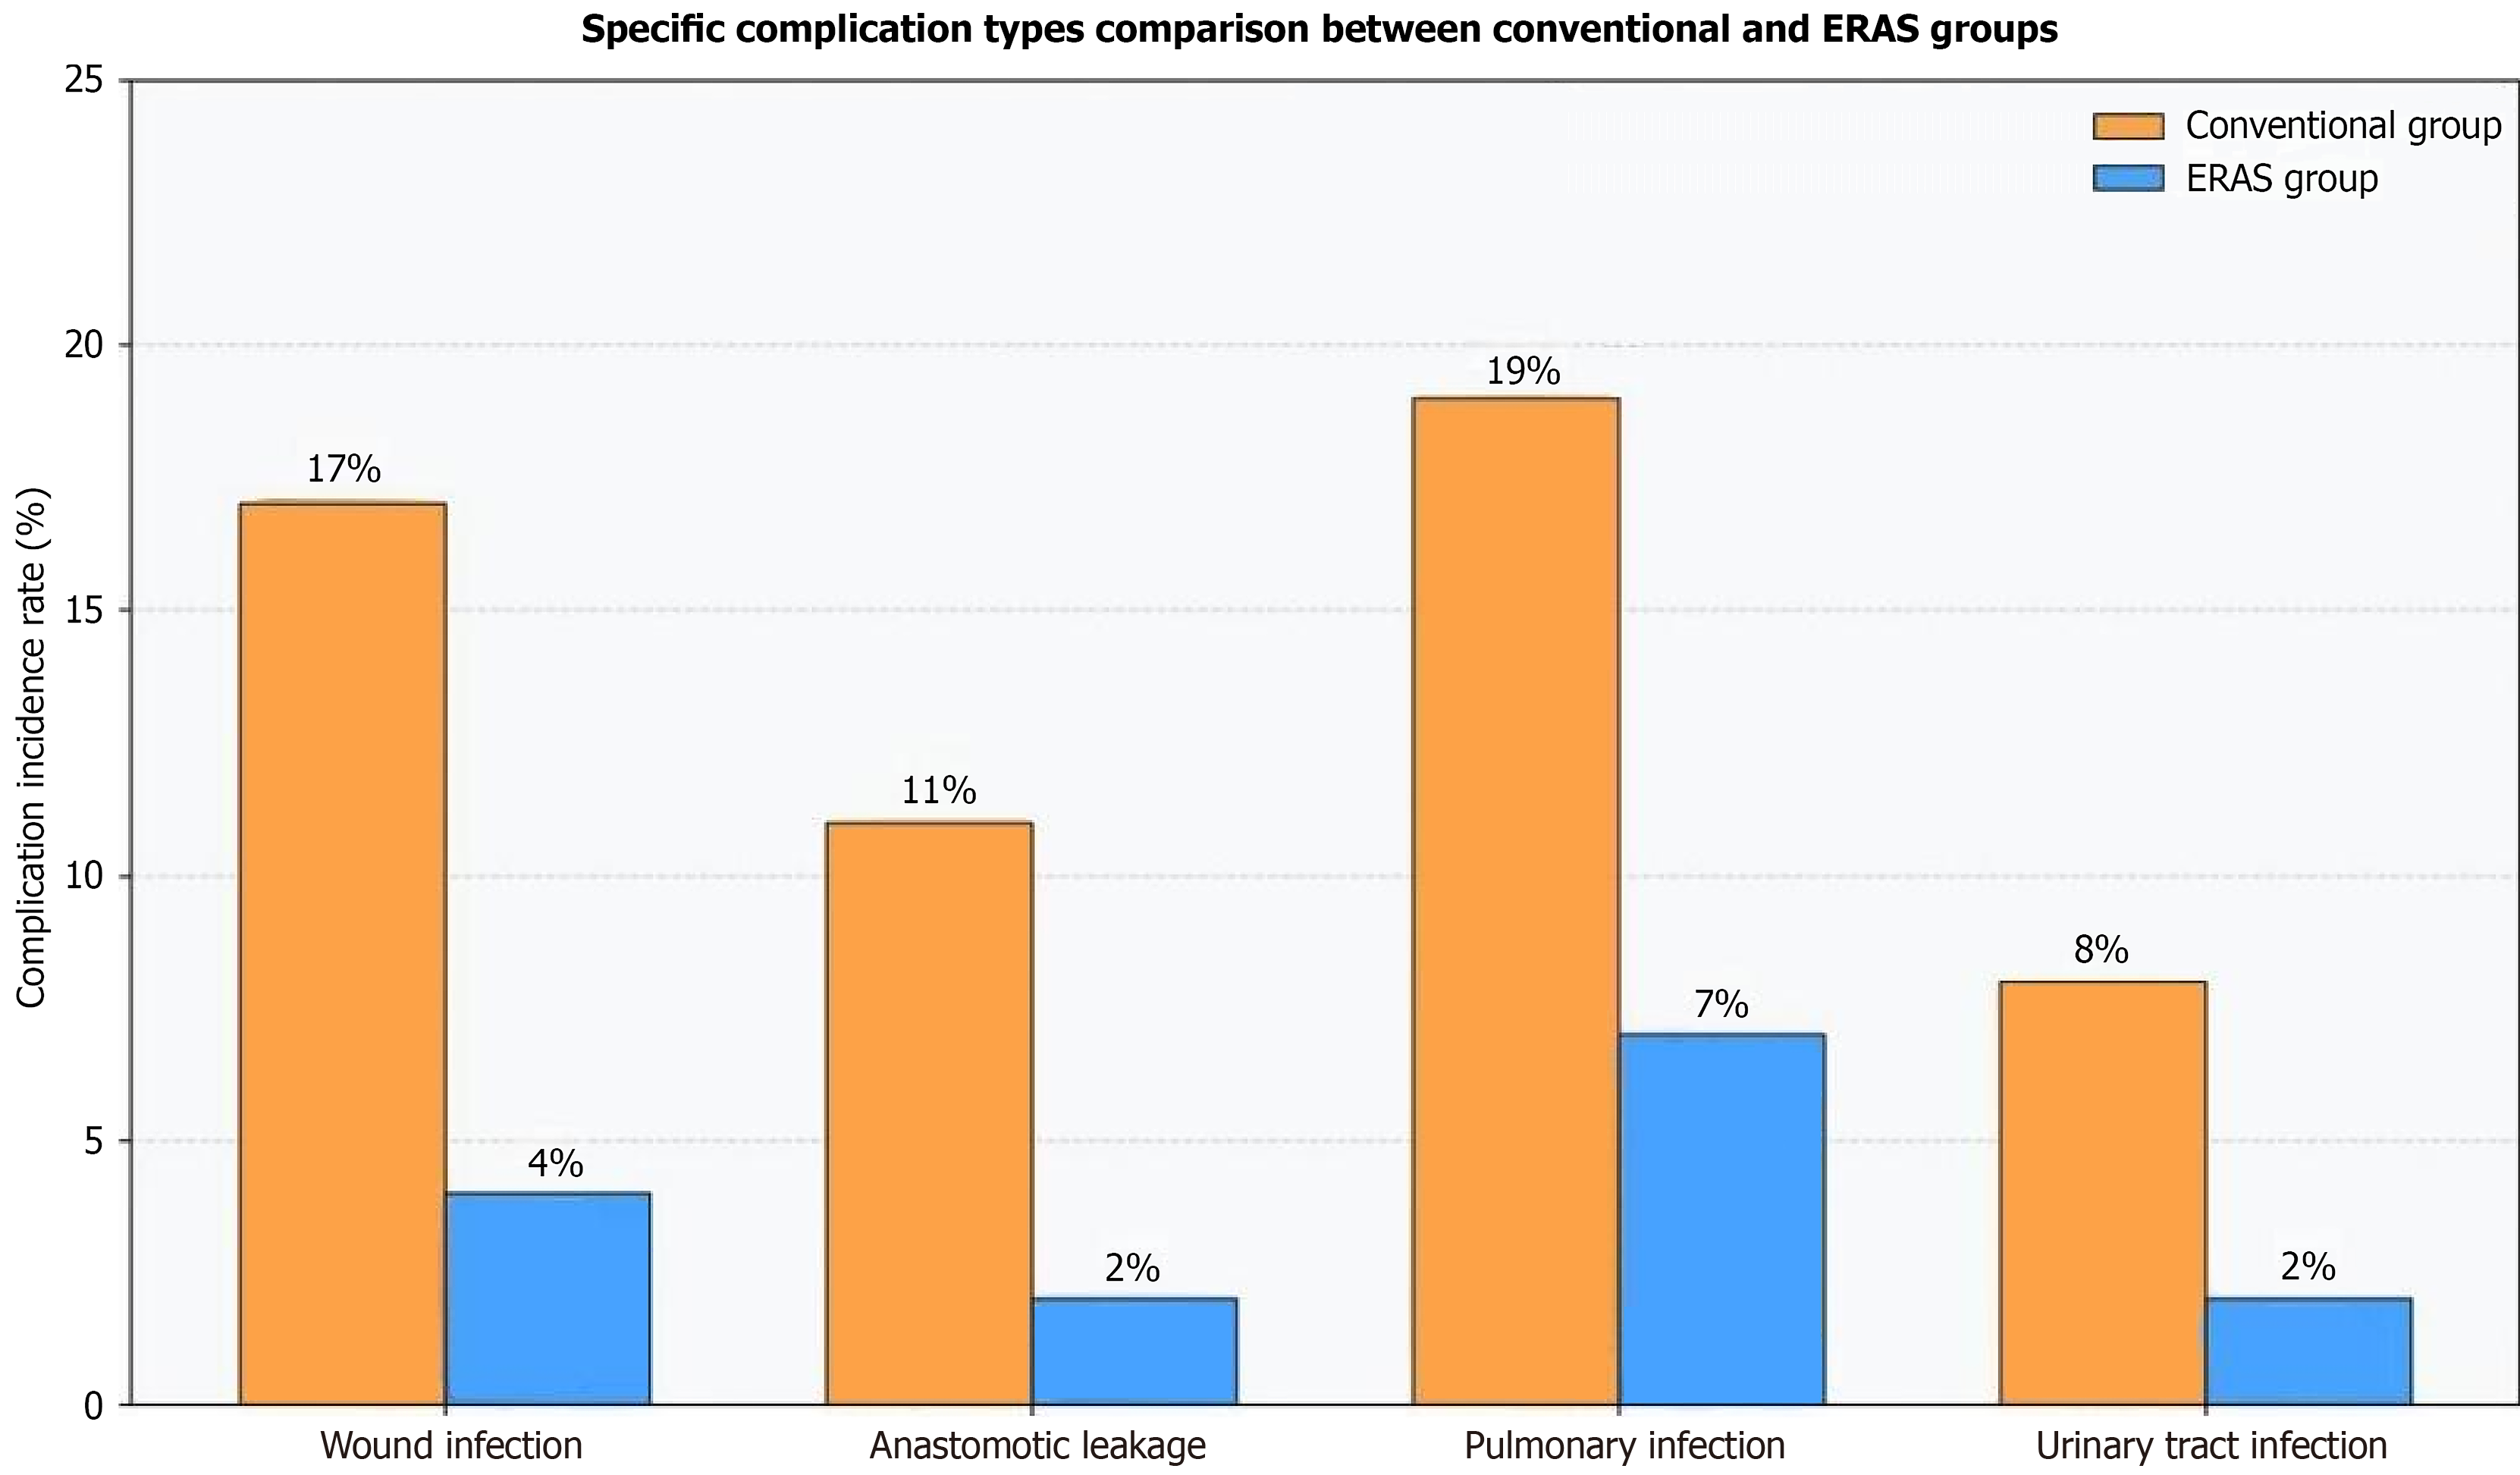
Figure 2 Comparison of specific postoperative complication types between conventional and enhanced recovery after surgery groups.
The bar chart displays the incidence rates of four major postoperative complications. The nutritional risk (NR)-guided intervention group (blue bars, n = 40) showed significantly lower complication rates than the conventional group (orange bars, n = 40) across all complication types: Wound infection (4.5% vs 16.7%, P < 0.05), anastomotic leakage (2.3% vs 11.1%, P < 0.05), pulmonary infection (6.8% vs 19.4%, P < 0.05), and urinary tract infection (2.3% vs 8.3%, P > 0.05). Pulmonary infection was the most common complication in the conventional group, while the NR-guided intervention group showed consistently low incidence rates across all complication types. ERAS: Enhanced recovery after surgery.
- Citation: Zhang XL, Hong QQ, Lin LZ. Clinical effects of nutritional risk screening 2002-guided individualized nutritional intervention in postoperative colorectal cancer patients: A time-period comparison study. World J Gastrointest Surg 2026; 18(8): 119341
- URL: https://www.wjgnet.com/1948-9366/full/v18/i8/119341.htm
- DOI: https://dx.doi.org/10.4240/wjgs.119341