
















Copyright: ©Author(s) 2026.
World J Gastrointest Surg. Aug 27, 2026; 18(8): 118525
Published online Aug 27, 2026. doi: 10.4240/wjgs.118525
Published online Aug 27, 2026. doi: 10.4240/wjgs.118525
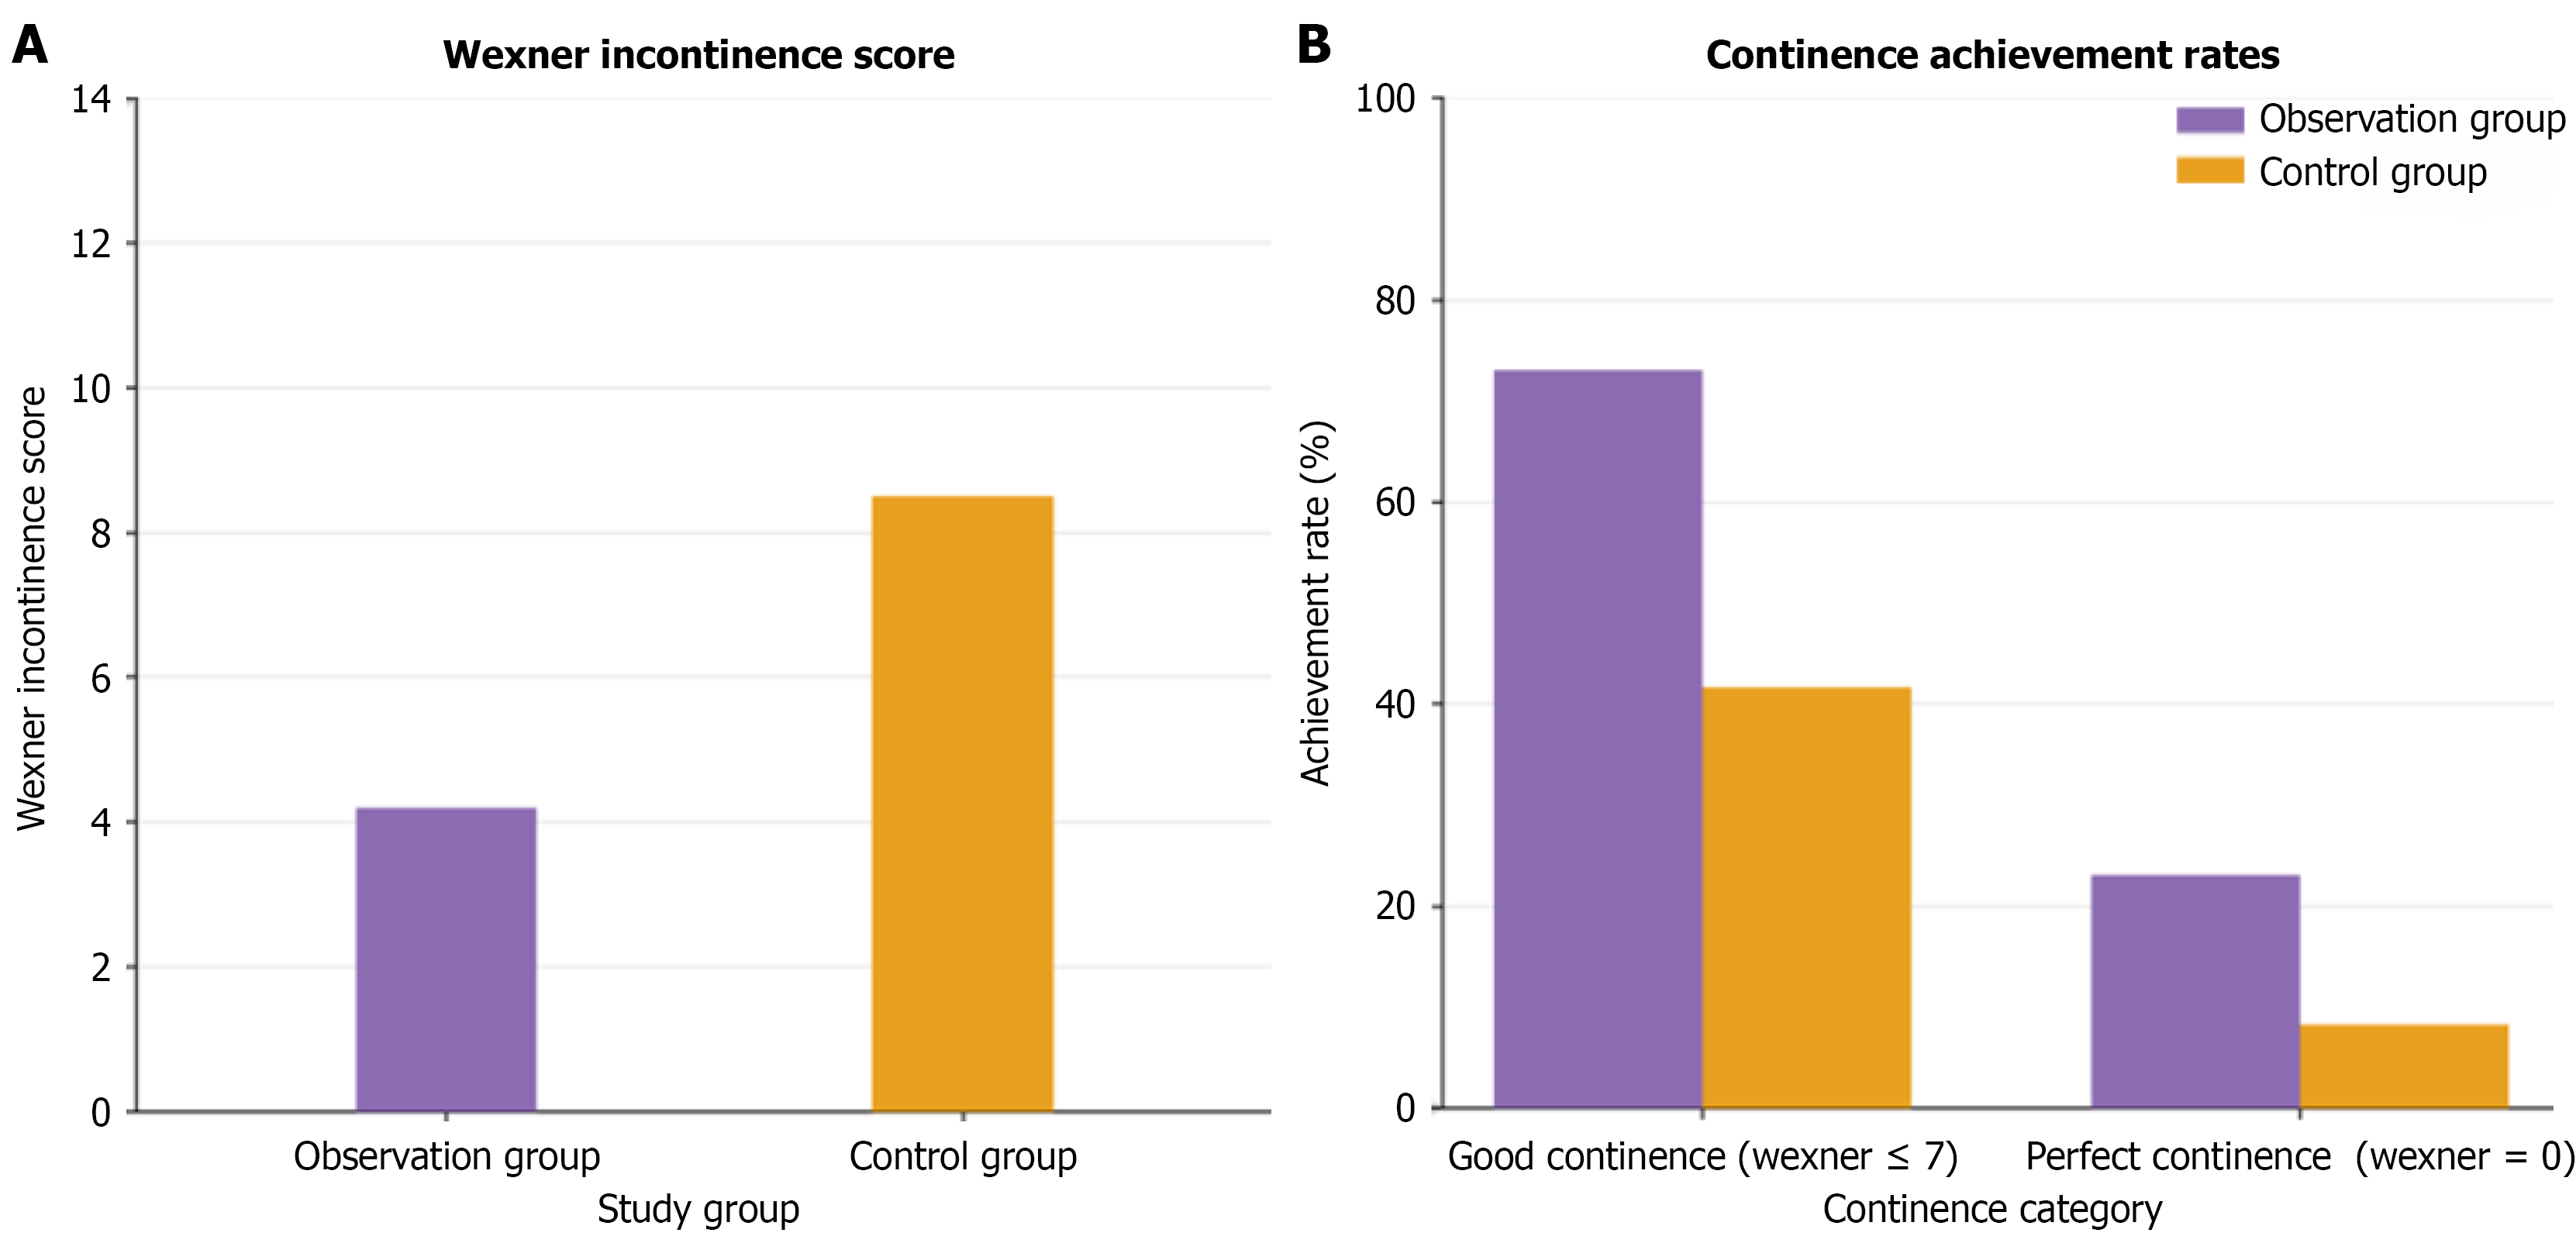
Figure 1 Fecal continence outcomes at 6 months post-colostomy closure.
A: Wexner incontinence score: Bar graph comparing mean Wexner incontinence scores between the observation group (n = 52, purple) receiving pelvic floor muscle rehabilitation training and control group (n = 48, yellow) receiving standard postoperative care. Error bars represent SD. The observation group demonstrated significantly lower incontinence scores (4.2 ± 1.8 vs 8.5 ± 2.3, P < 0.001); B: Continence achievement rates: Bar graph showing the percentage of patients achieving good continence (Wexner score ≤ 7) and perfect continence (Wexner score = 0) in each group. Numbers within bars indicate patient counts. The observation group achieved significantly higher rates of both good continence (73.1% vs 41.7%, P = 0.001) and perfect continence (23.1% vs 8.3%, P = 0.047) compared to controls.
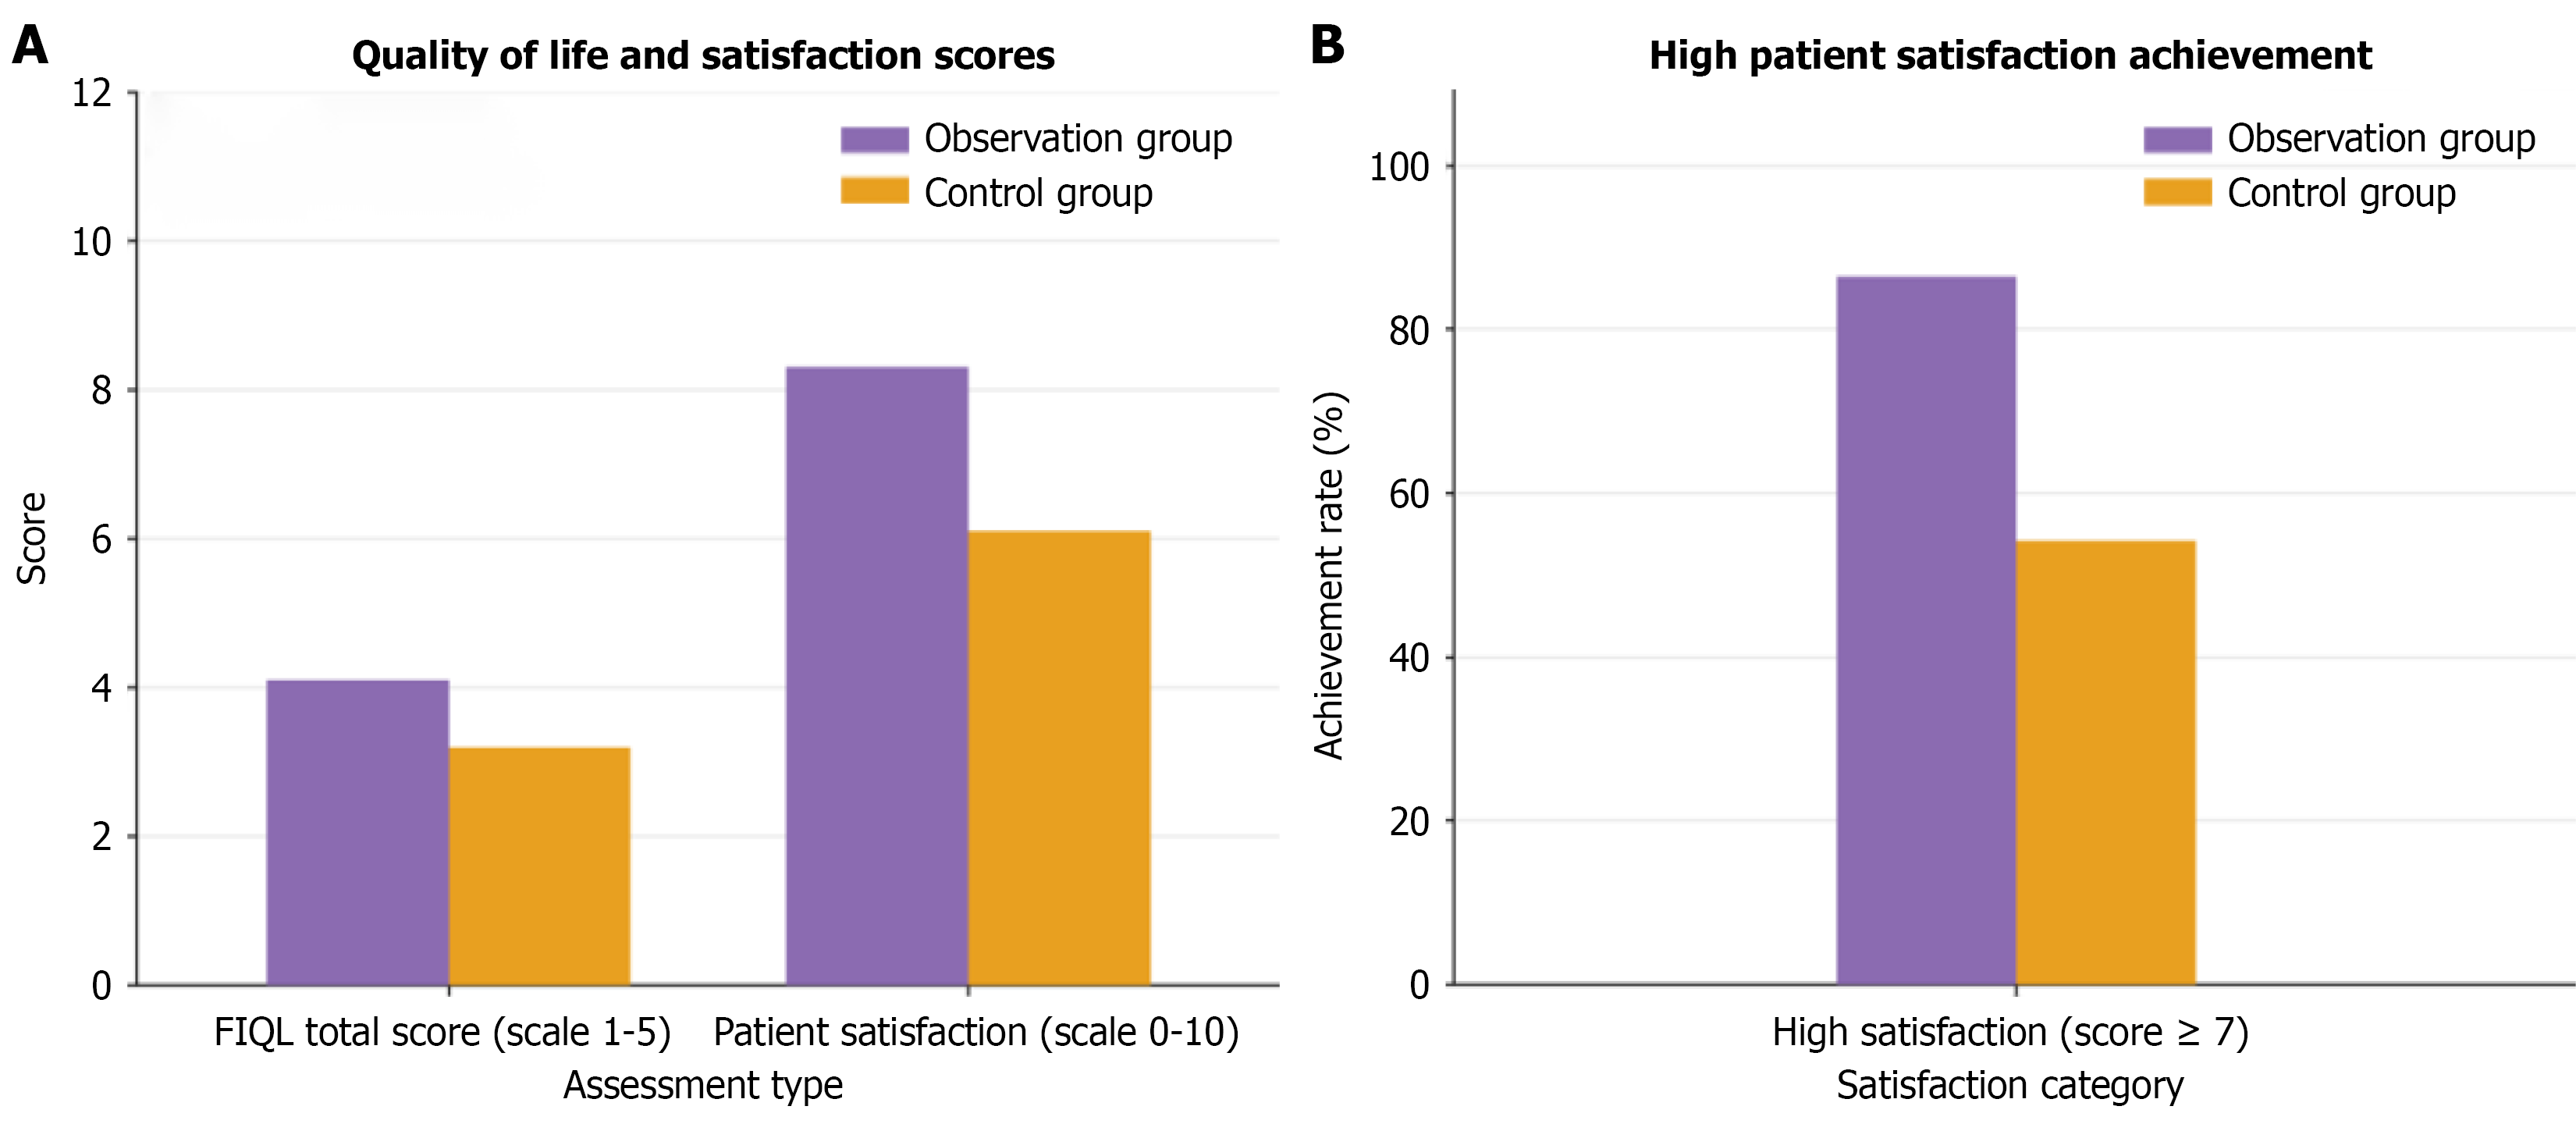
Figure 2 Quality of life and patient satisfaction at 6 months.
A: Fecal Incontinence Quality of Life Scale total scores and patient satisfaction scores with standard deviation error bars; B: Percentage of patients achieving high satisfaction (score ≥ 7). Purple bars: Observation group (n = 52, pelvic floor rehabilitation); yellow bars: Control group (n = 48, standard care). Numbers in bars represent patient counts. Green arrow indicates improvement magnitude. P values from independent t-test (A) and χ2 test (B).
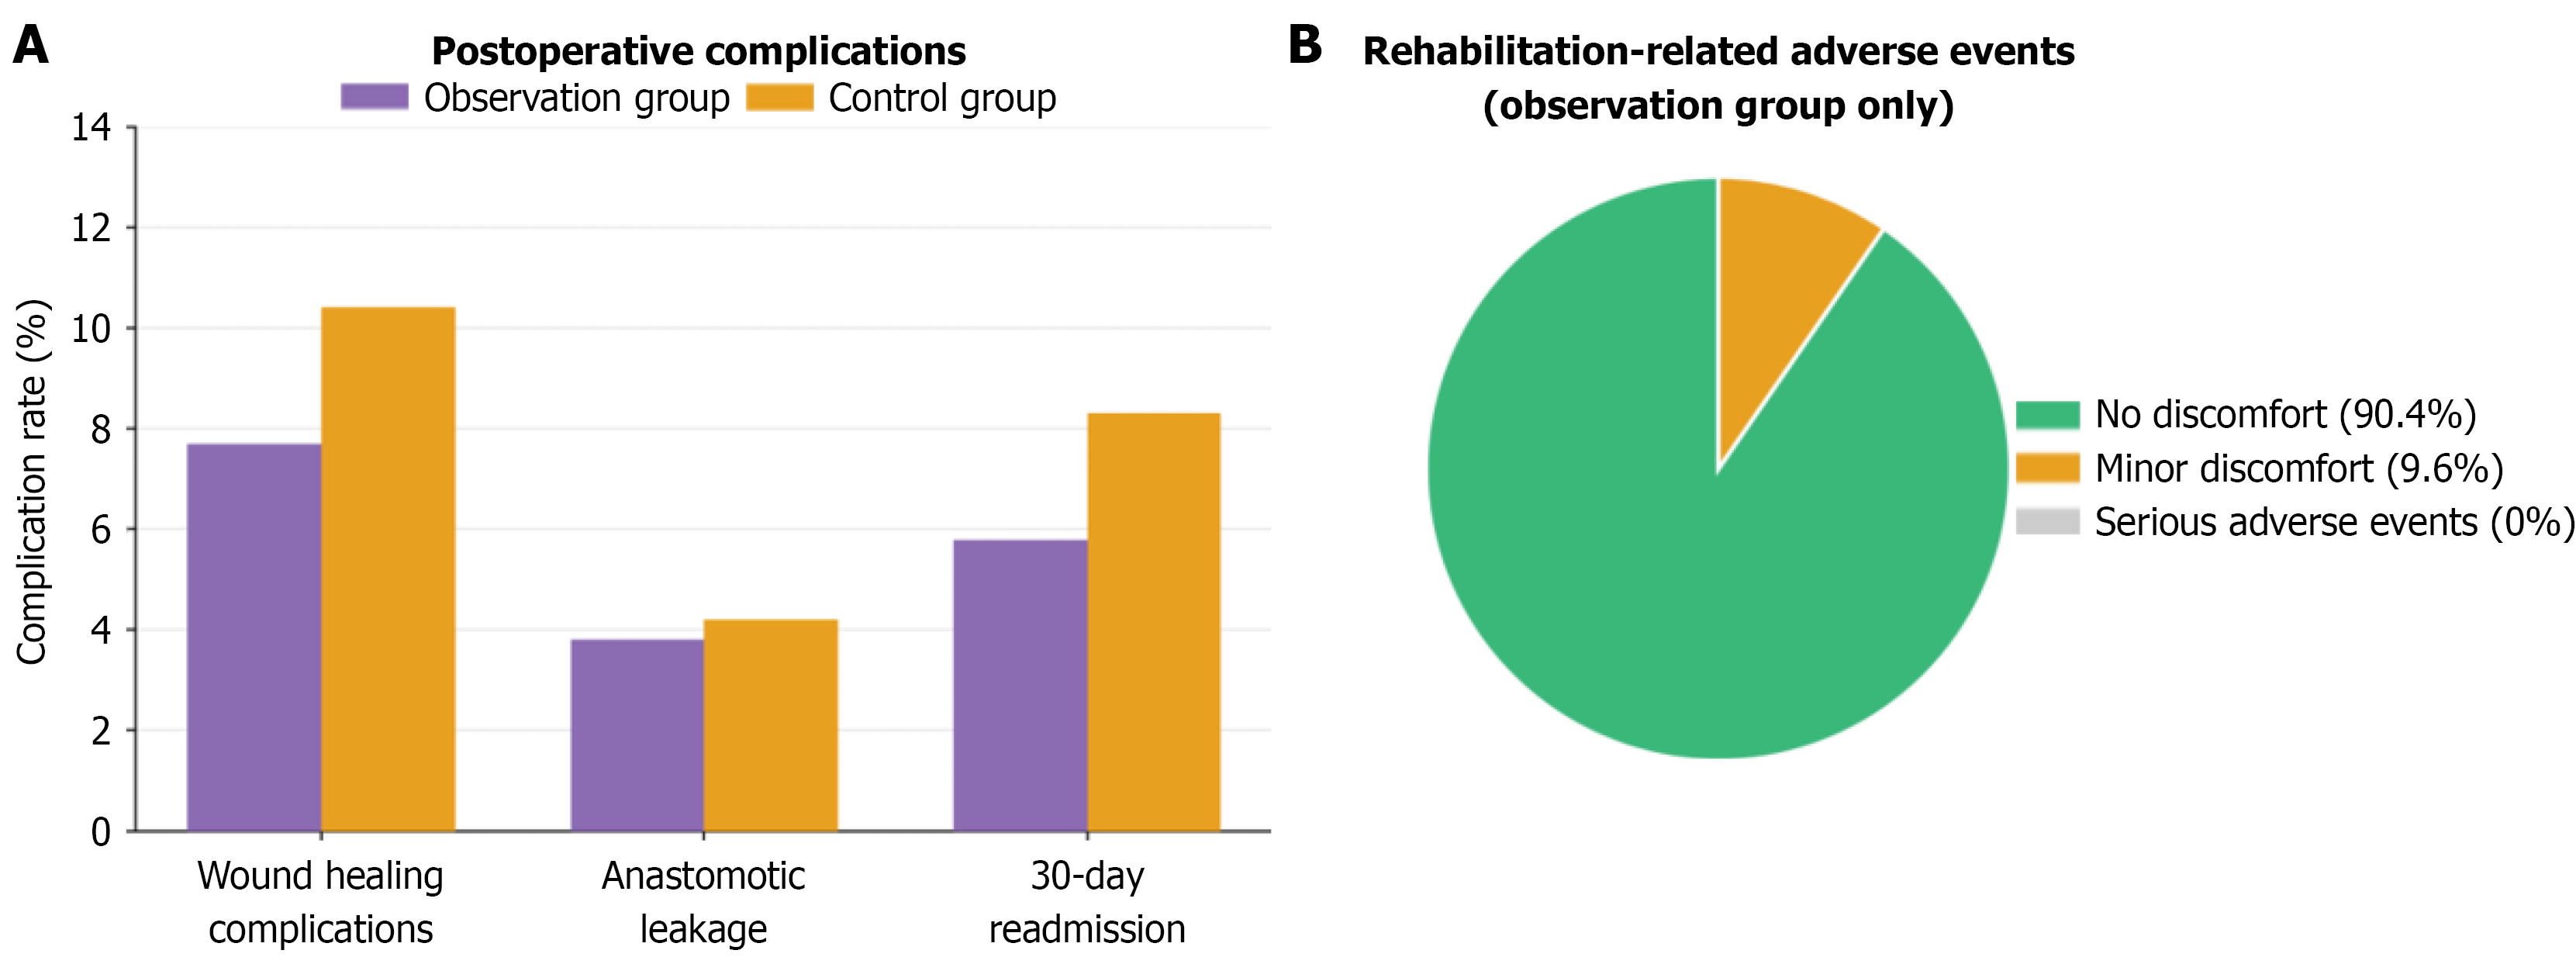
Figure 3 Safety outcomes.
A: Postoperative complication rates showing no significant differences between groups; B: Rehabilitation adverse events in observation group: 90.4% no discomfort, 9.6% minor discomfort (resolved), 0% serious events. Purple: Observation group (n = 52); yellow: Control group (n = 48).
- Citation: Liu XJ, Wei ML, Liu LL, Qin JJ. Pelvic floor rehabilitation improves anorectal function after sphincter-preserving surgery for low rectal cancer. World J Gastrointest Surg 2026; 18(8): 118525
- URL: https://www.wjgnet.com/1948-9366/full/v18/i8/118525.htm
- DOI: https://dx.doi.org/10.4240/wjgs.118525