
















Copyright: ©Author(s) 2026.
World J Gastrointest Surg. Jul 27, 2026; 18(7): 121291
Published online Jul 27, 2026. doi: 10.4240/wjgs.v18.i7.121291
Published online Jul 27, 2026. doi: 10.4240/wjgs.v18.i7.121291
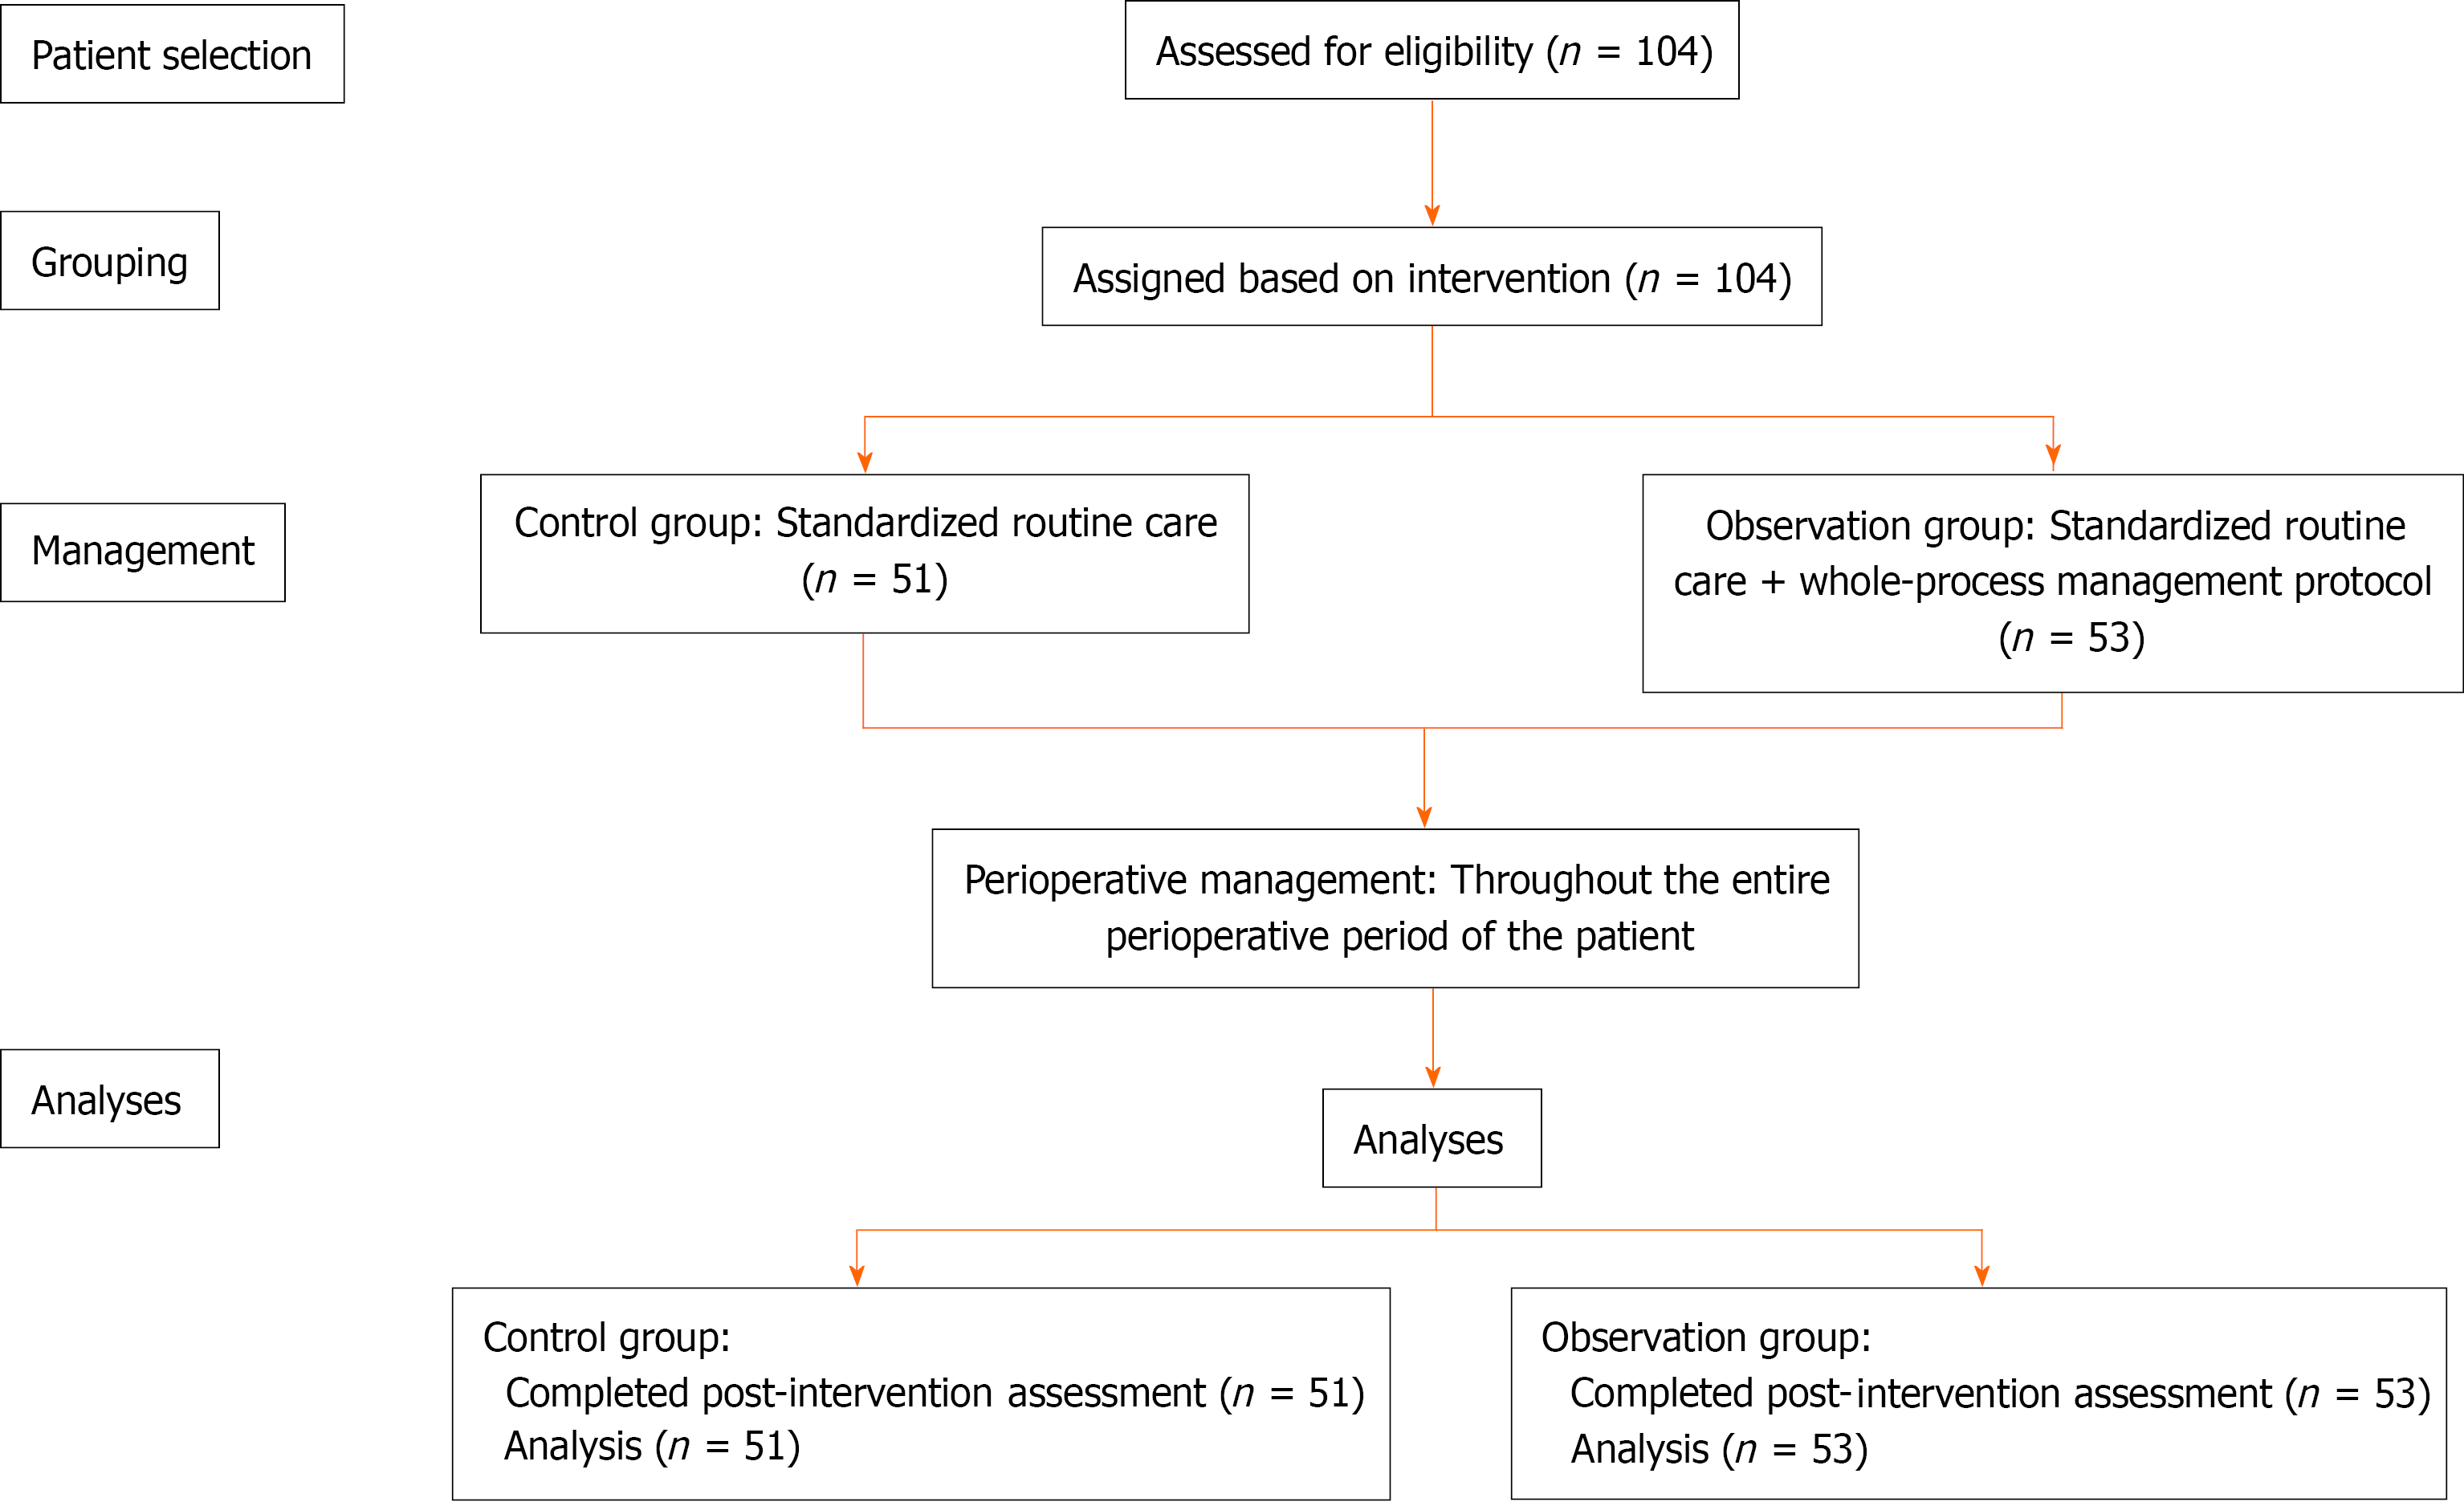
Figure 1
Flow diagram of patient selection and grouping process.
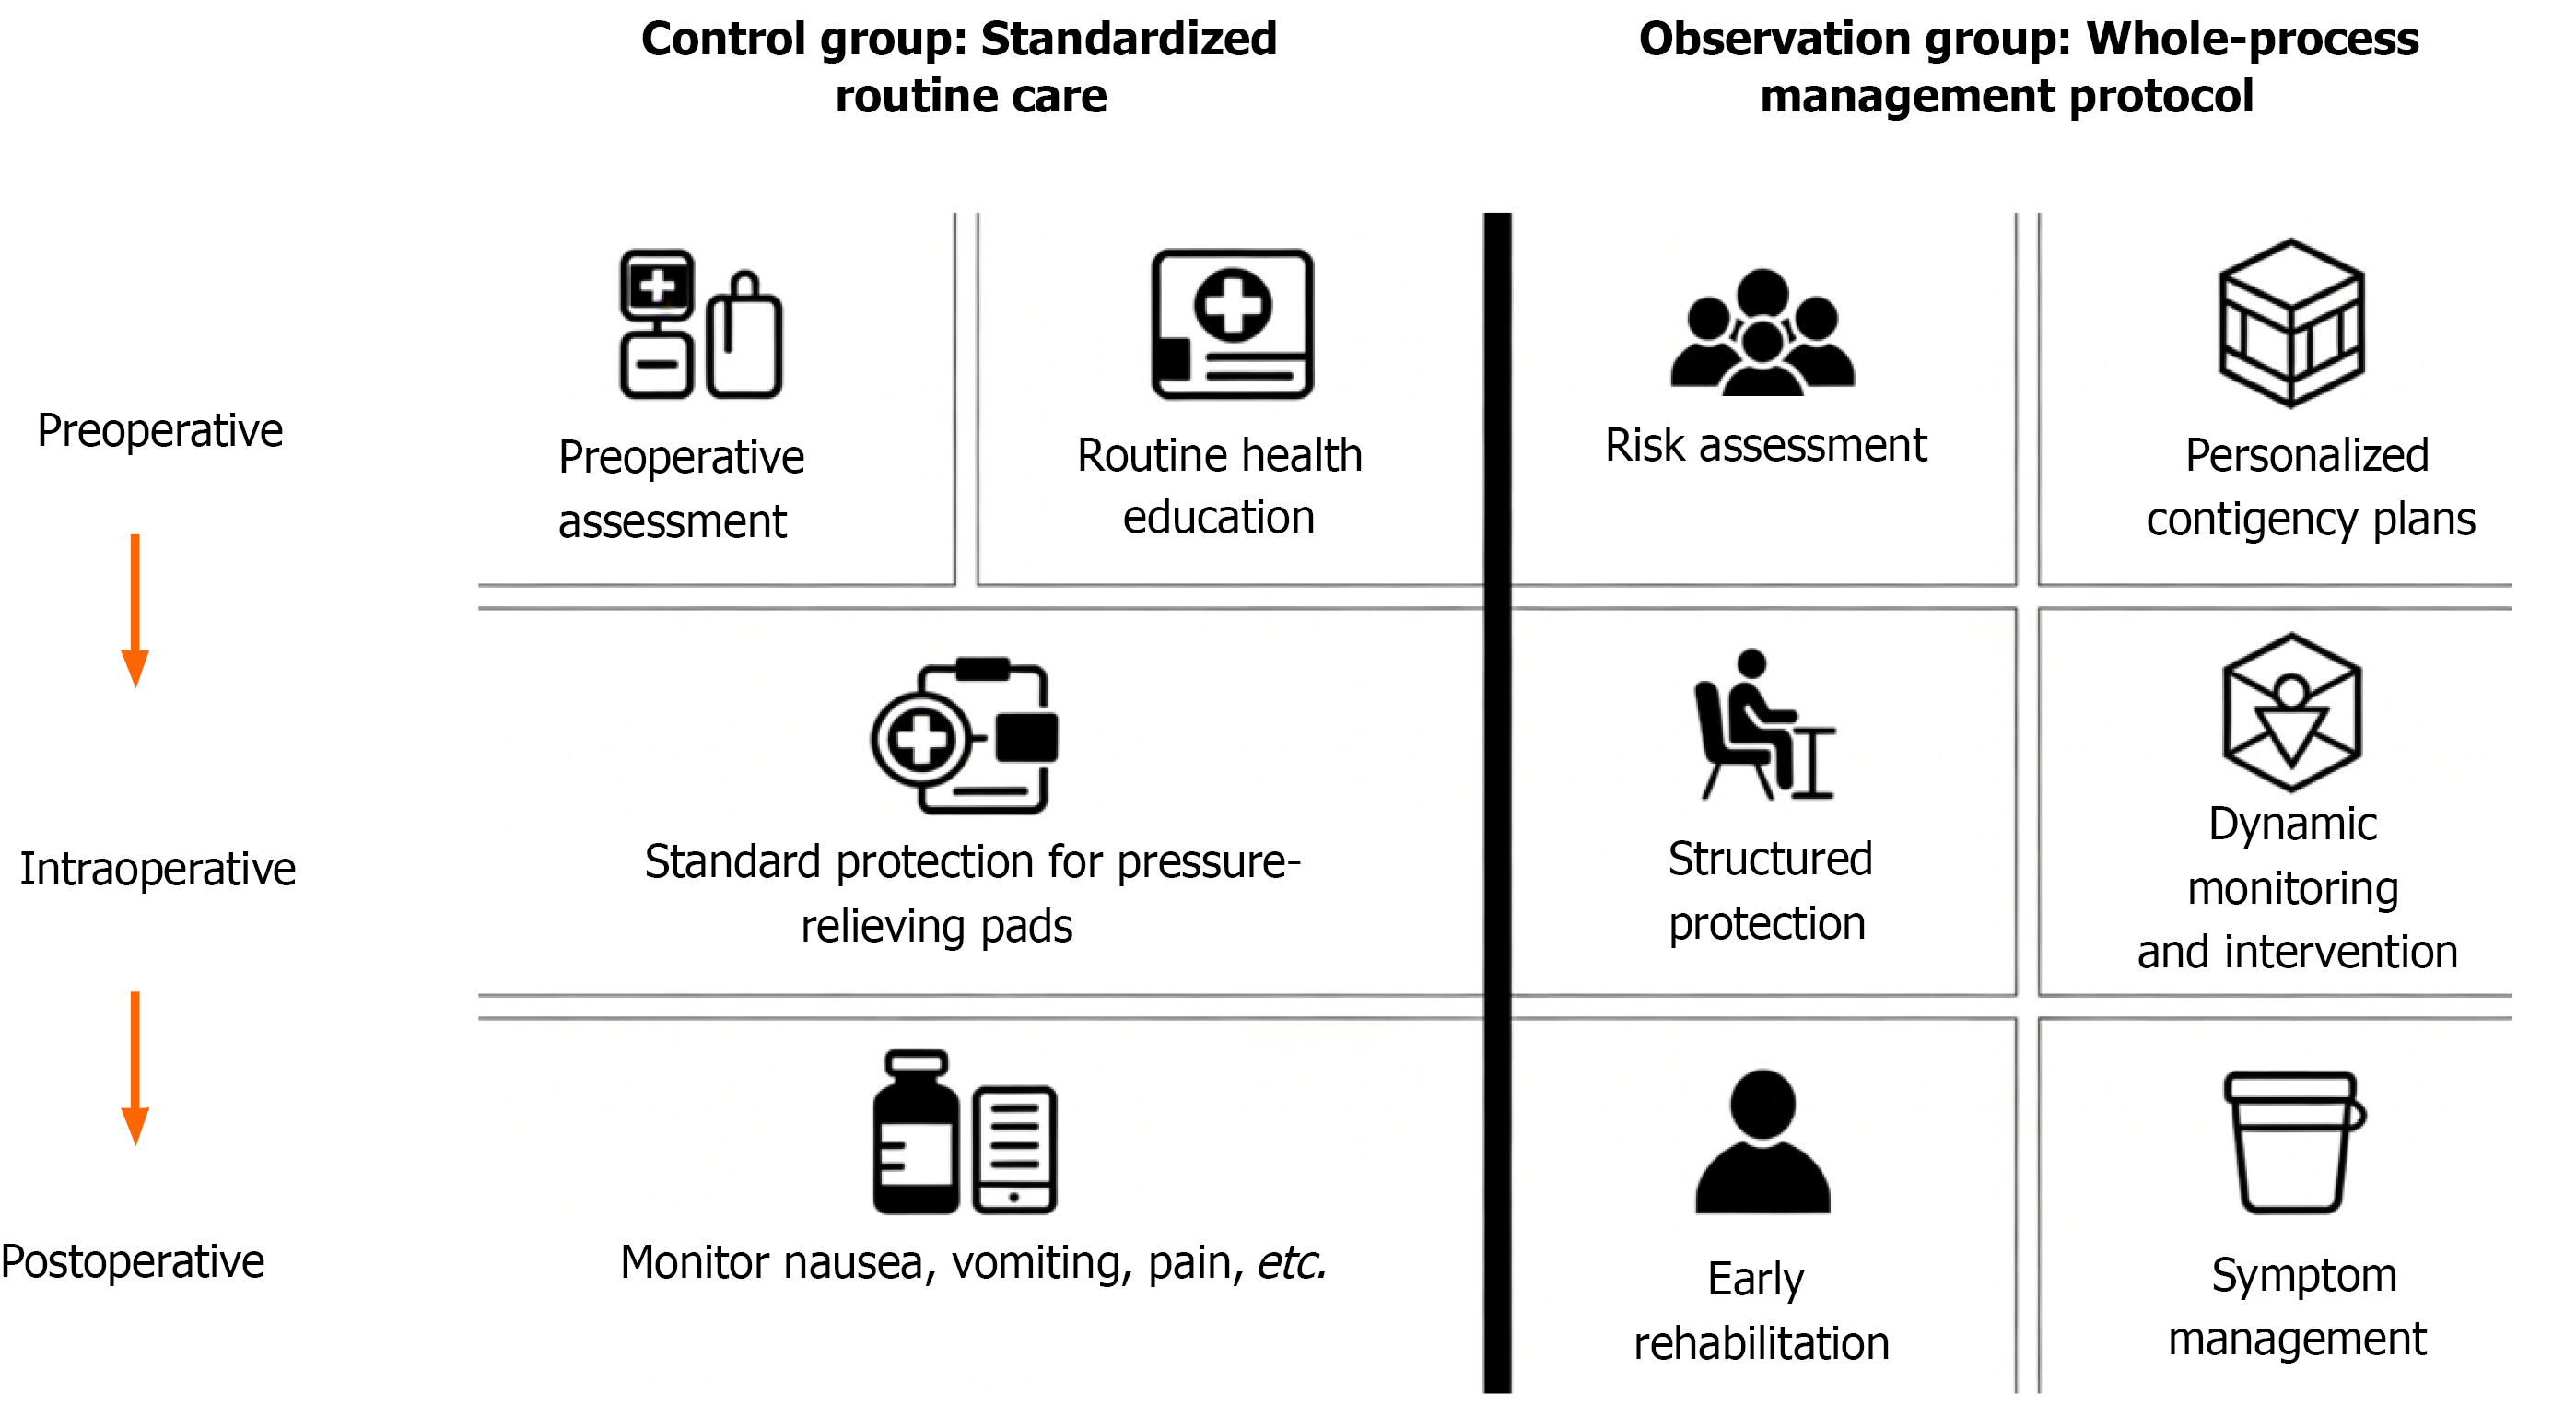
Figure 2
Schematic diagram of grouped interventions.
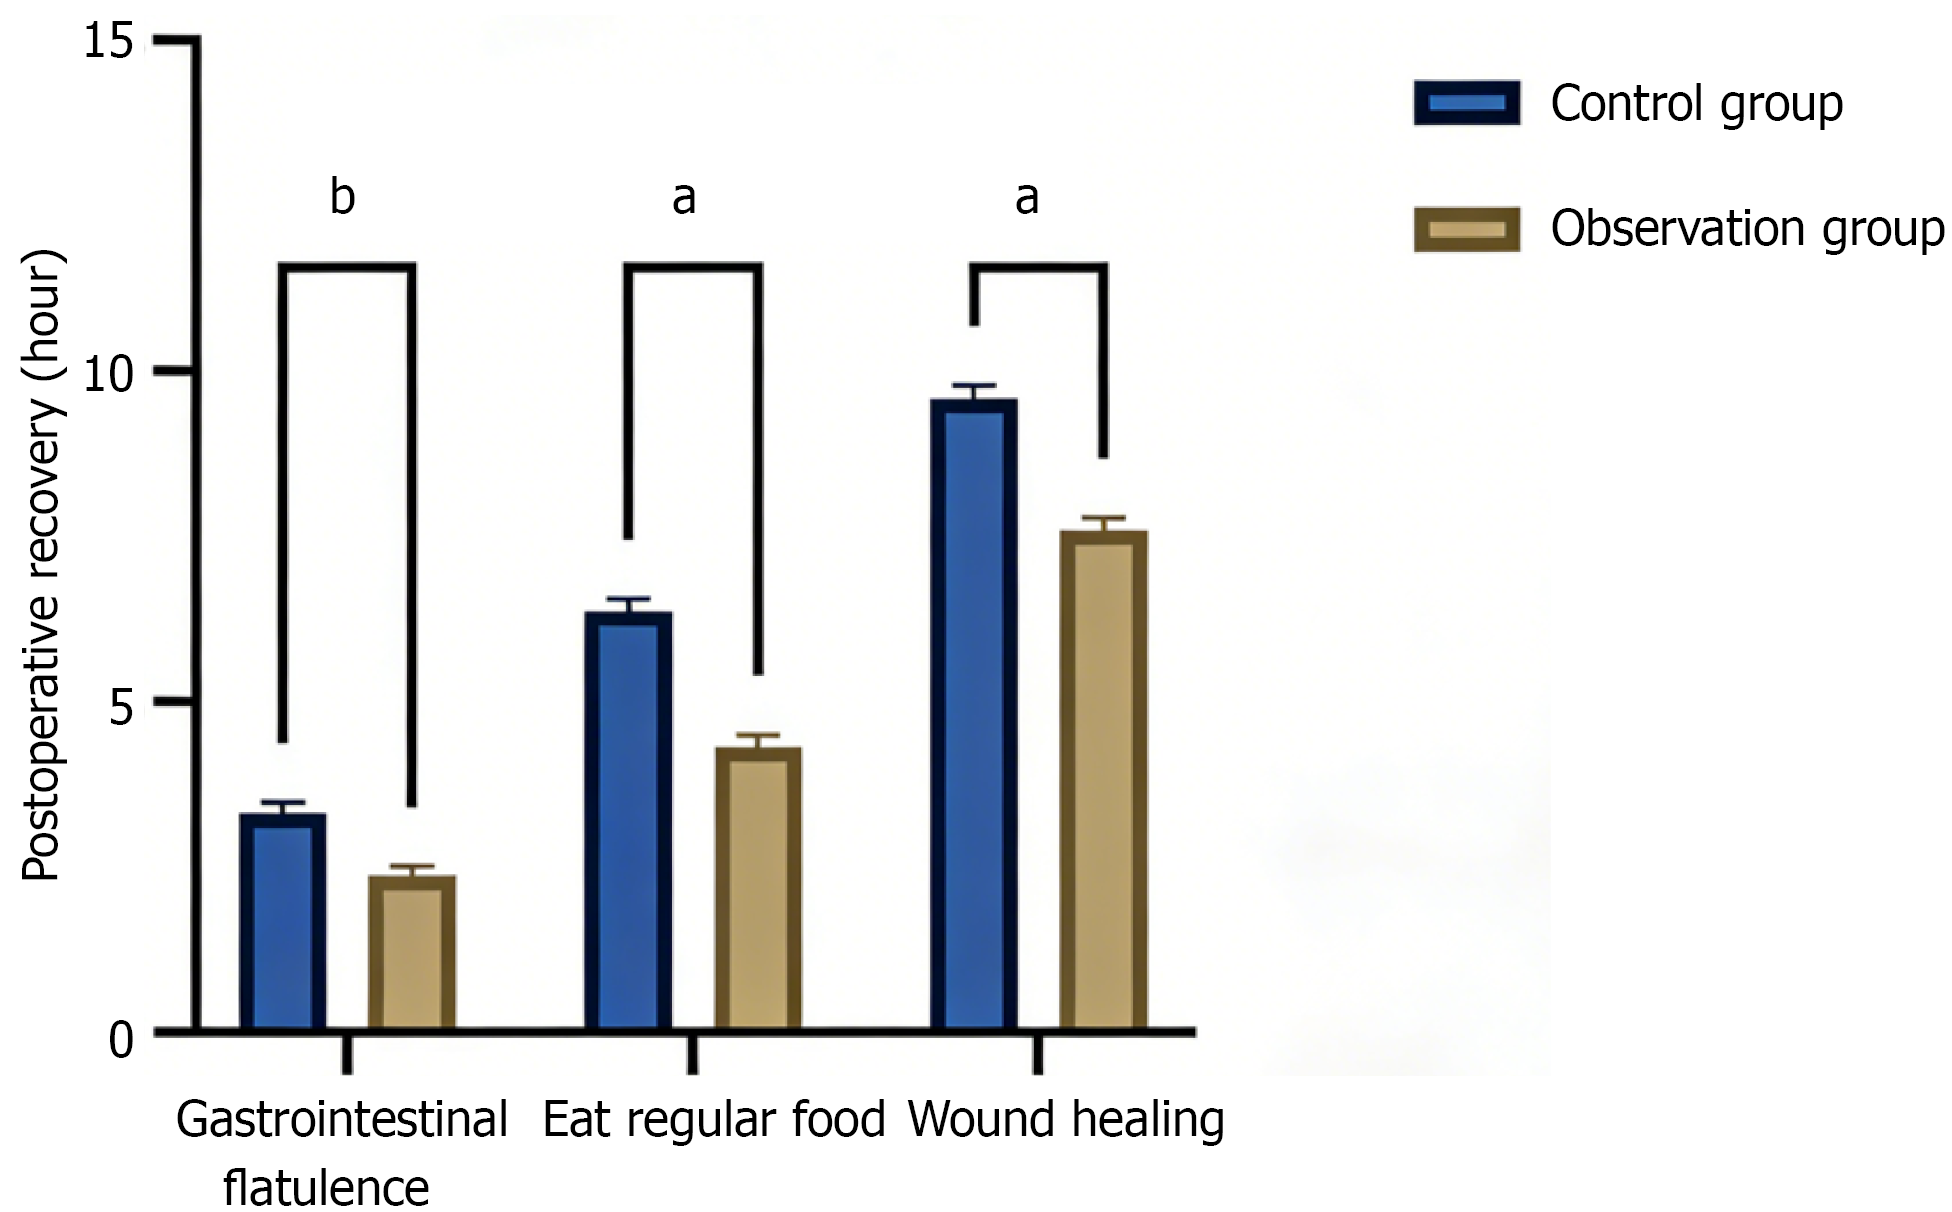
Figure 3 Comparison of postoperative recovery between the two patient groups.
aP < 0.001 vs the control group; bP < 0.01 vs the control group.
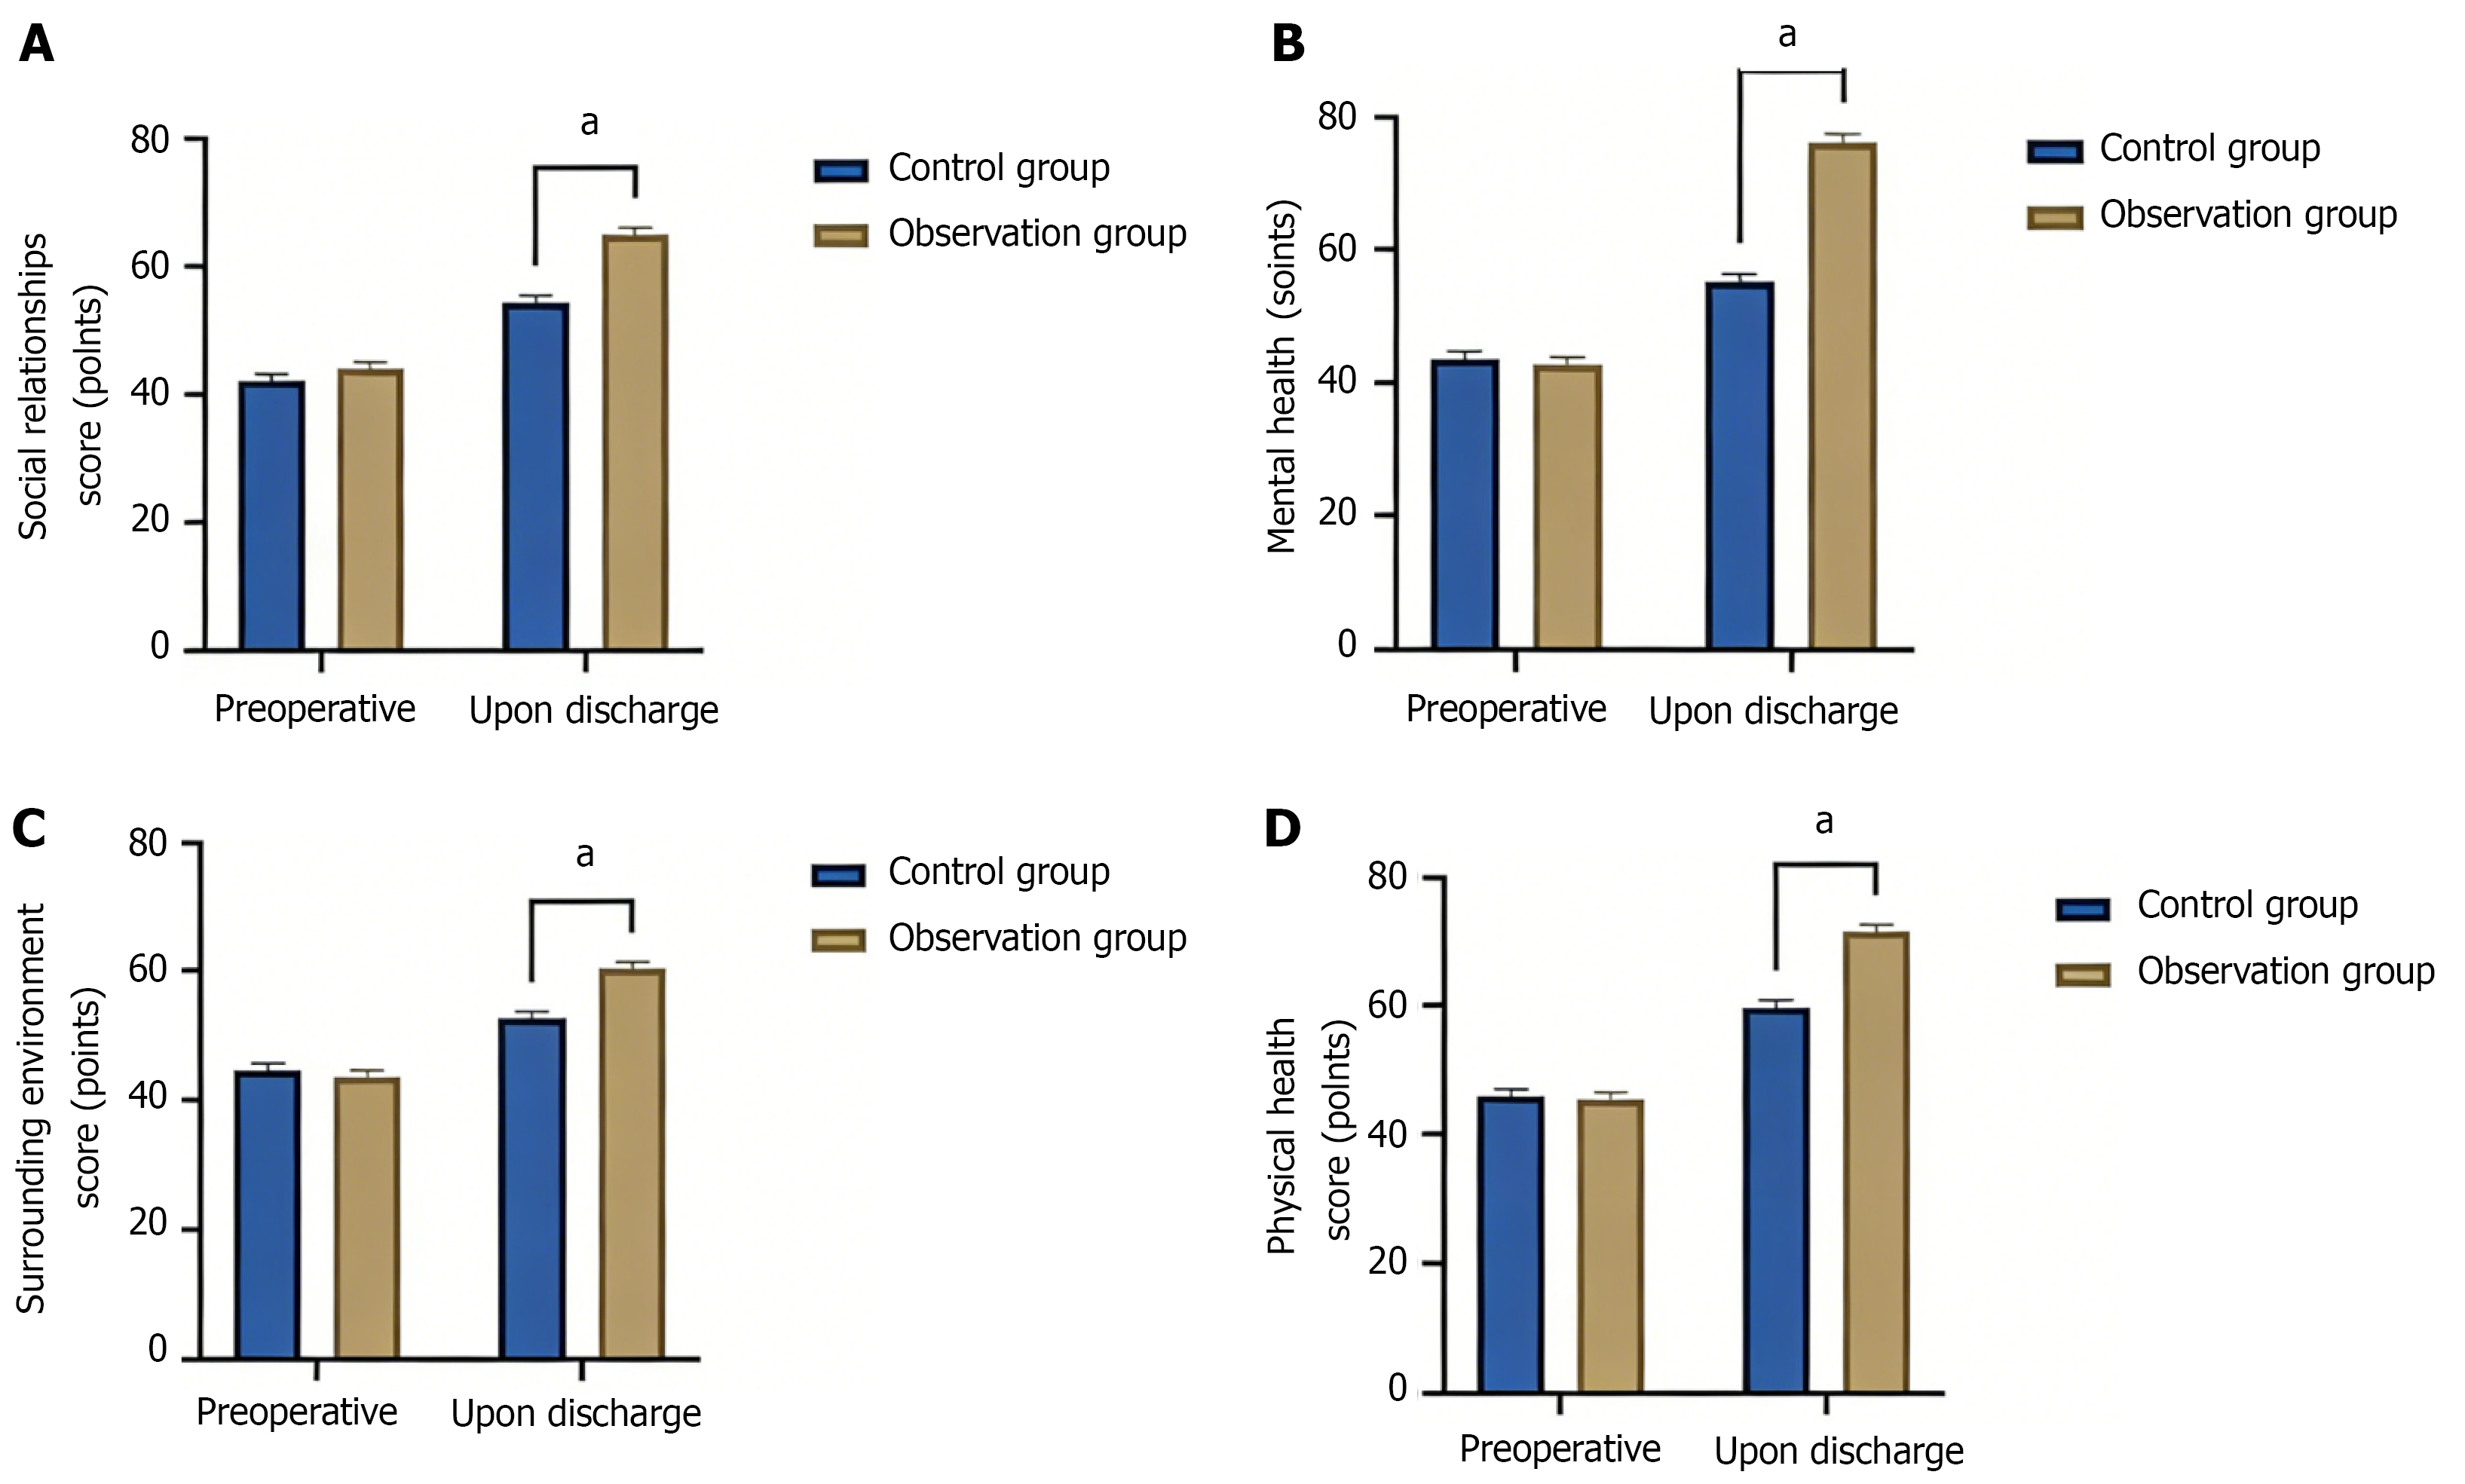
Figure 4 Comparison of quality of life between the two patient groups.
aP < 0.001 vs the control group. A: Social relationships; B: Mental health; C: Surrounding environment; D: Physical health.
- Citation: Ge J, Wang ZL. Effect of whole-process management protocol in preventing device-related intraoperative pressure injuries in patients undergoing gastrointestinal surgery. World J Gastrointest Surg 2026; 18(7): 121291
- URL: https://www.wjgnet.com/1948-9366/full/v18/i7/121291.htm
- DOI: https://dx.doi.org/10.4240/wjgs.v18.i7.121291