
















Copyright: ©Author(s) 2026.
World J Gastrointest Surg. Jul 27, 2026; 18(7): 120634
Published online Jul 27, 2026. doi: 10.4240/wjgs.v18.i7.120634
Published online Jul 27, 2026. doi: 10.4240/wjgs.v18.i7.120634
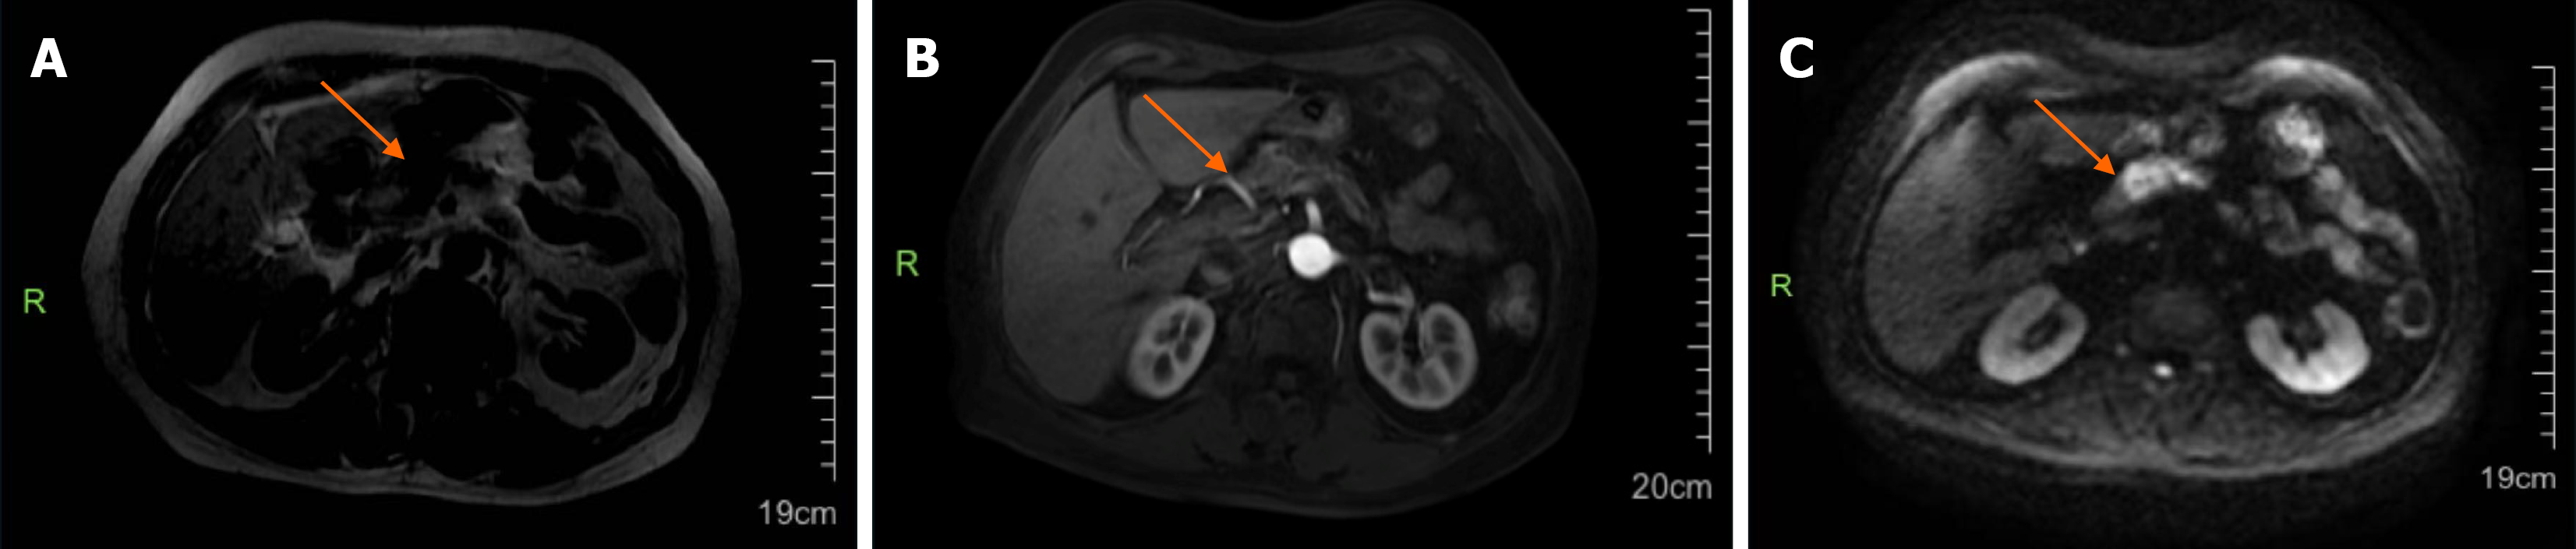
Figure 1 Contrast-enhanced abdominal magnetic resonance imaging revealing a patchy lesion in the pancreatic neck with hypointense T1-weighted and mildly hyperintense T2-weighted signals.
A: Magnetic resonance imaging (MRI) T1 with contrast enhancement (arrow); B: MRI T2 with contrast enhancement (arrow); C: MRI diffusion-weighted imaging with contrast enhancement (arrow). Diffusion-weighted imaging showed high signal intensity. The lesion measured approximately 22 mm × 16.5 mm. The pancreatic body and tail were atrophied with irregular dilation of the pancreatic duct. Progressive and heterogeneous enhancement was observed on contrast-enhanced sequences.
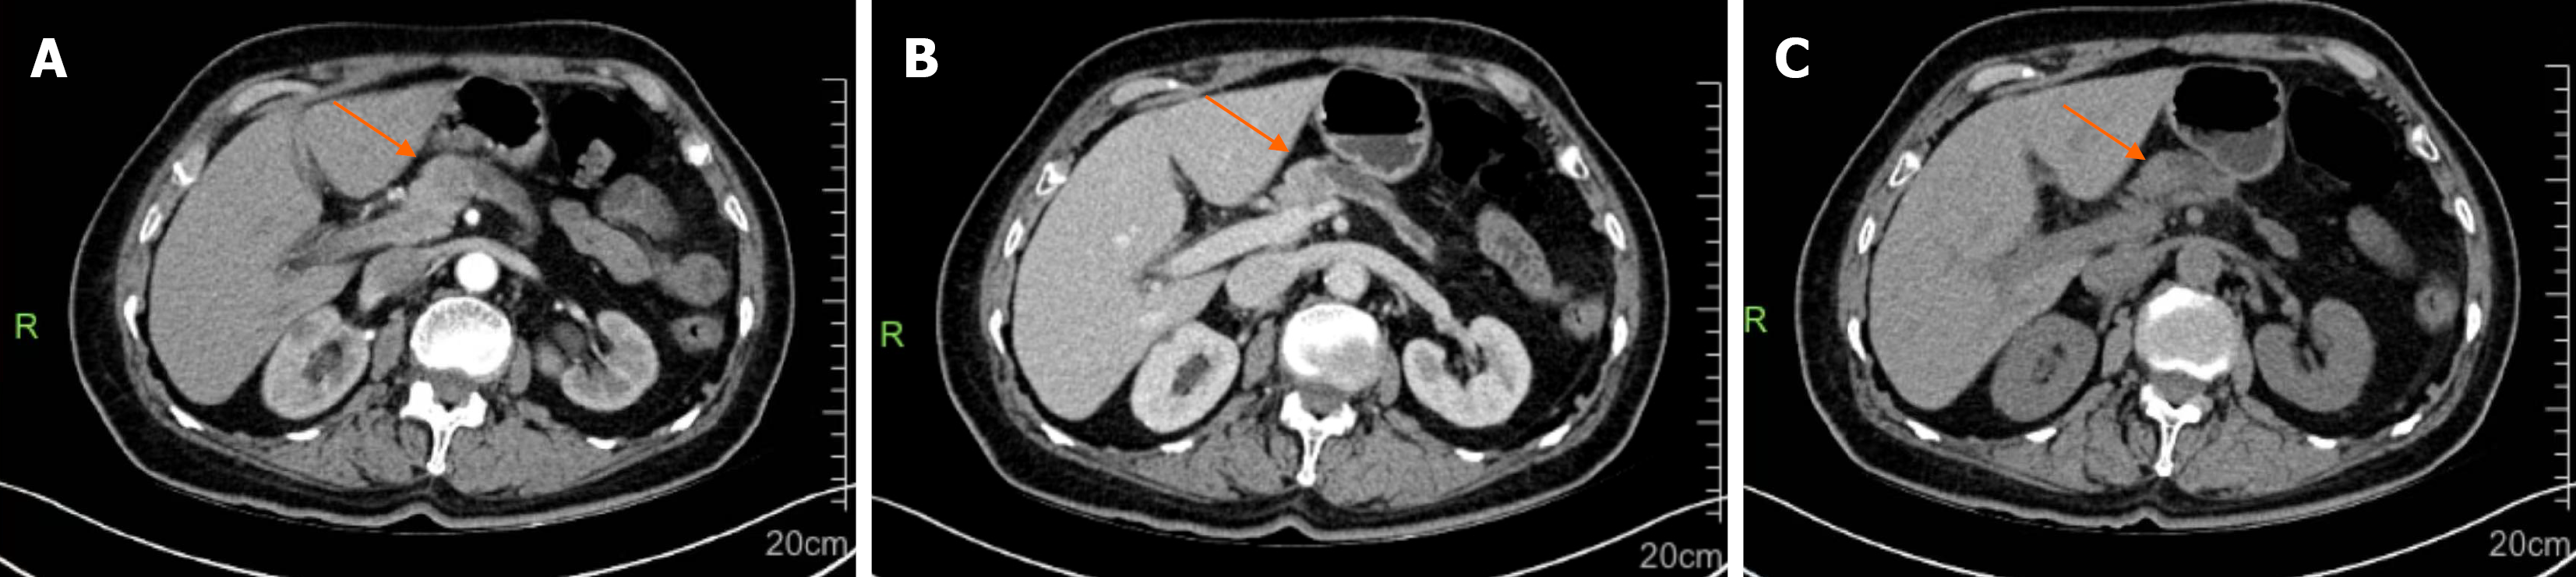
Figure 2 Contrast-enhanced abdominal computed tomography showing a poorly defined, mildly hypodense lesion in the pancreatic neck, with a maximum diameter of approximately 19 mm.
A: Represents the arterial phase of the computed tomography (CT) scan (arrow); B: Represents the venous phase of the CT scan (arrow); C: Non-contrast CT scan (arrow). Mild heterogeneous enhancement was noted. Atrophy of the pancreatic body and tail with irregular dilation of the pancreatic duct was present.
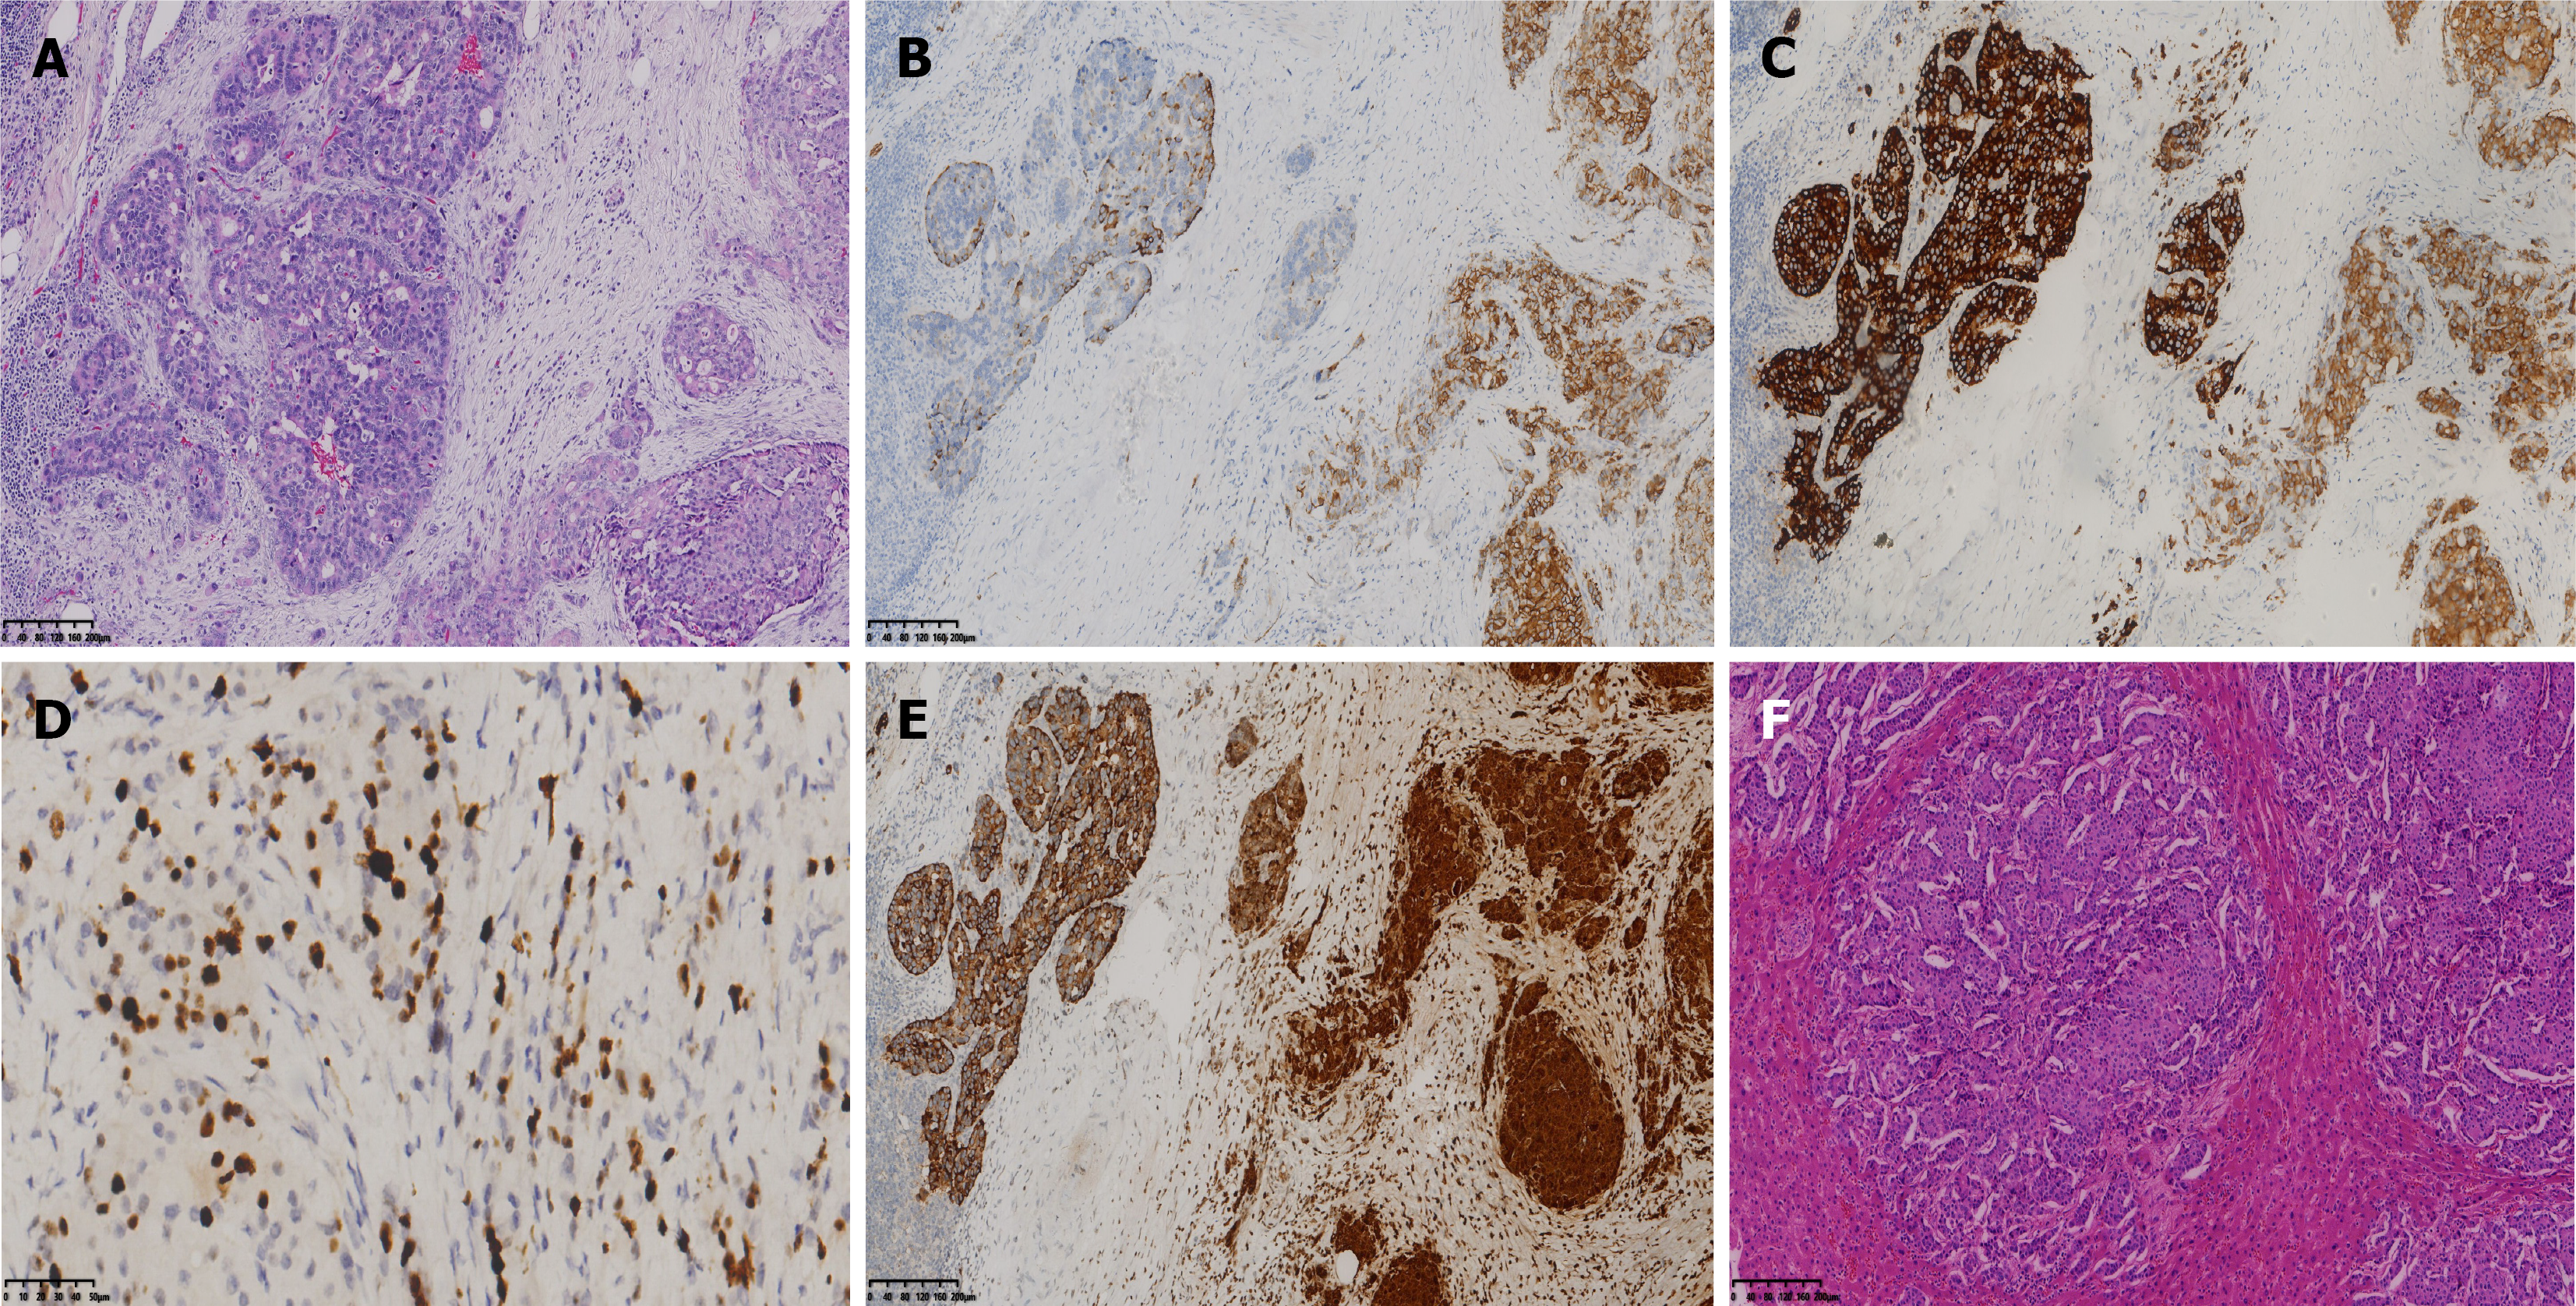
Figure 3 Immunohistochemical findings for the pancreatic tumor.
A: Tumor cell nests within pancreatic tissue; B: CD56 (+), 100 ×; C: Synaptophysin (+), 100 ×; D: Ki-67 (+, hotspot approximately 40%), 400 ×; E: Chromogranin A (+), 100 ×; F: Nest-like tumor cell infiltration was observed in the liver tissue.
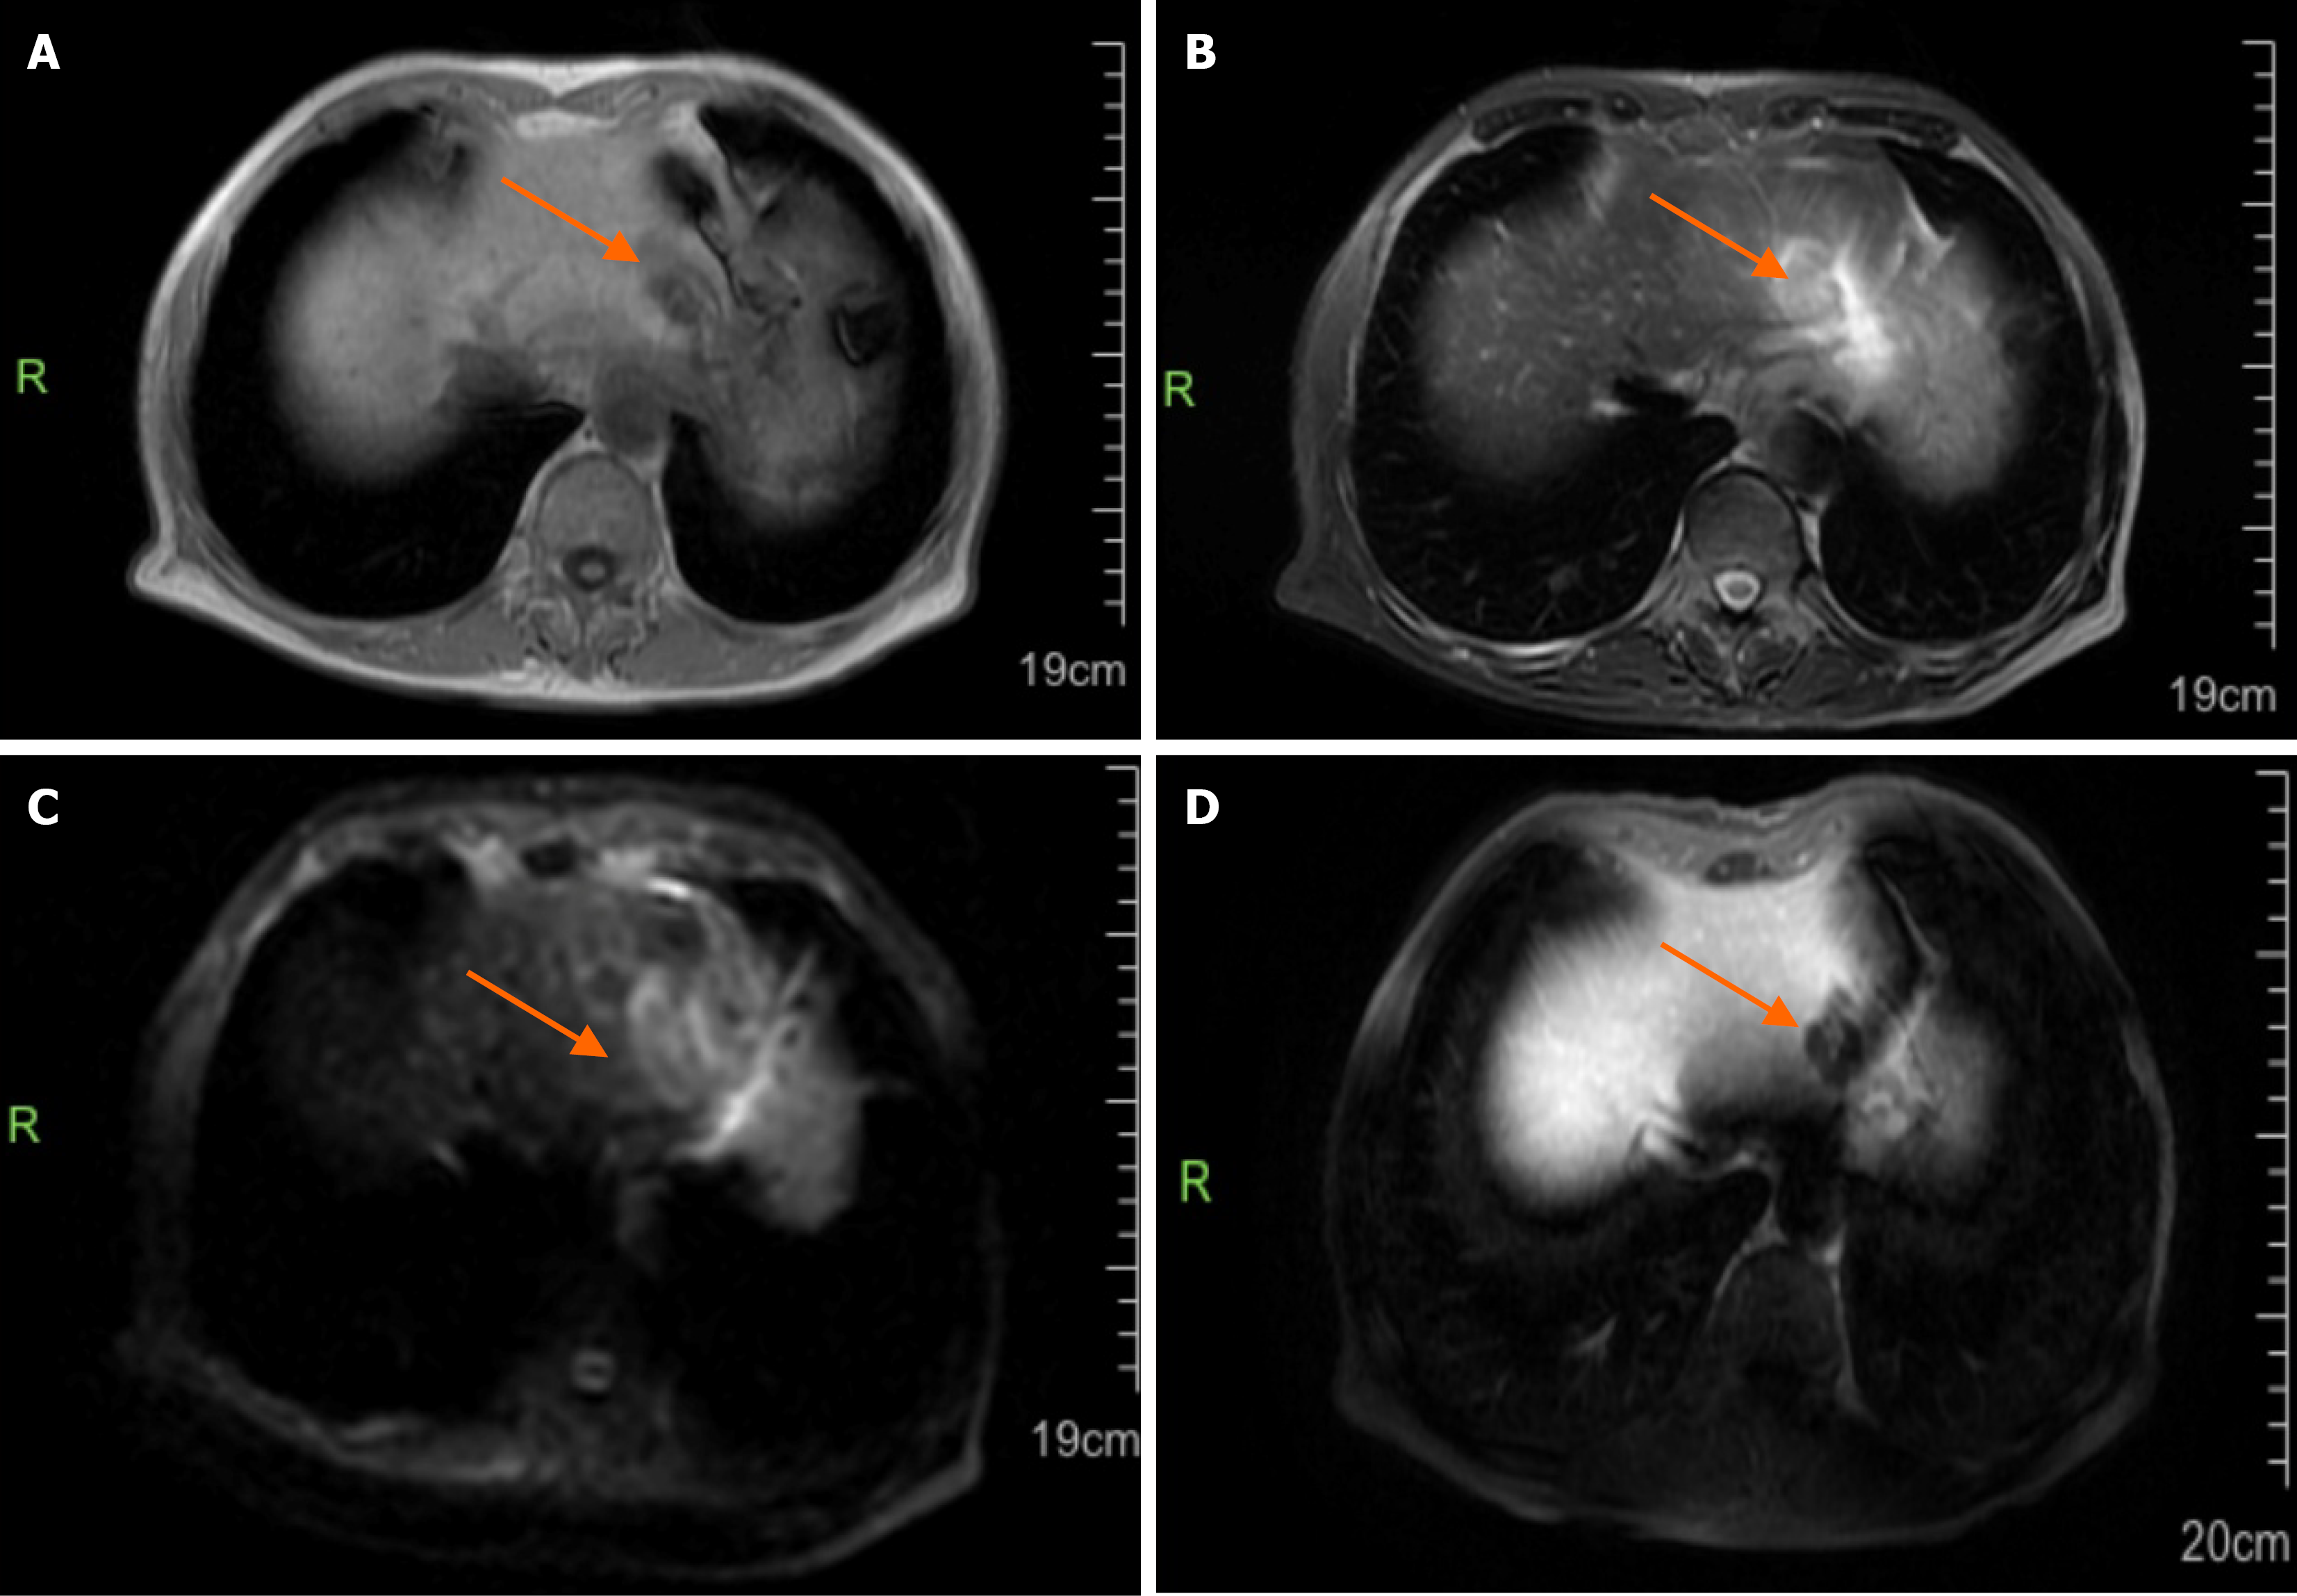
Figure 4 Contrast-enhanced abdominal magnetic resonance imaging revealing a hepatic lesion in the left lobe characterized by hypointense T1-weighted and hyperintense T2-weighted signals with mildly increased diffusion-weighted imaging signal intensity.
A: Magnetic resonance imaging (MRI) T1 with contrast enhancement (arrow); B: MRI T2 with contrast enhancement (arrow); C: MRI diffusion-weighted imaging with contrast enhancement (arrow); D: Venous phase magnetic resonance imaging (arrow). The lesion measured approximately 2.4 cm × 3.3 cm and demonstrated ring-like enhancement after contrast administration. Intrahepatic vessels were normal, with no dilation of the intrahepatic or extrahepatic bile ducts.
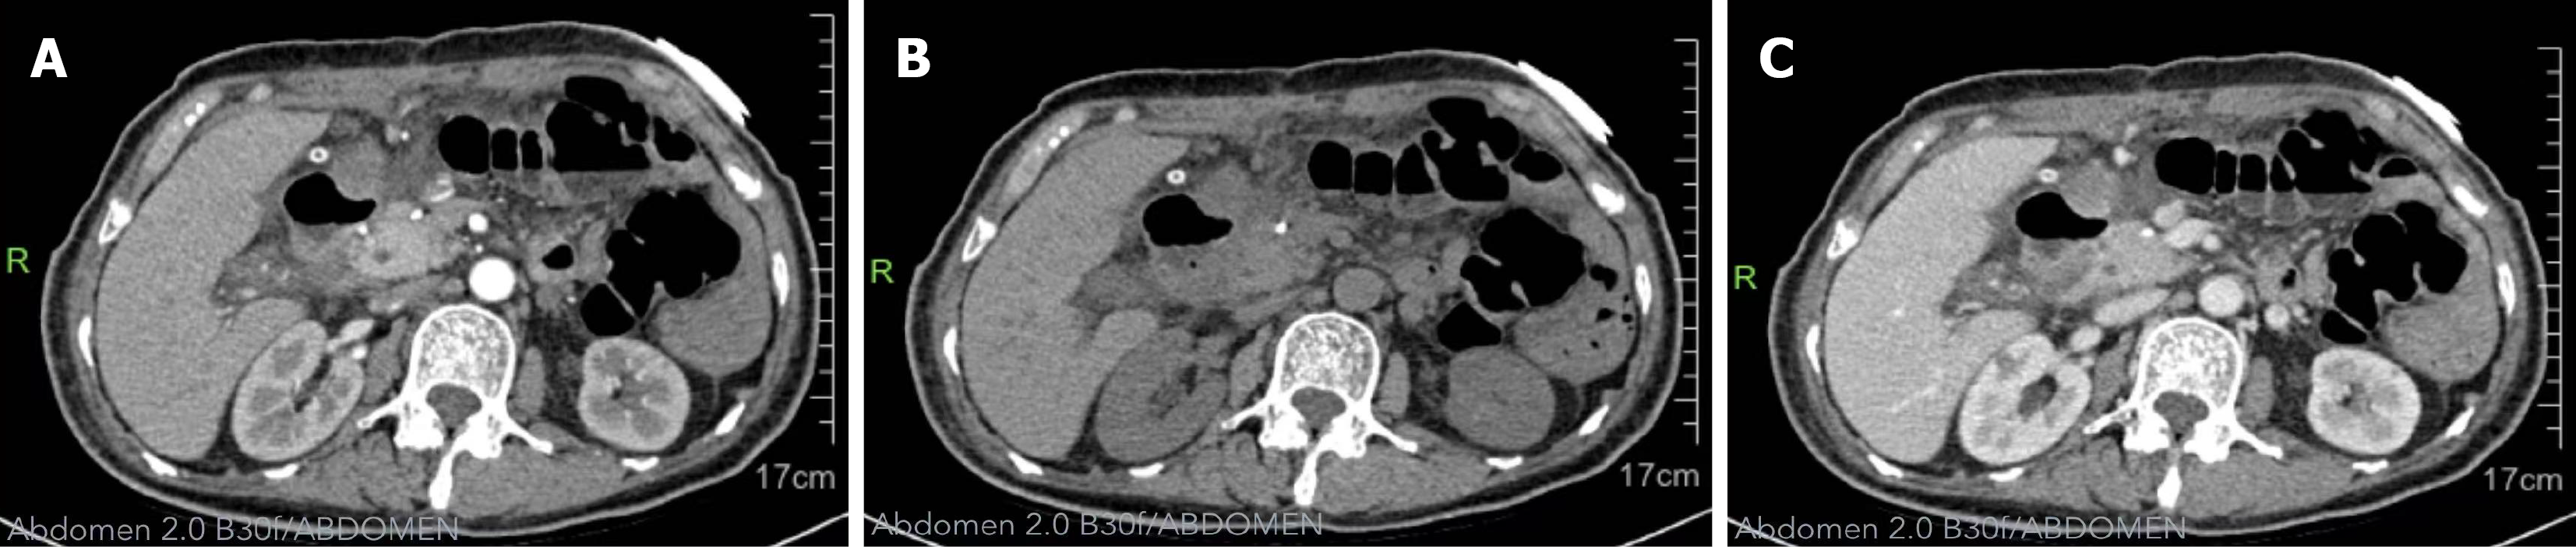
Figure 5 Postoperative contrast-enhanced abdominal computed tomography demonstrating changes following resection of the left-lobe liver metastasis, including postoperative exudation, localized effusion, gas accumulation, a turbid fat gap in the operative field, and a visible drainage tube in the upper abdomen.
A: Represents the arterial phase of the computed tomography (CT) scan; B: Non-contrast CT scan; C: Represents the venous phase of the CT scan.
- Citation: Yao JQ, Wu B, Yang JQ, Wang T, Shen YY. Liver metastasis from pancreatic neuroendocrine tumor: A case report. World J Gastrointest Surg 2026; 18(7): 120634
- URL: https://www.wjgnet.com/1948-9366/full/v18/i7/120634.htm
- DOI: https://dx.doi.org/10.4240/wjgs.v18.i7.120634