
















Copyright: ©Author(s) 2026.
World J Gastrointest Surg. Jul 27, 2026; 18(7): 120222
Published online Jul 27, 2026. doi: 10.4240/wjgs.v18.i7.120222
Published online Jul 27, 2026. doi: 10.4240/wjgs.v18.i7.120222
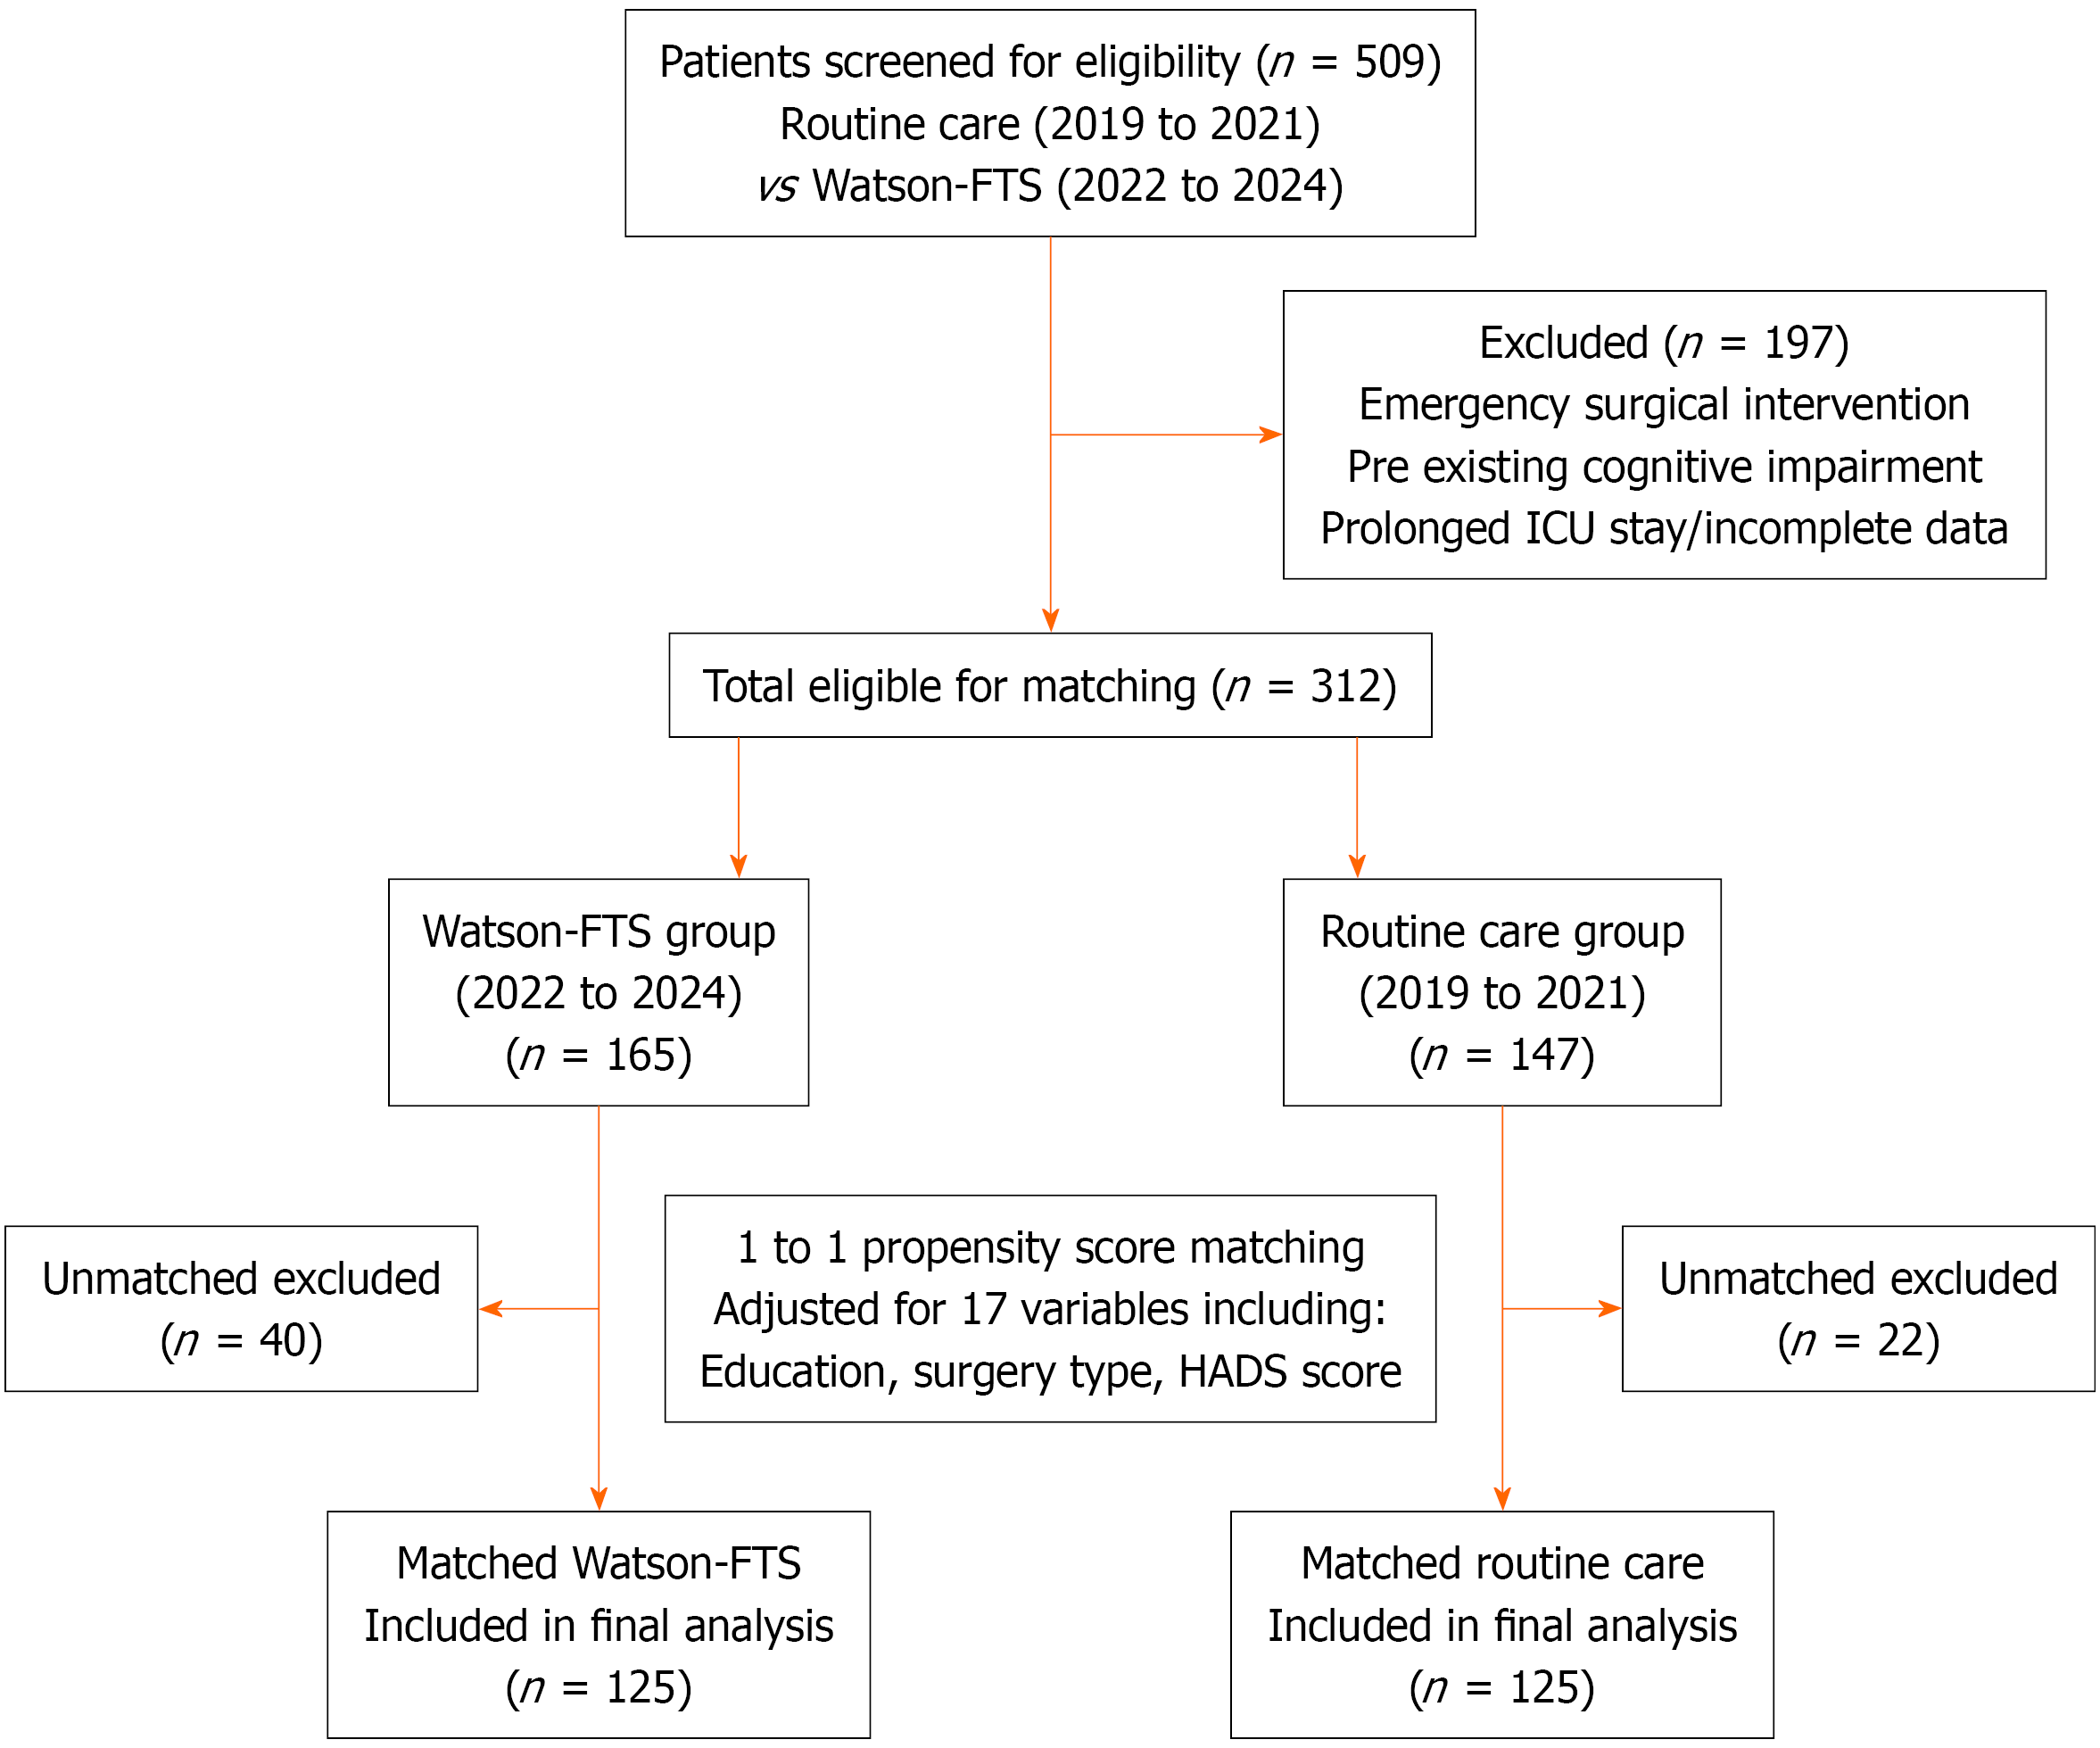
Figure 1 Flowchart of participant screening and cohort selection.
FTS: Fast track surgery; ICU: Intensive care unit; HADS: Hospital Anxiety and Depression Scale.
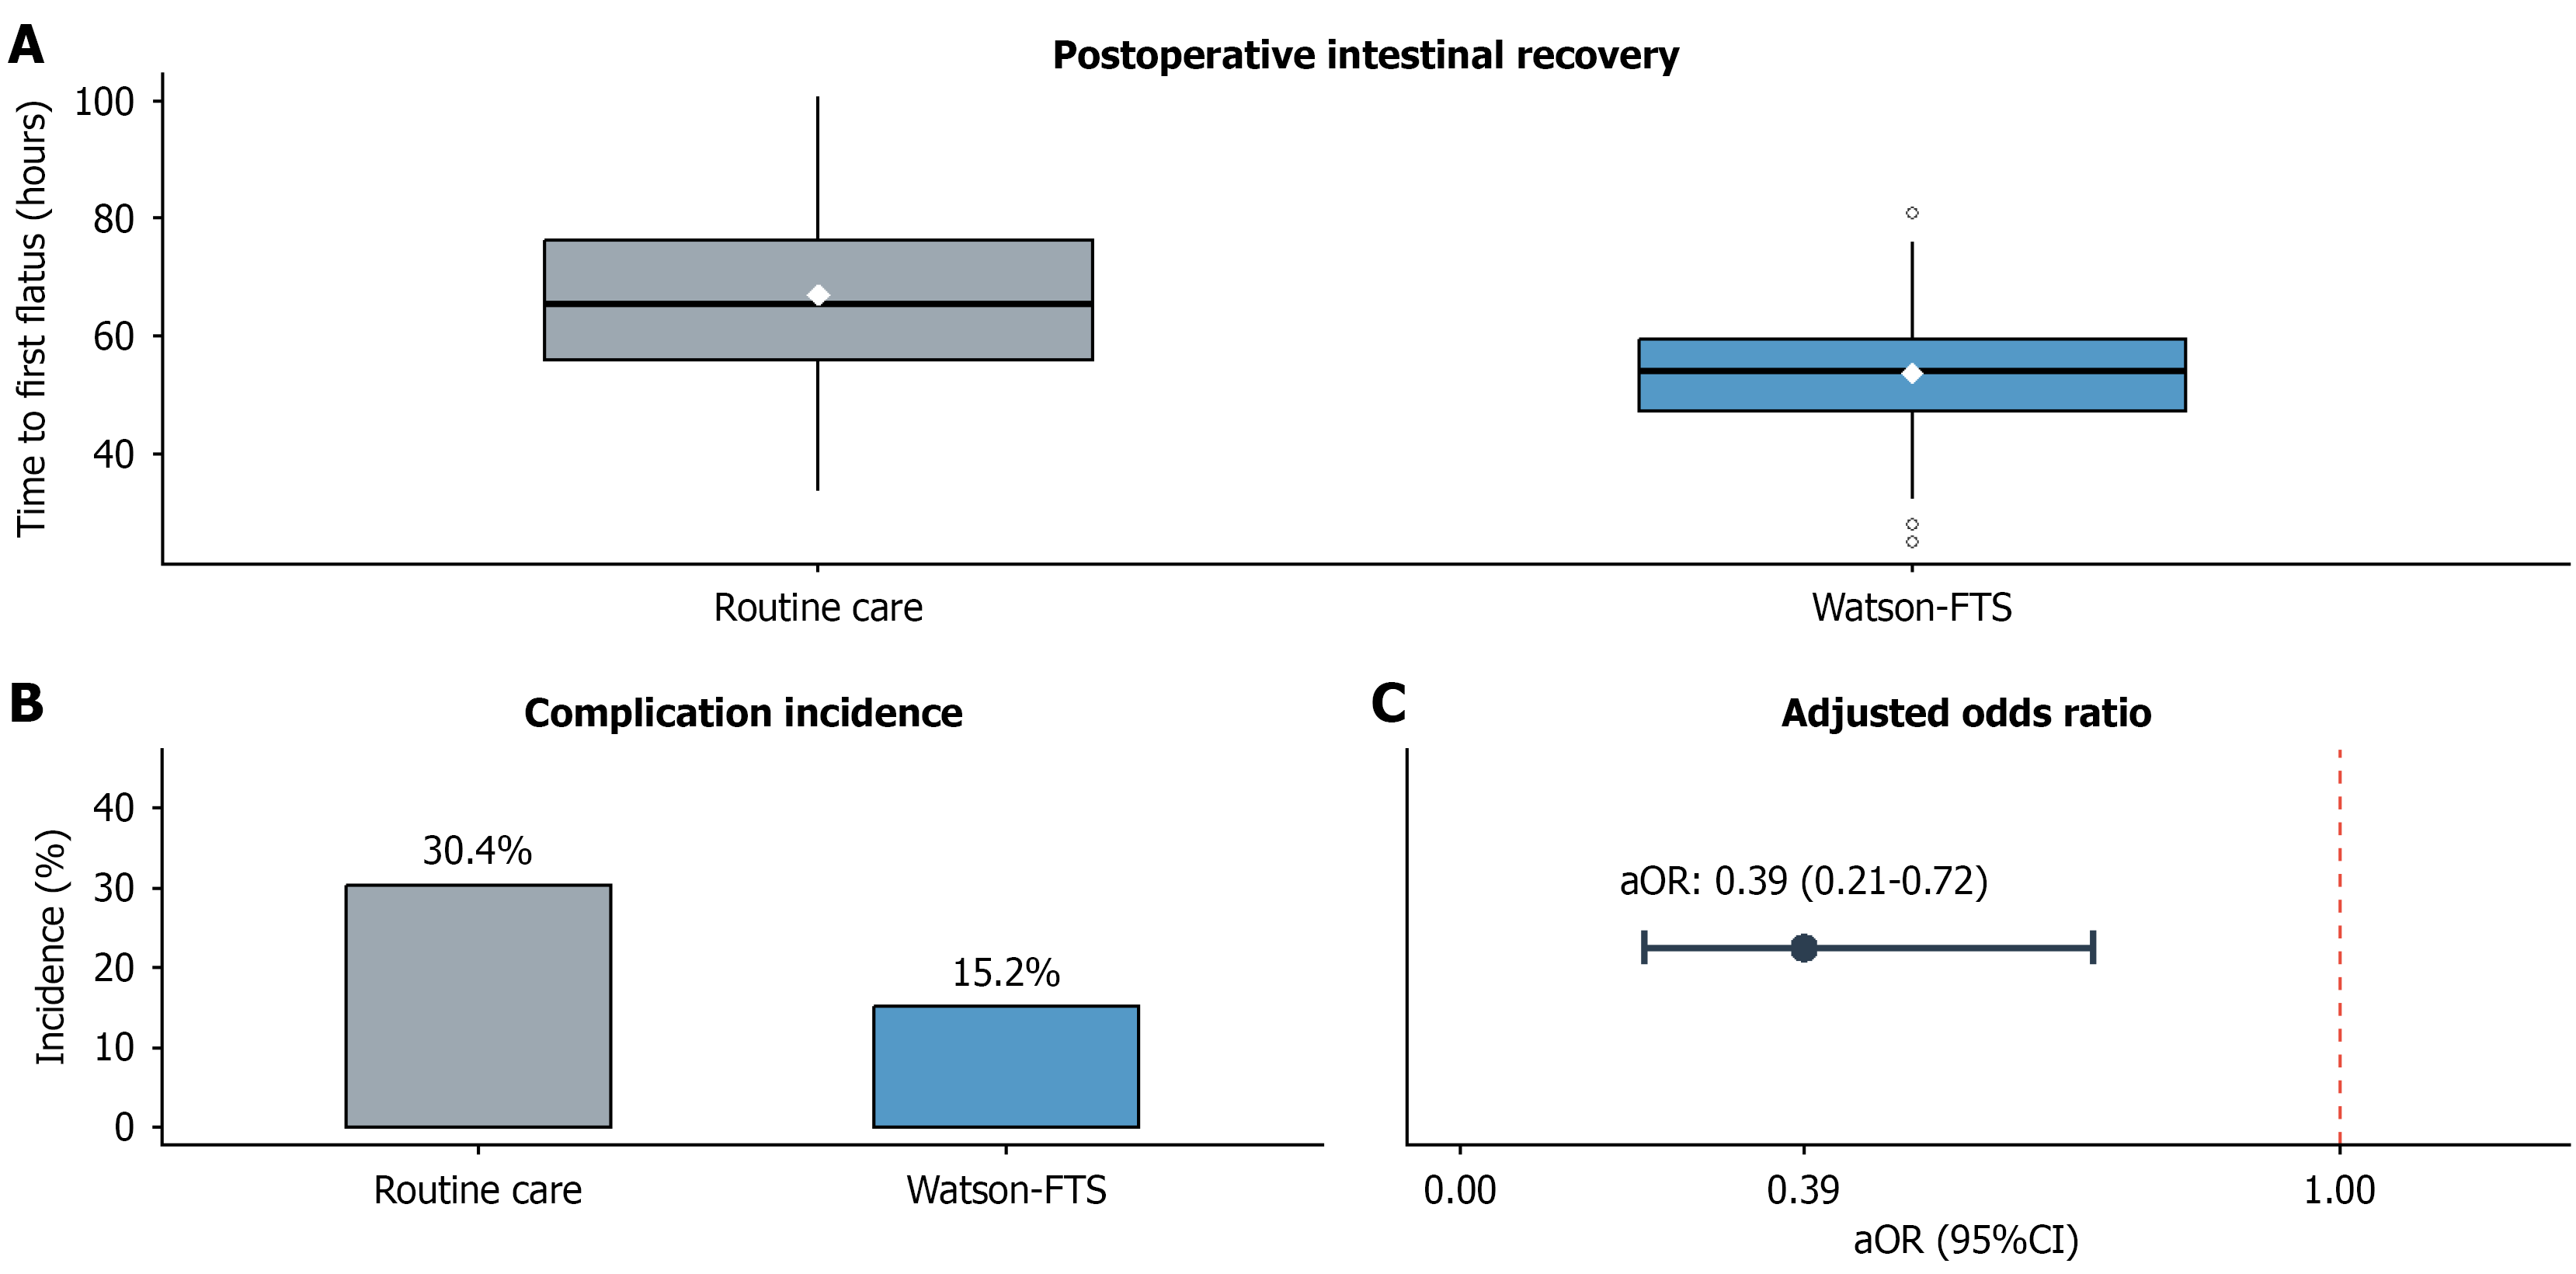
Figure 2 Primary outcome comparison between the Watson-fast track surgery and routine care groups.
A: Box plots illustrating the distribution of time to first postoperative flatus (hours); B: Bar chart displaying the incidence of overall postoperative complications; C: With the adjacent forest plot indicating the adjusted odds ratio and 95% confidence intervals. FTS: Fast track surgery; aOR: Adjusted odds ratio; CI: Confidence interval.
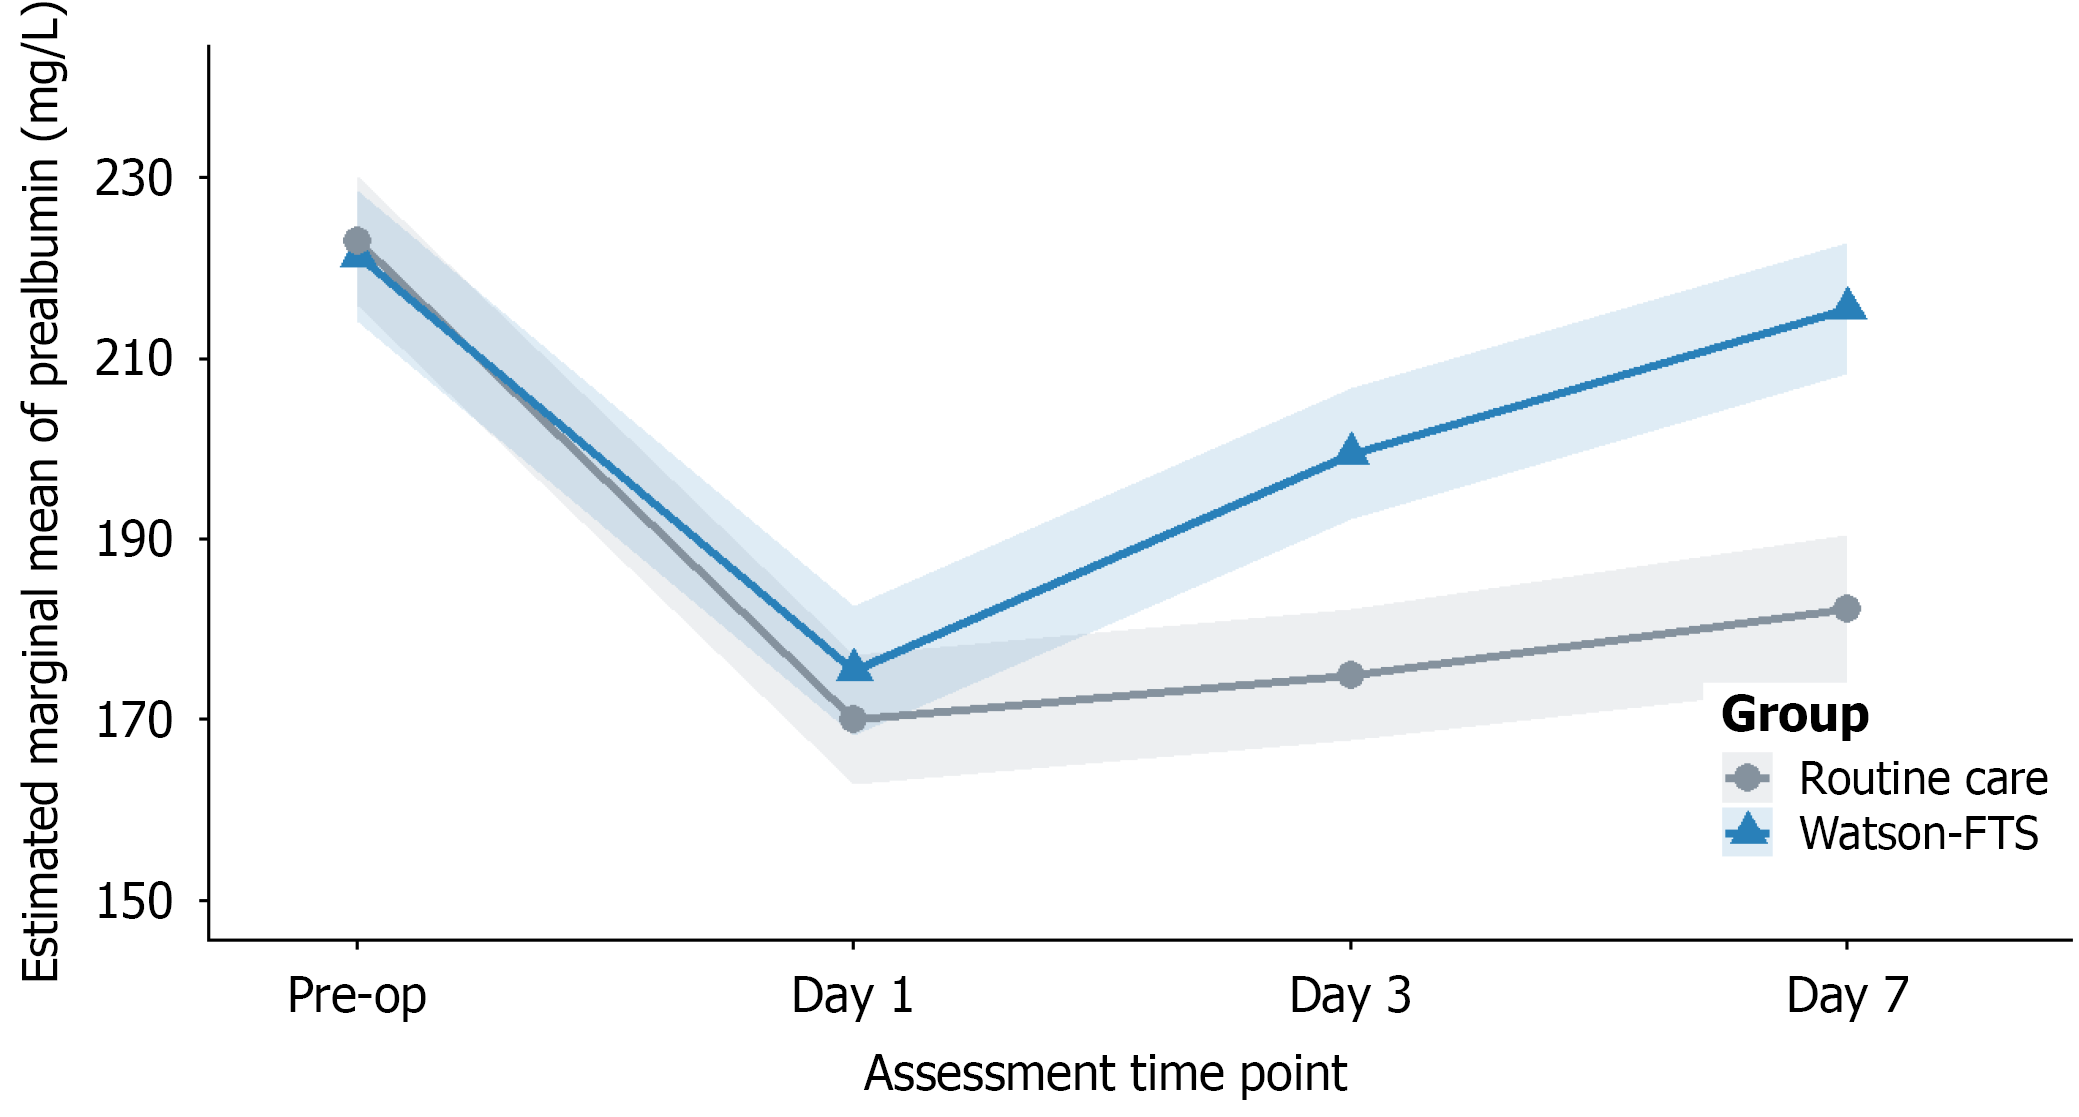
Figure 3 Estimated marginal means of prealbumin recovery trajectories.
The graph illustrates the dynamic changes in prealbumin (mg/L) from preoperative T0 to postoperative T3 (day 7). Both groups show an initial decline, but the Watson-fast track surgery group demonstrates a significantly faster recovery curve, highlighting the impact of humanistic nursing on metabolic stabilization. FTS: Fast track surgery.
- Citation: Jiang D, Shang FJ, Yu W. Association of Watson-based humanistic fast track surgery with stoma colorectal cancer recovery: A propensity matched study. World J Gastrointest Surg 2026; 18(7): 120222
- URL: https://www.wjgnet.com/1948-9366/full/v18/i7/120222.htm
- DOI: https://dx.doi.org/10.4240/wjgs.v18.i7.120222