
















Copyright: ©Author(s) 2026.
World J Gastrointest Surg. Jul 27, 2026; 18(7): 119151
Published online Jul 27, 2026. doi: 10.4240/wjgs.v18.i7.119151
Published online Jul 27, 2026. doi: 10.4240/wjgs.v18.i7.119151
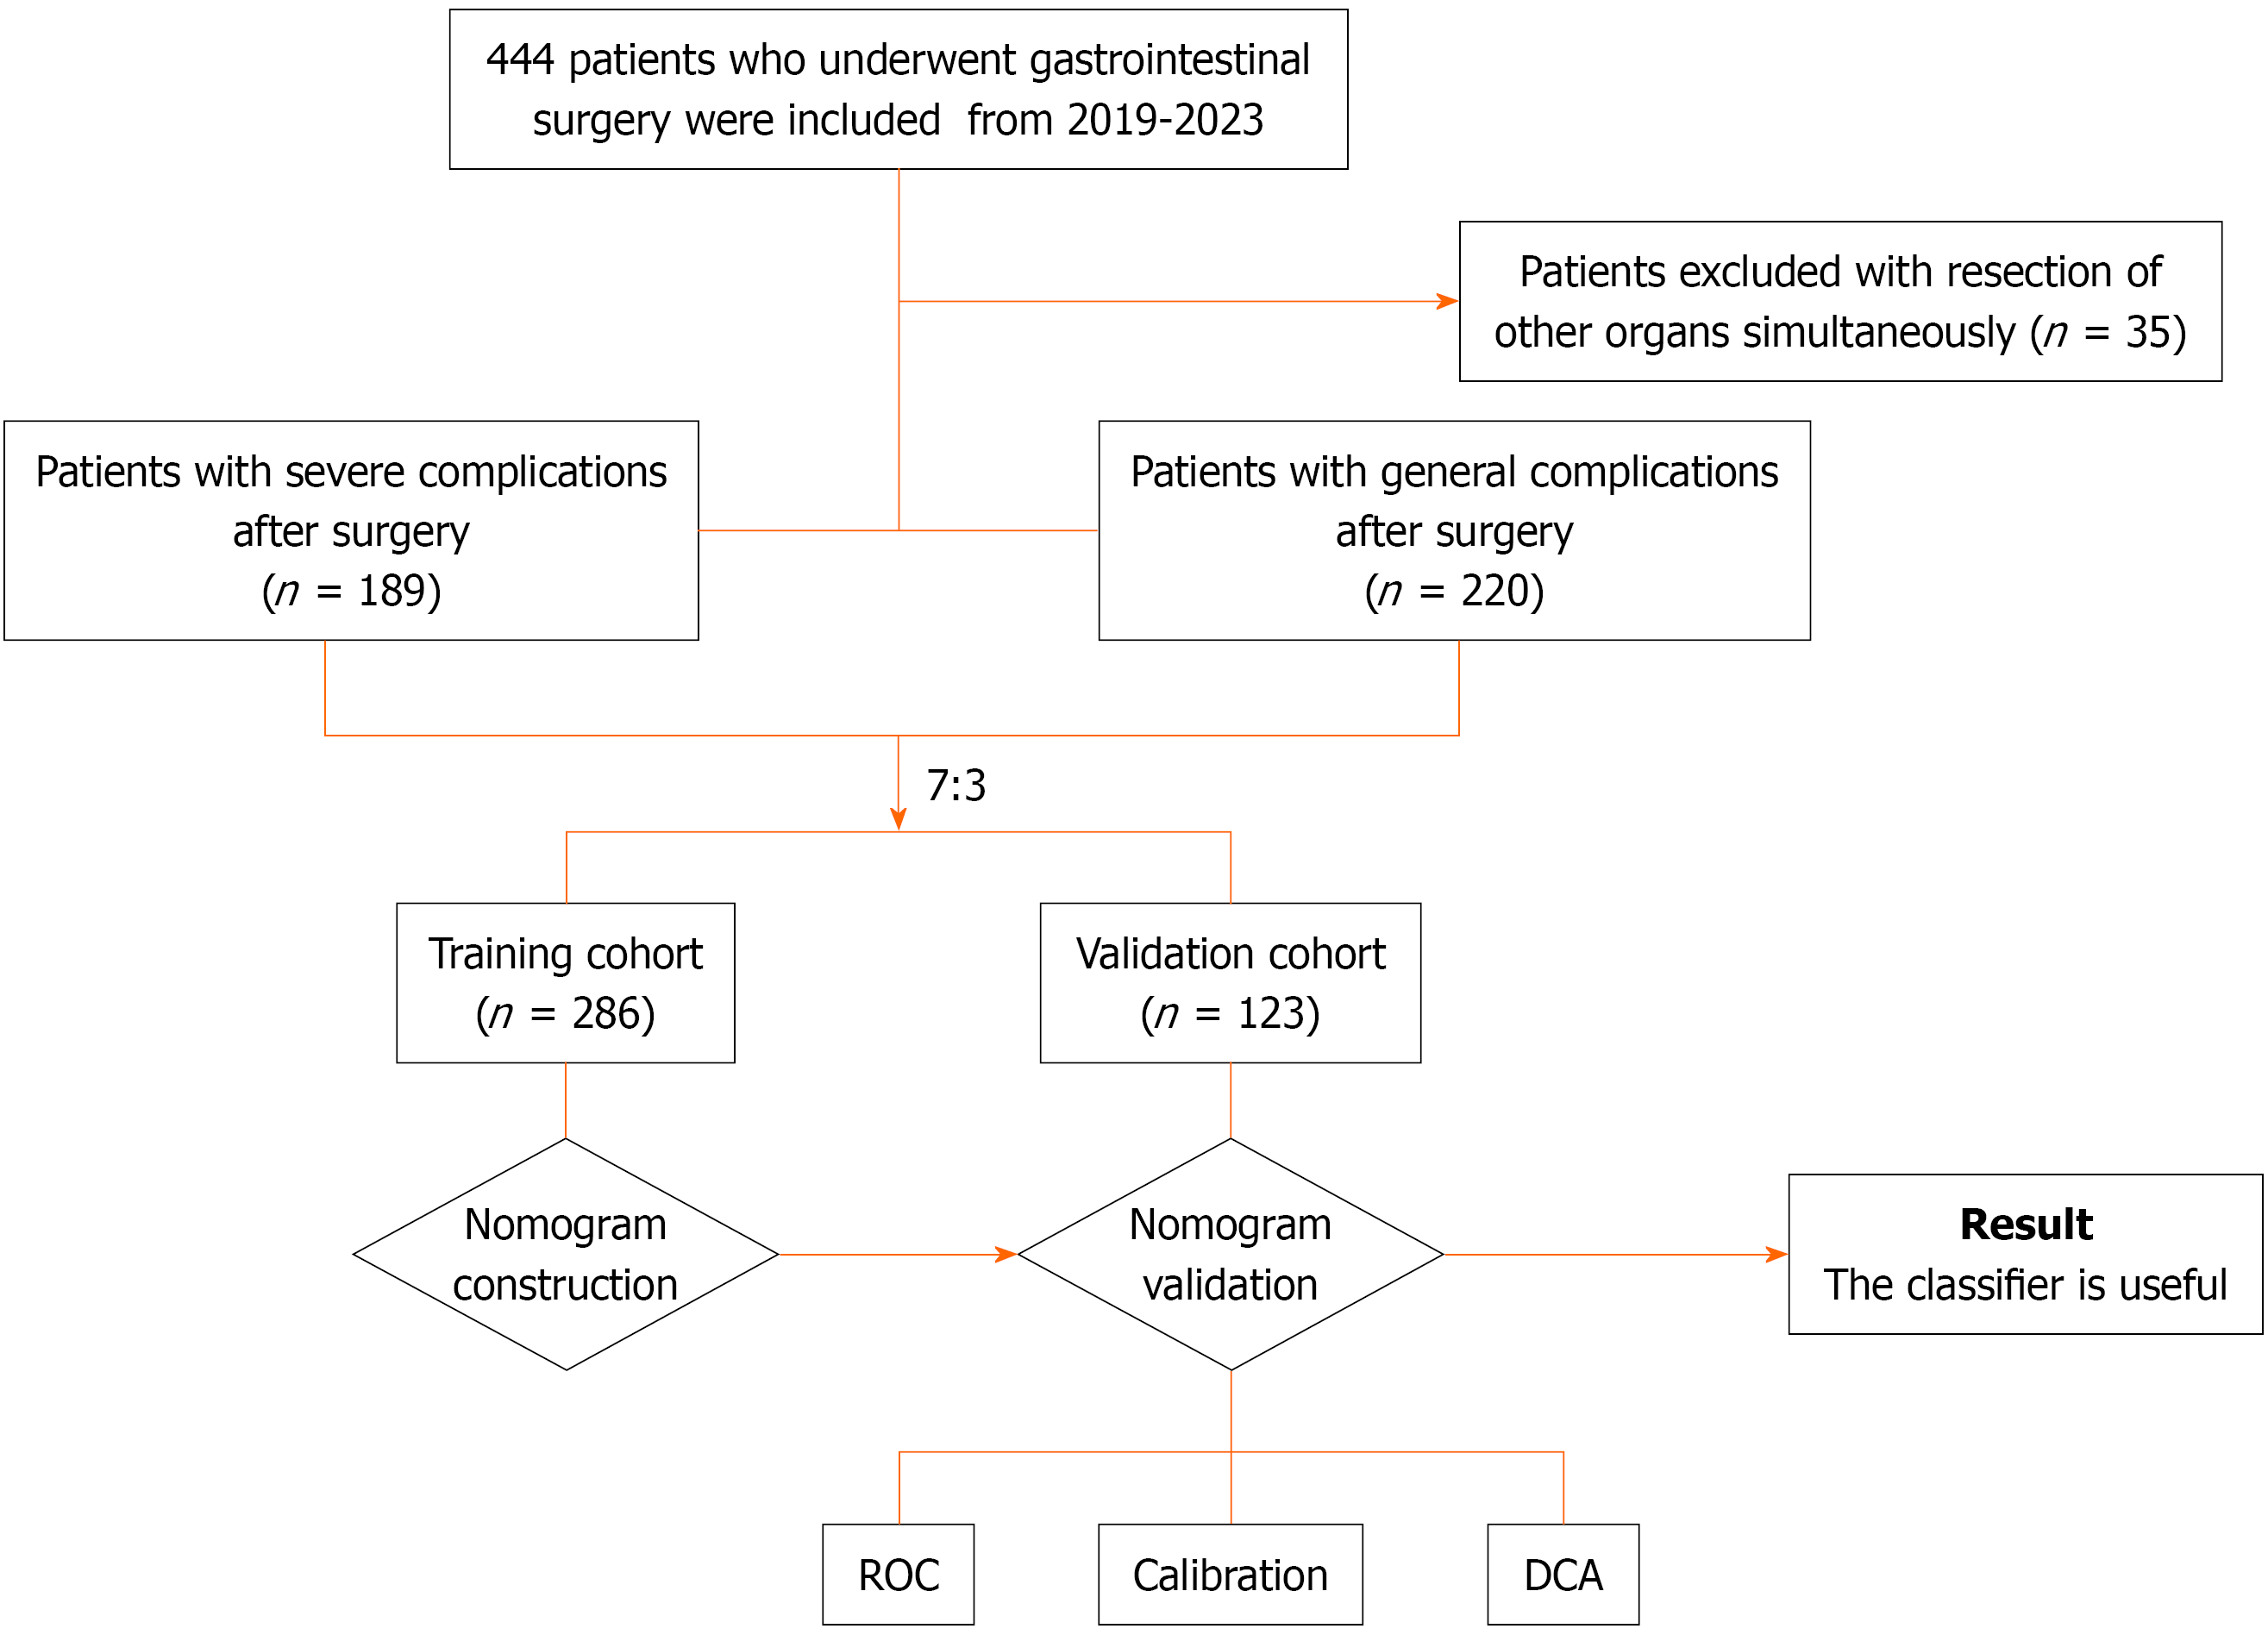
Figure 1 Flow diagram of the predictive model.
DCA: Decision curve analysis; ROC: Receiver operating characteristic.
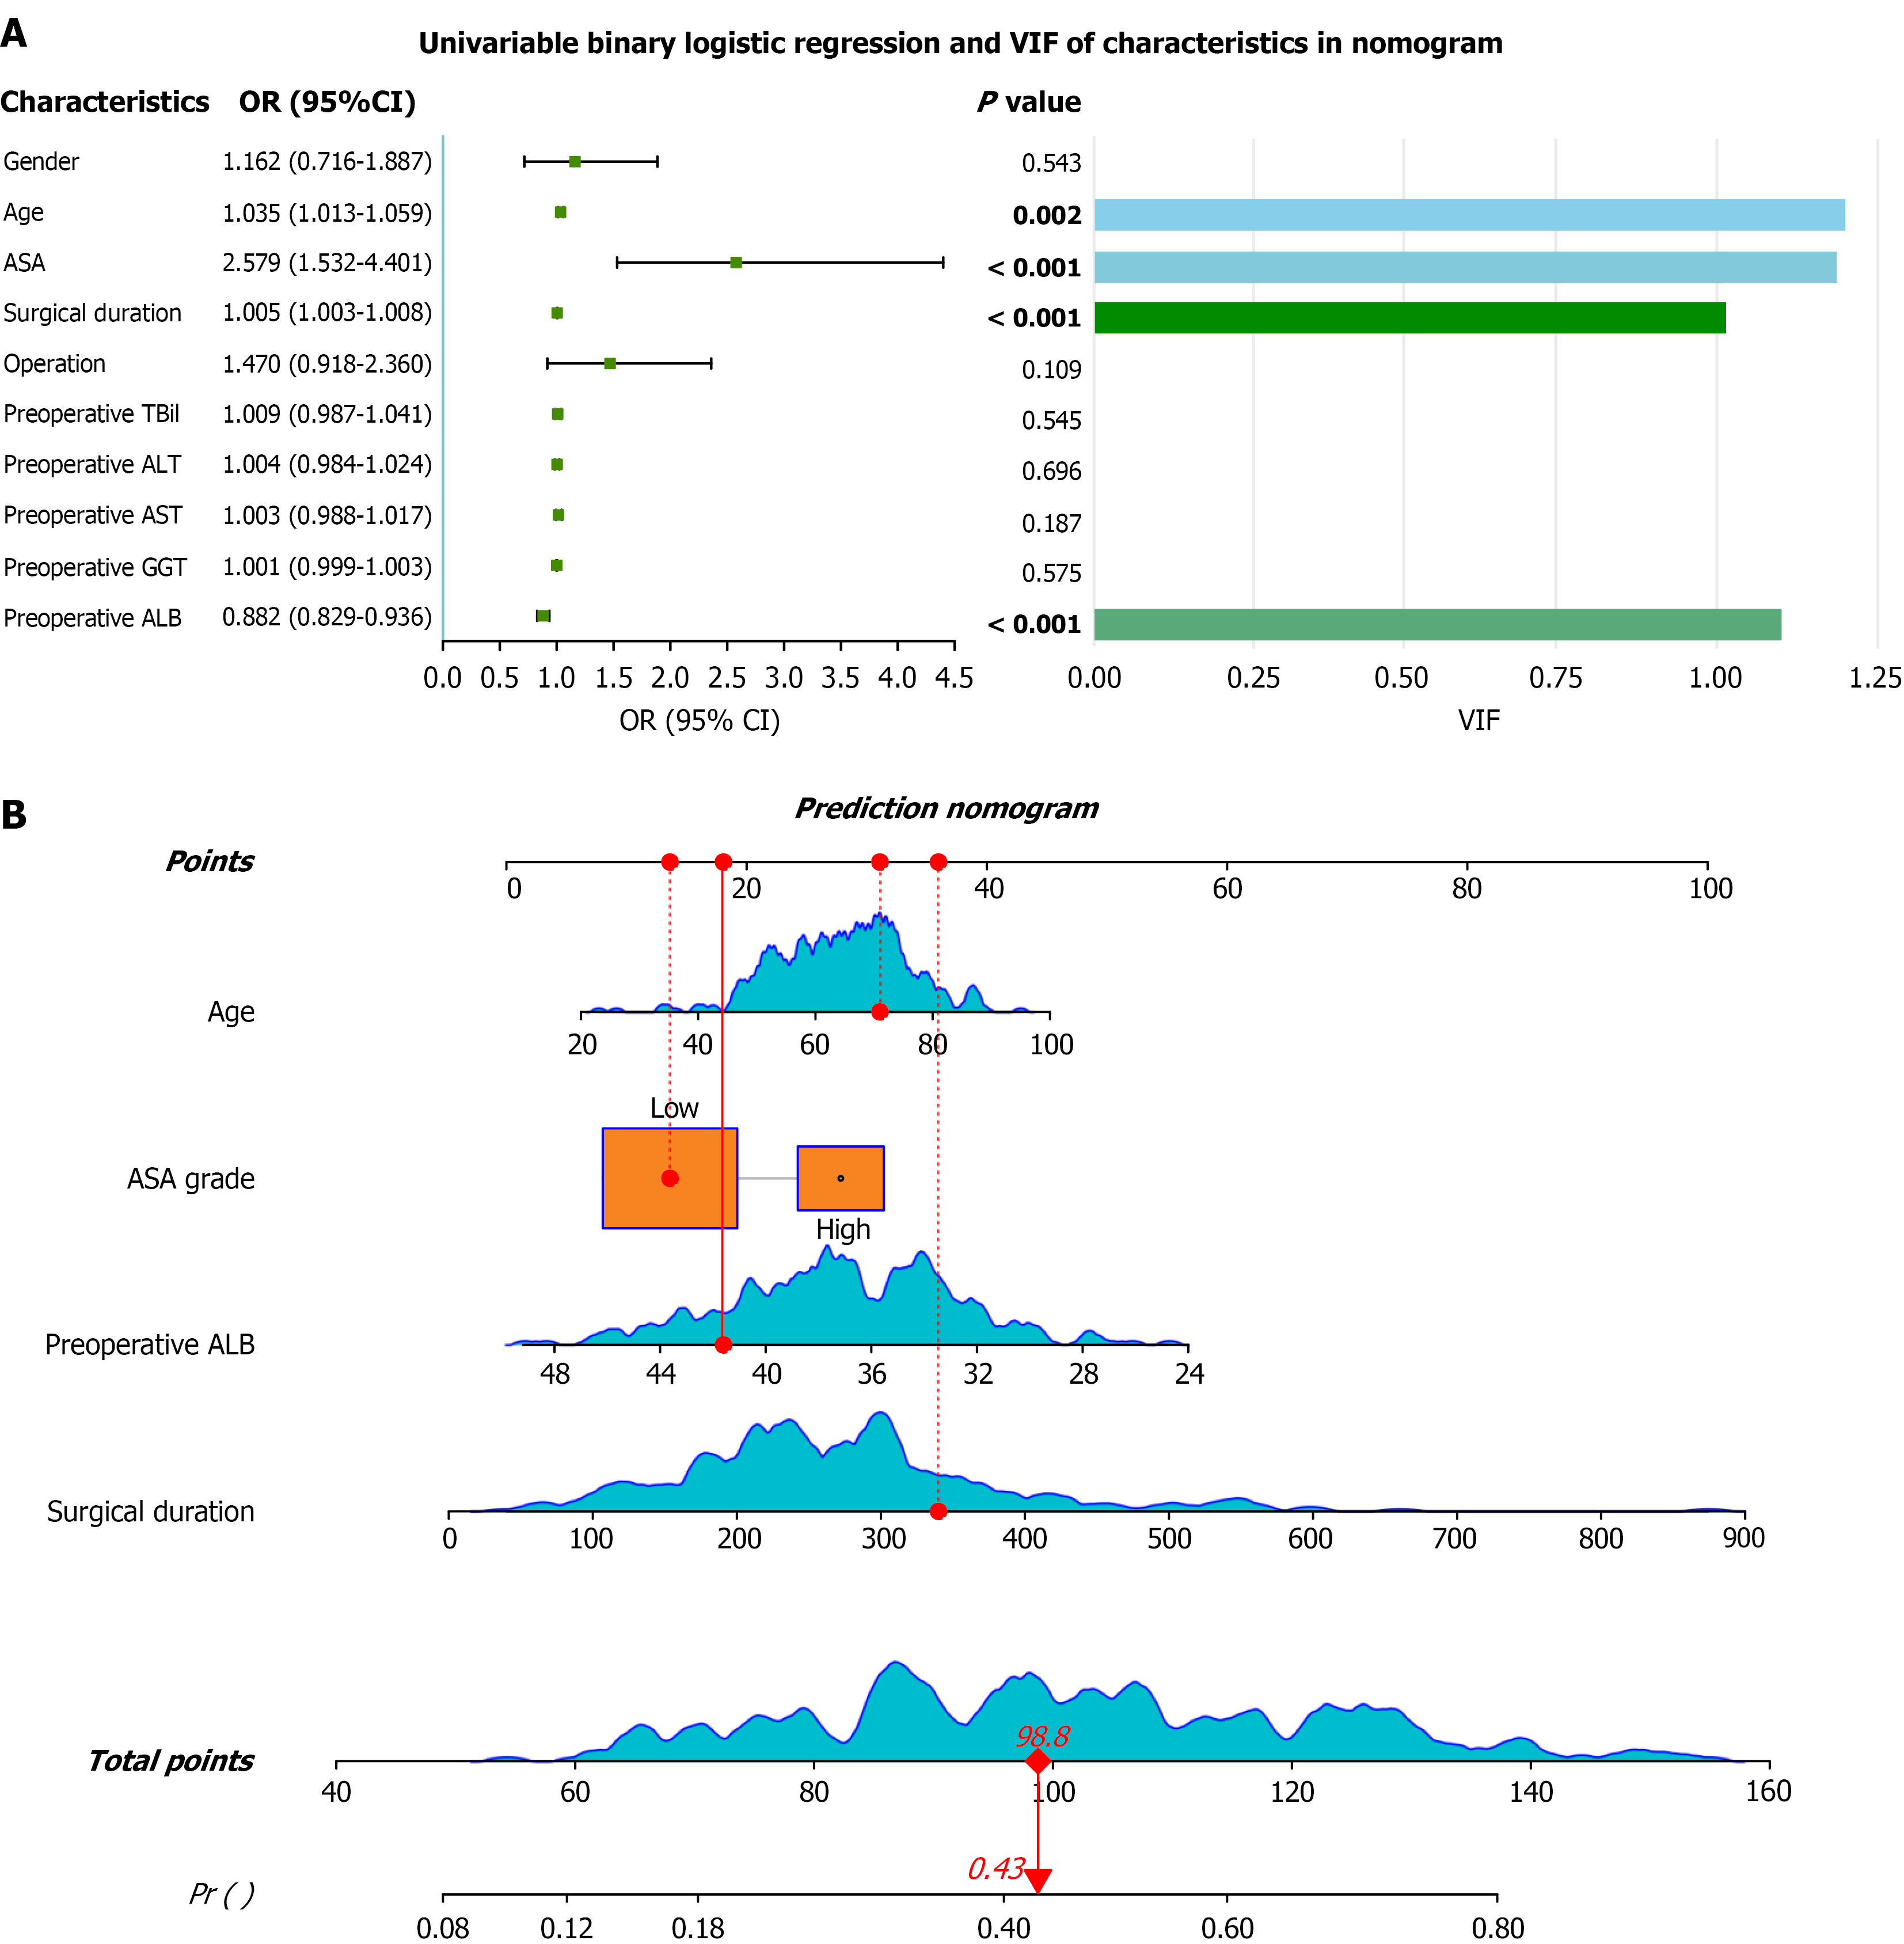
Figure 2 Construction of nomogram through variables selection.
A: The forest plot of univariable logistic regression for the training cohort, and the variance inflation factor values of characteristics incorporated into the nomogram; B: Nomogram for predicting severe complications after gastrointestinal surgery. ALB: Albumin; ALT: Alanine aminotransferase; ASA: American society of Anesthesiologists; AST: Aspartate aminotransferase; GGT: Gamma-glutamyl transferase; OR: Odds ratio; TBil: Total bilirubin; VIF: Variance inflation factor.
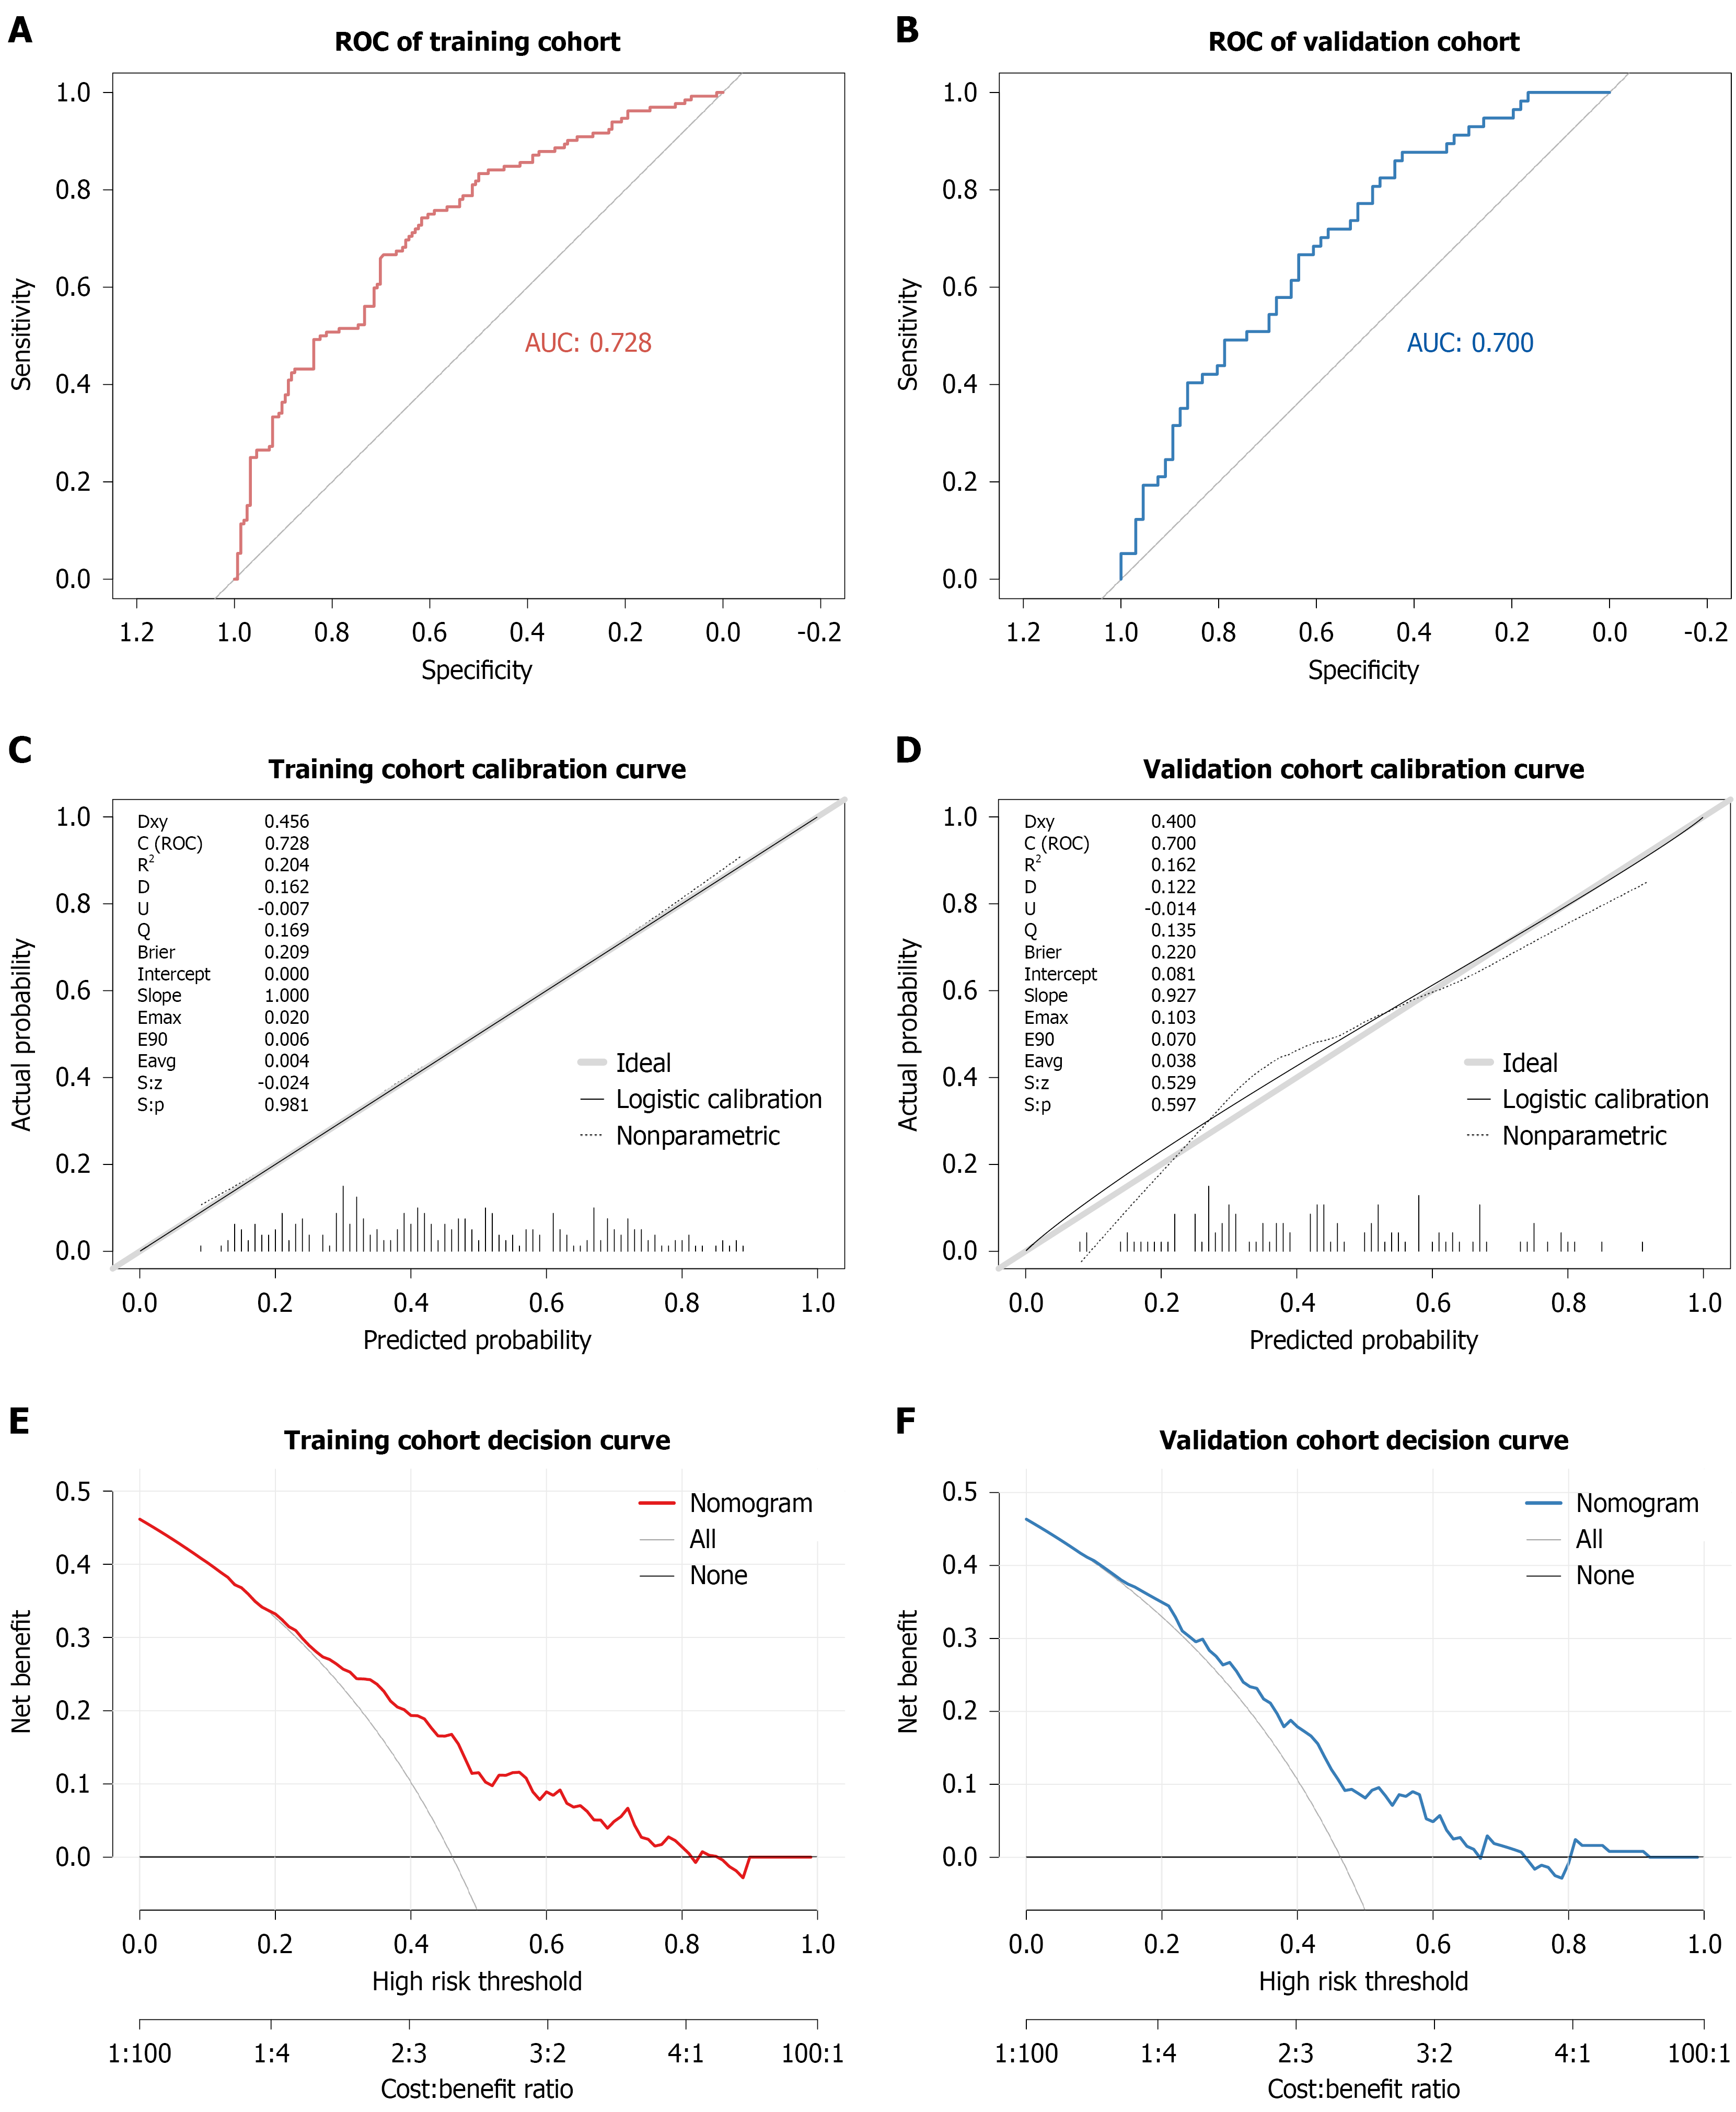
Figure 3 Discrimination, calibration, and decision curve of nomogram for predicting severe complications after gastrointestinal surgery.
A: Training cohort receiver operating characteristic curve; B: Validation cohort receiver operating characteristic (ROC) curve; C: Training cohort calibration curve; D: Validation cohort calibration curve; E: Training cohort decision curve; F: Validation cohort decision curve. AUC: Area under the curve.
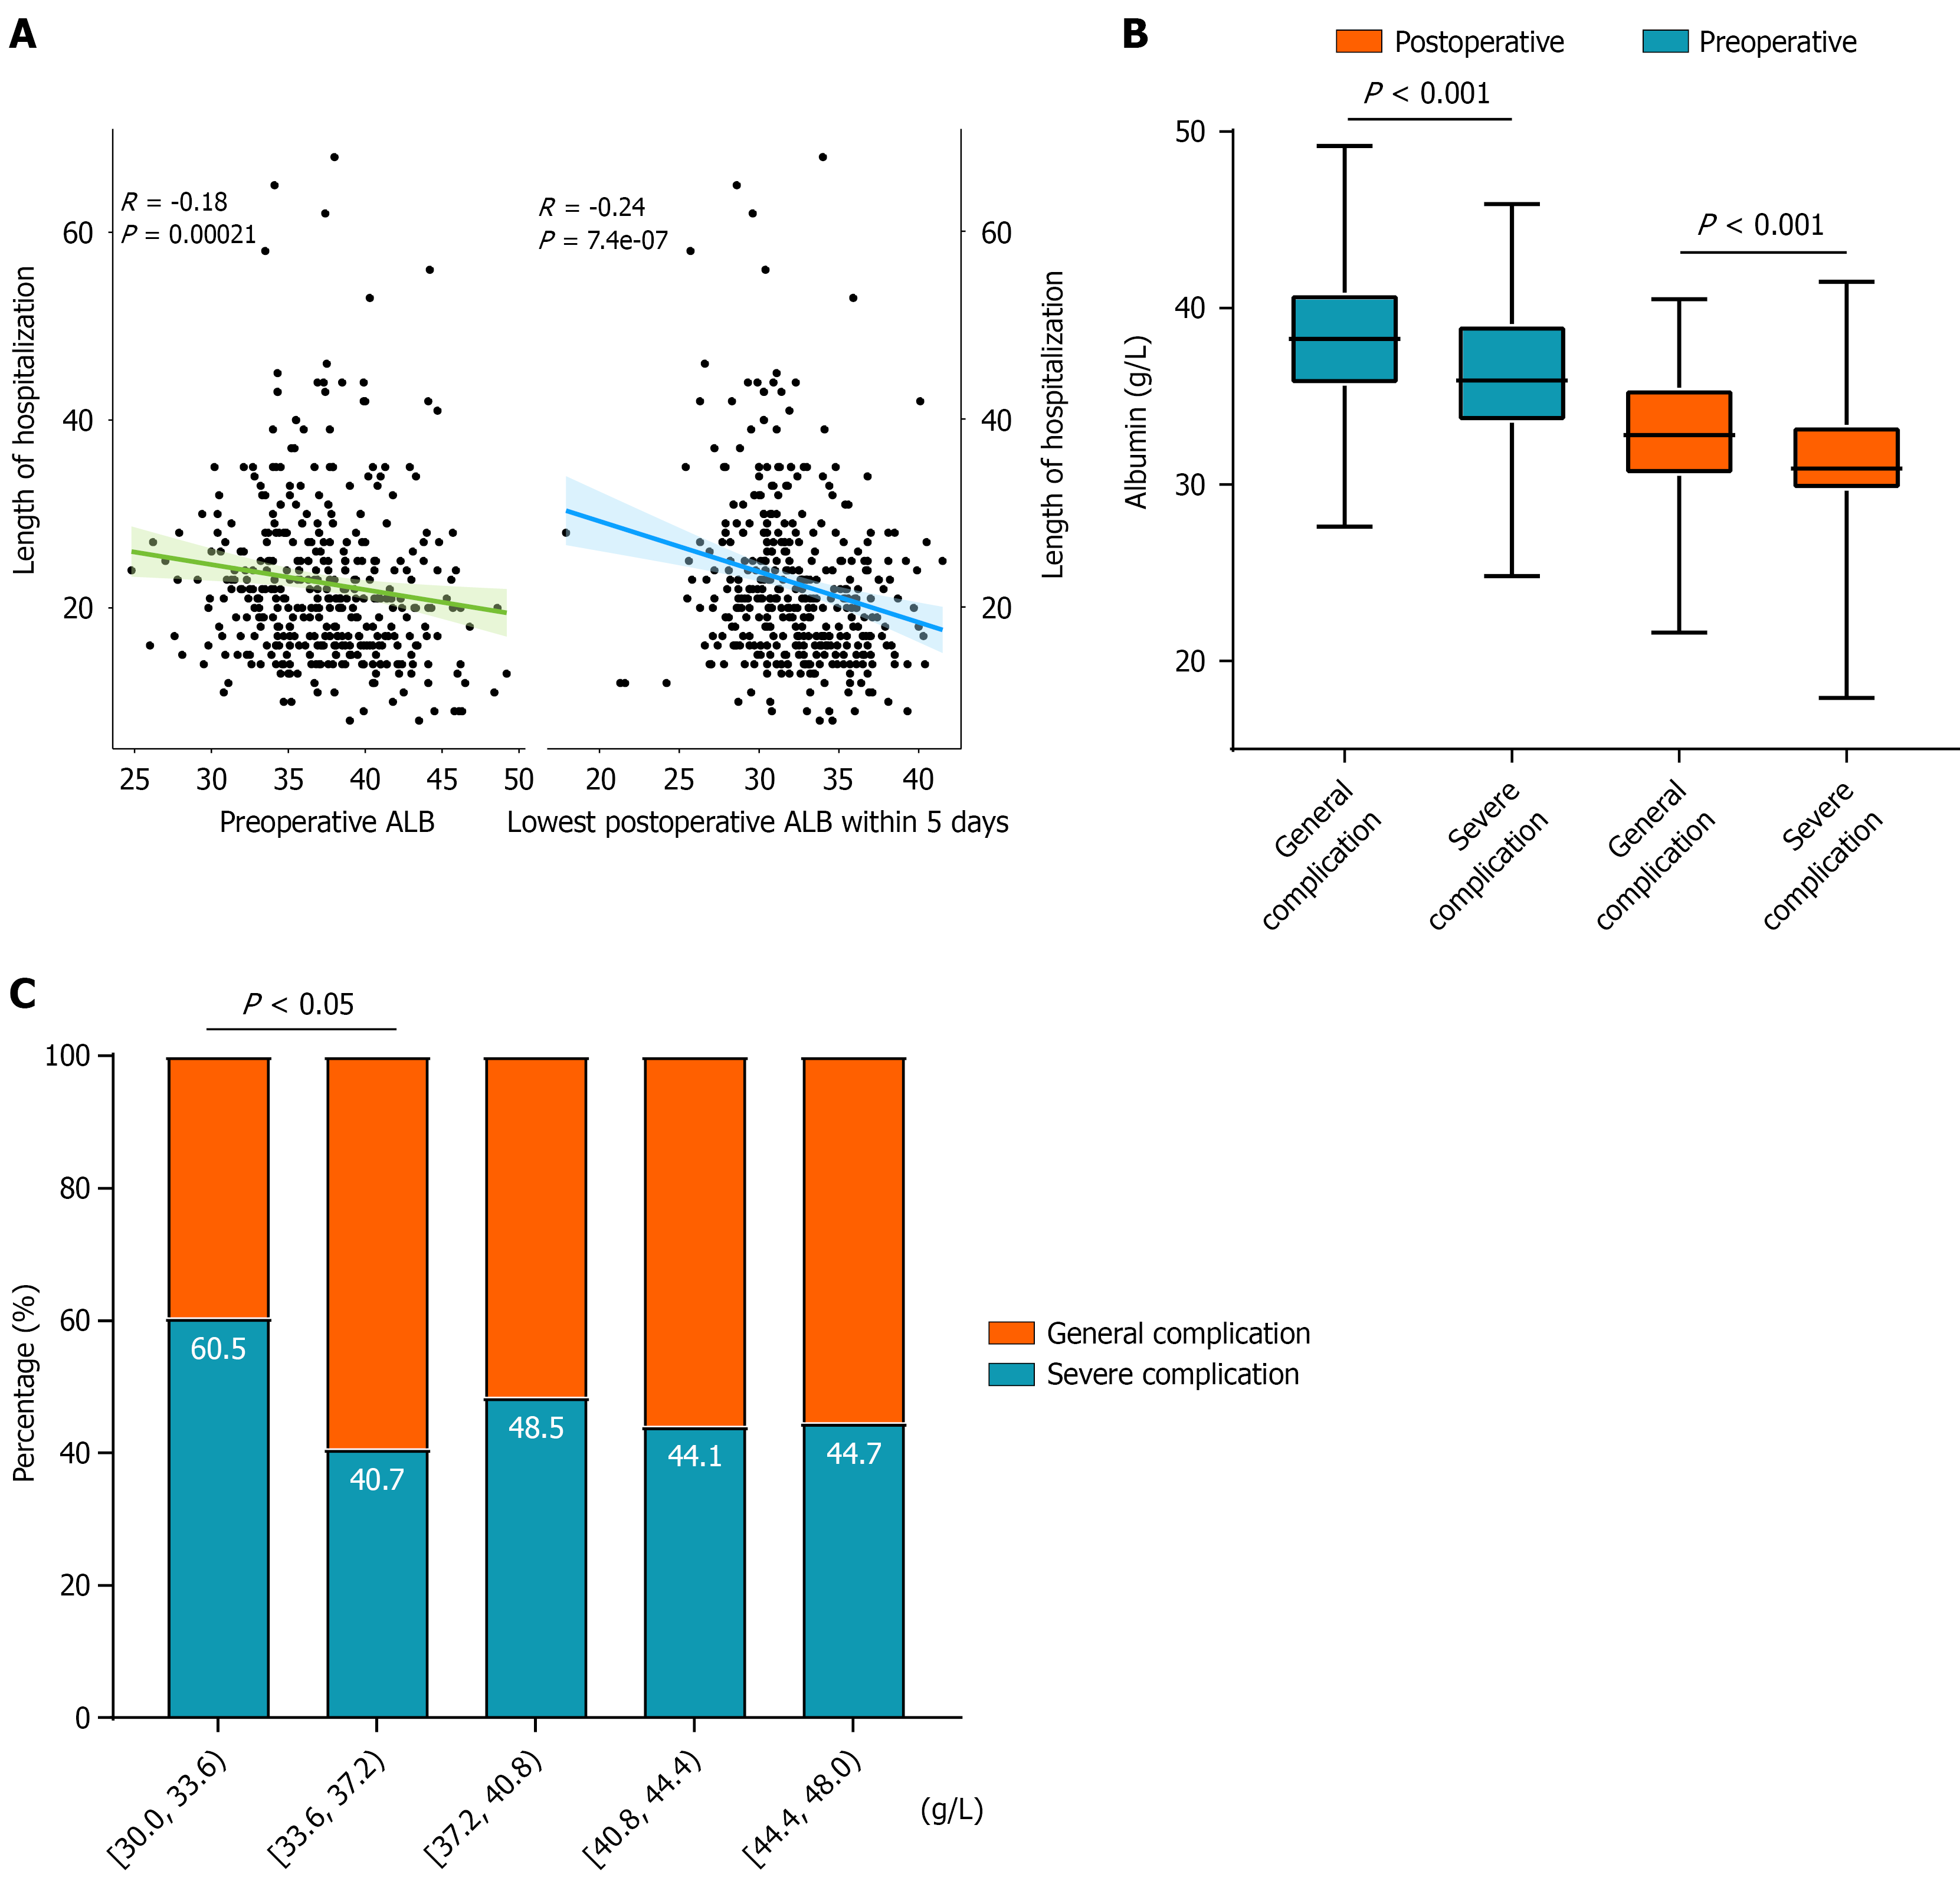
Figure 4 Association between albumin levels and severe complications.
A: Correlation analysis albumin (ALB) level and length of hospitalization; B: Comparison of ALB levels between general complication and severe complication group; C: Distribution of incidence of severe postoperative complications across different ALB level ranges.
- Citation: Feng F, Wang JG, Li C, Qiu ZC, An Y, Ren ZT, Chen JF, Gong L, Peng JR. Albumin as a predictor in a nomogram for severe complications following gastrointestinal surgery and how to manage it. World J Gastrointest Surg 2026; 18(7): 119151
- URL: https://www.wjgnet.com/1948-9366/full/v18/i7/119151.htm
- DOI: https://dx.doi.org/10.4240/wjgs.v18.i7.119151