
















Copyright: ©Author(s) 2026.
World J Gastrointest Surg. May 27, 2026; 18(5): 118468
Published online May 27, 2026. doi: 10.4240/wjgs.v18.i5.118468
Published online May 27, 2026. doi: 10.4240/wjgs.v18.i5.118468
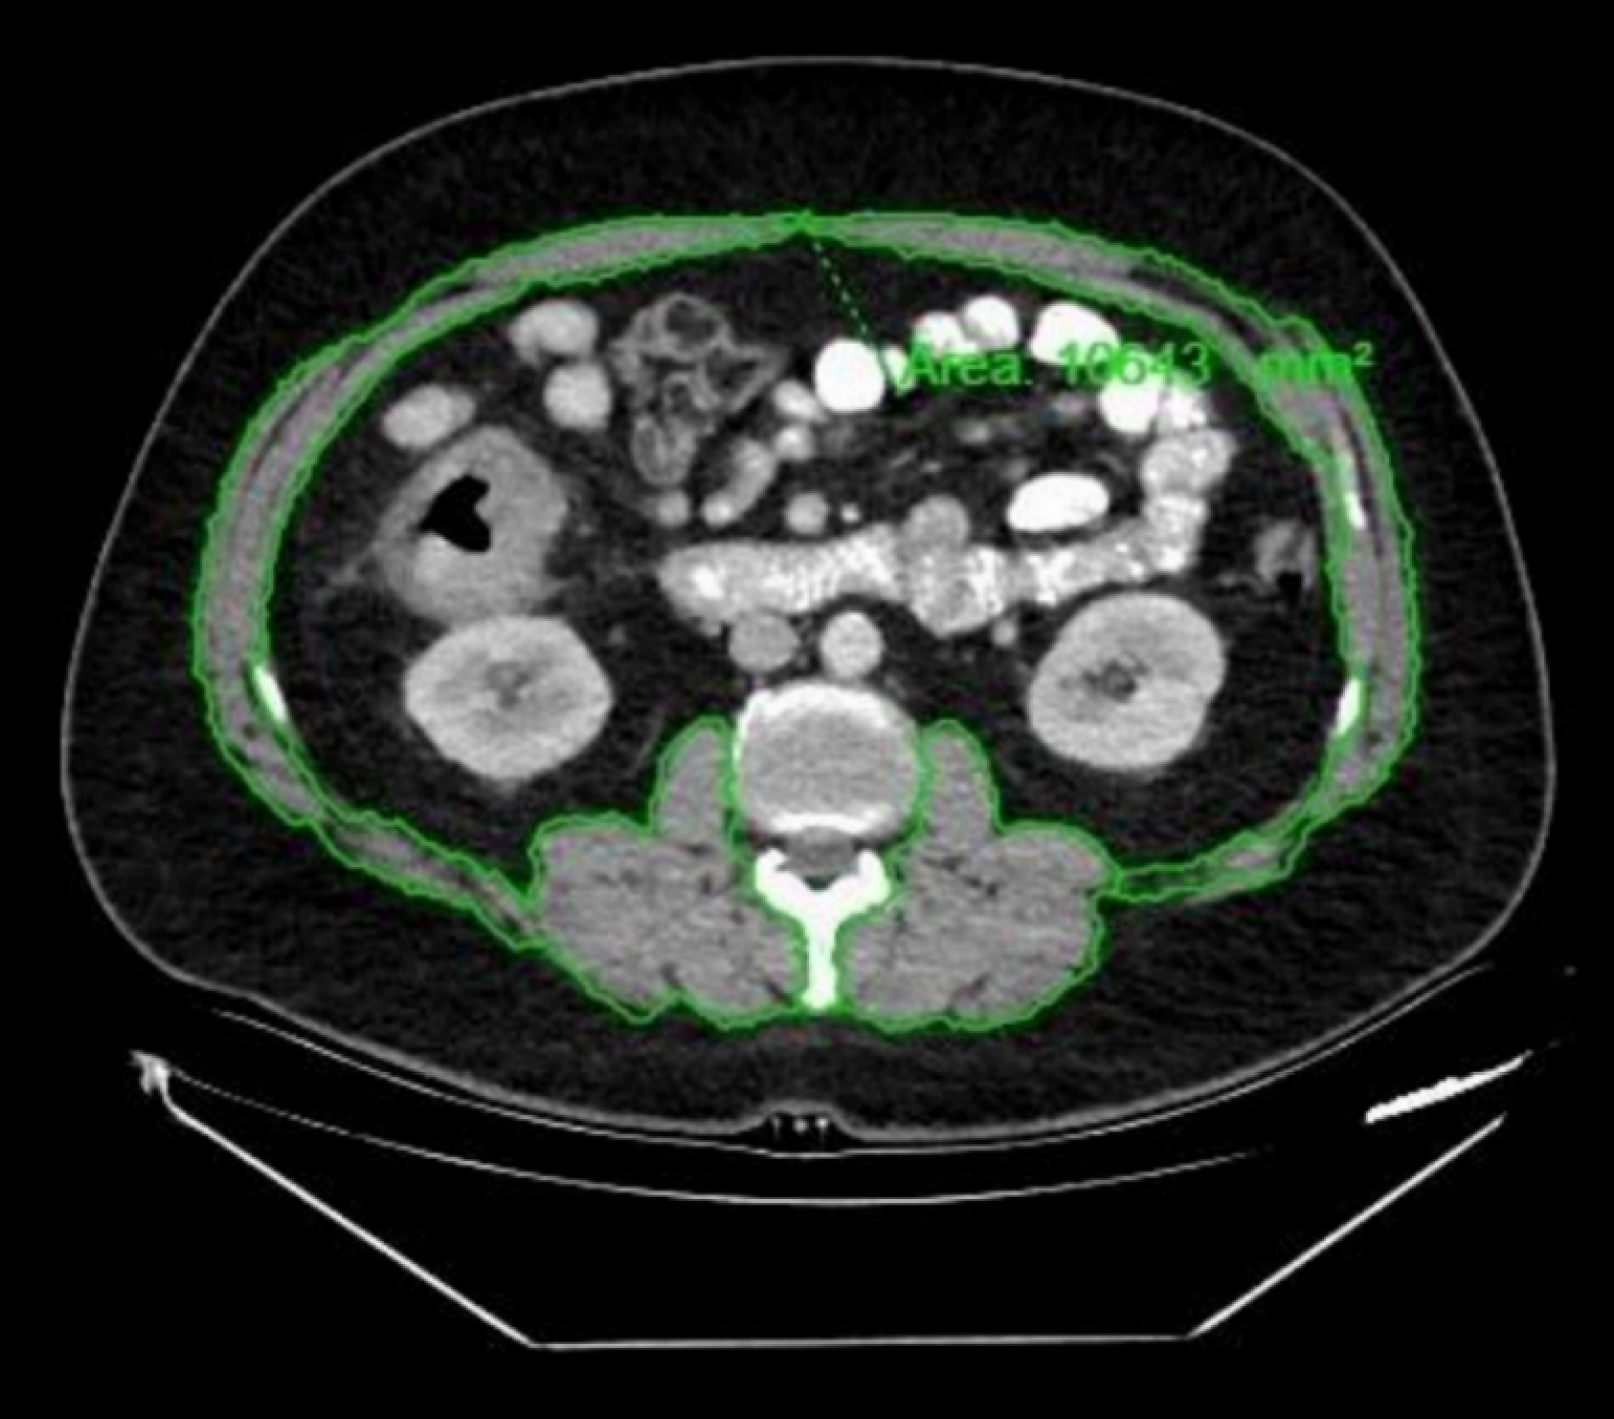
Figure 1 Axial computed tomography image at the third lumbar vertebra level showing the segmented skeletal muscle area (outlined in green).
Skeletal muscle index was calculated as the cross-sectional area of the psoas, paraspinal, and abdominal wall muscles at the third lumbar vertebra level, normalized for height squared (cm2/m2).
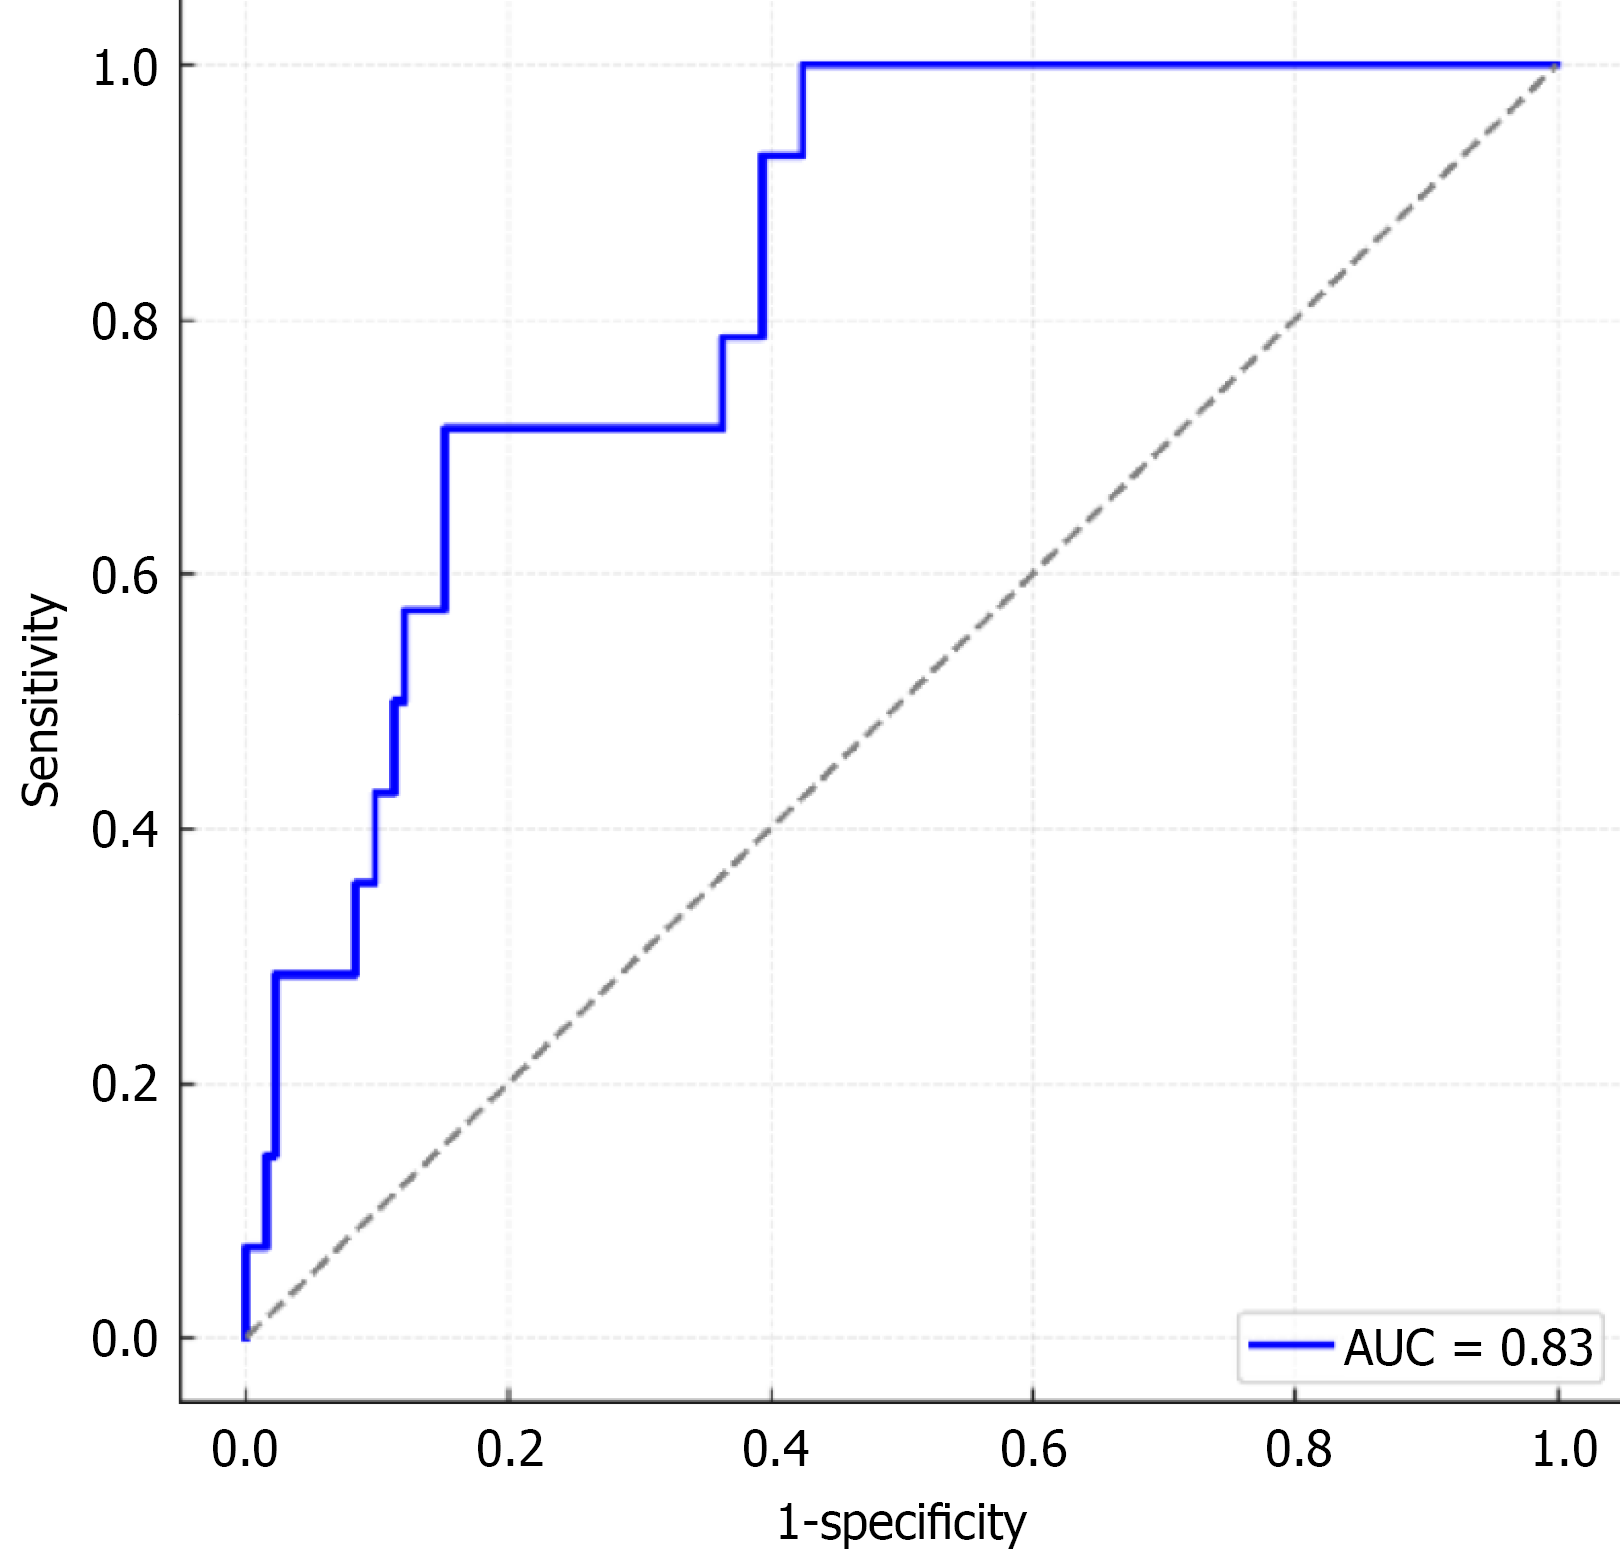
Figure 2 Receiver operating characteristic curve demonstrating the predictive accuracy of the multivariate logistic regression model incorporating sarcopenia, American Society of Anesthesiologists score, operative time, and handgrip strength.
The model was developed for exploratory purposes; therefore, no specific clinical cut-off value was defined. AUC: Area under the curve.
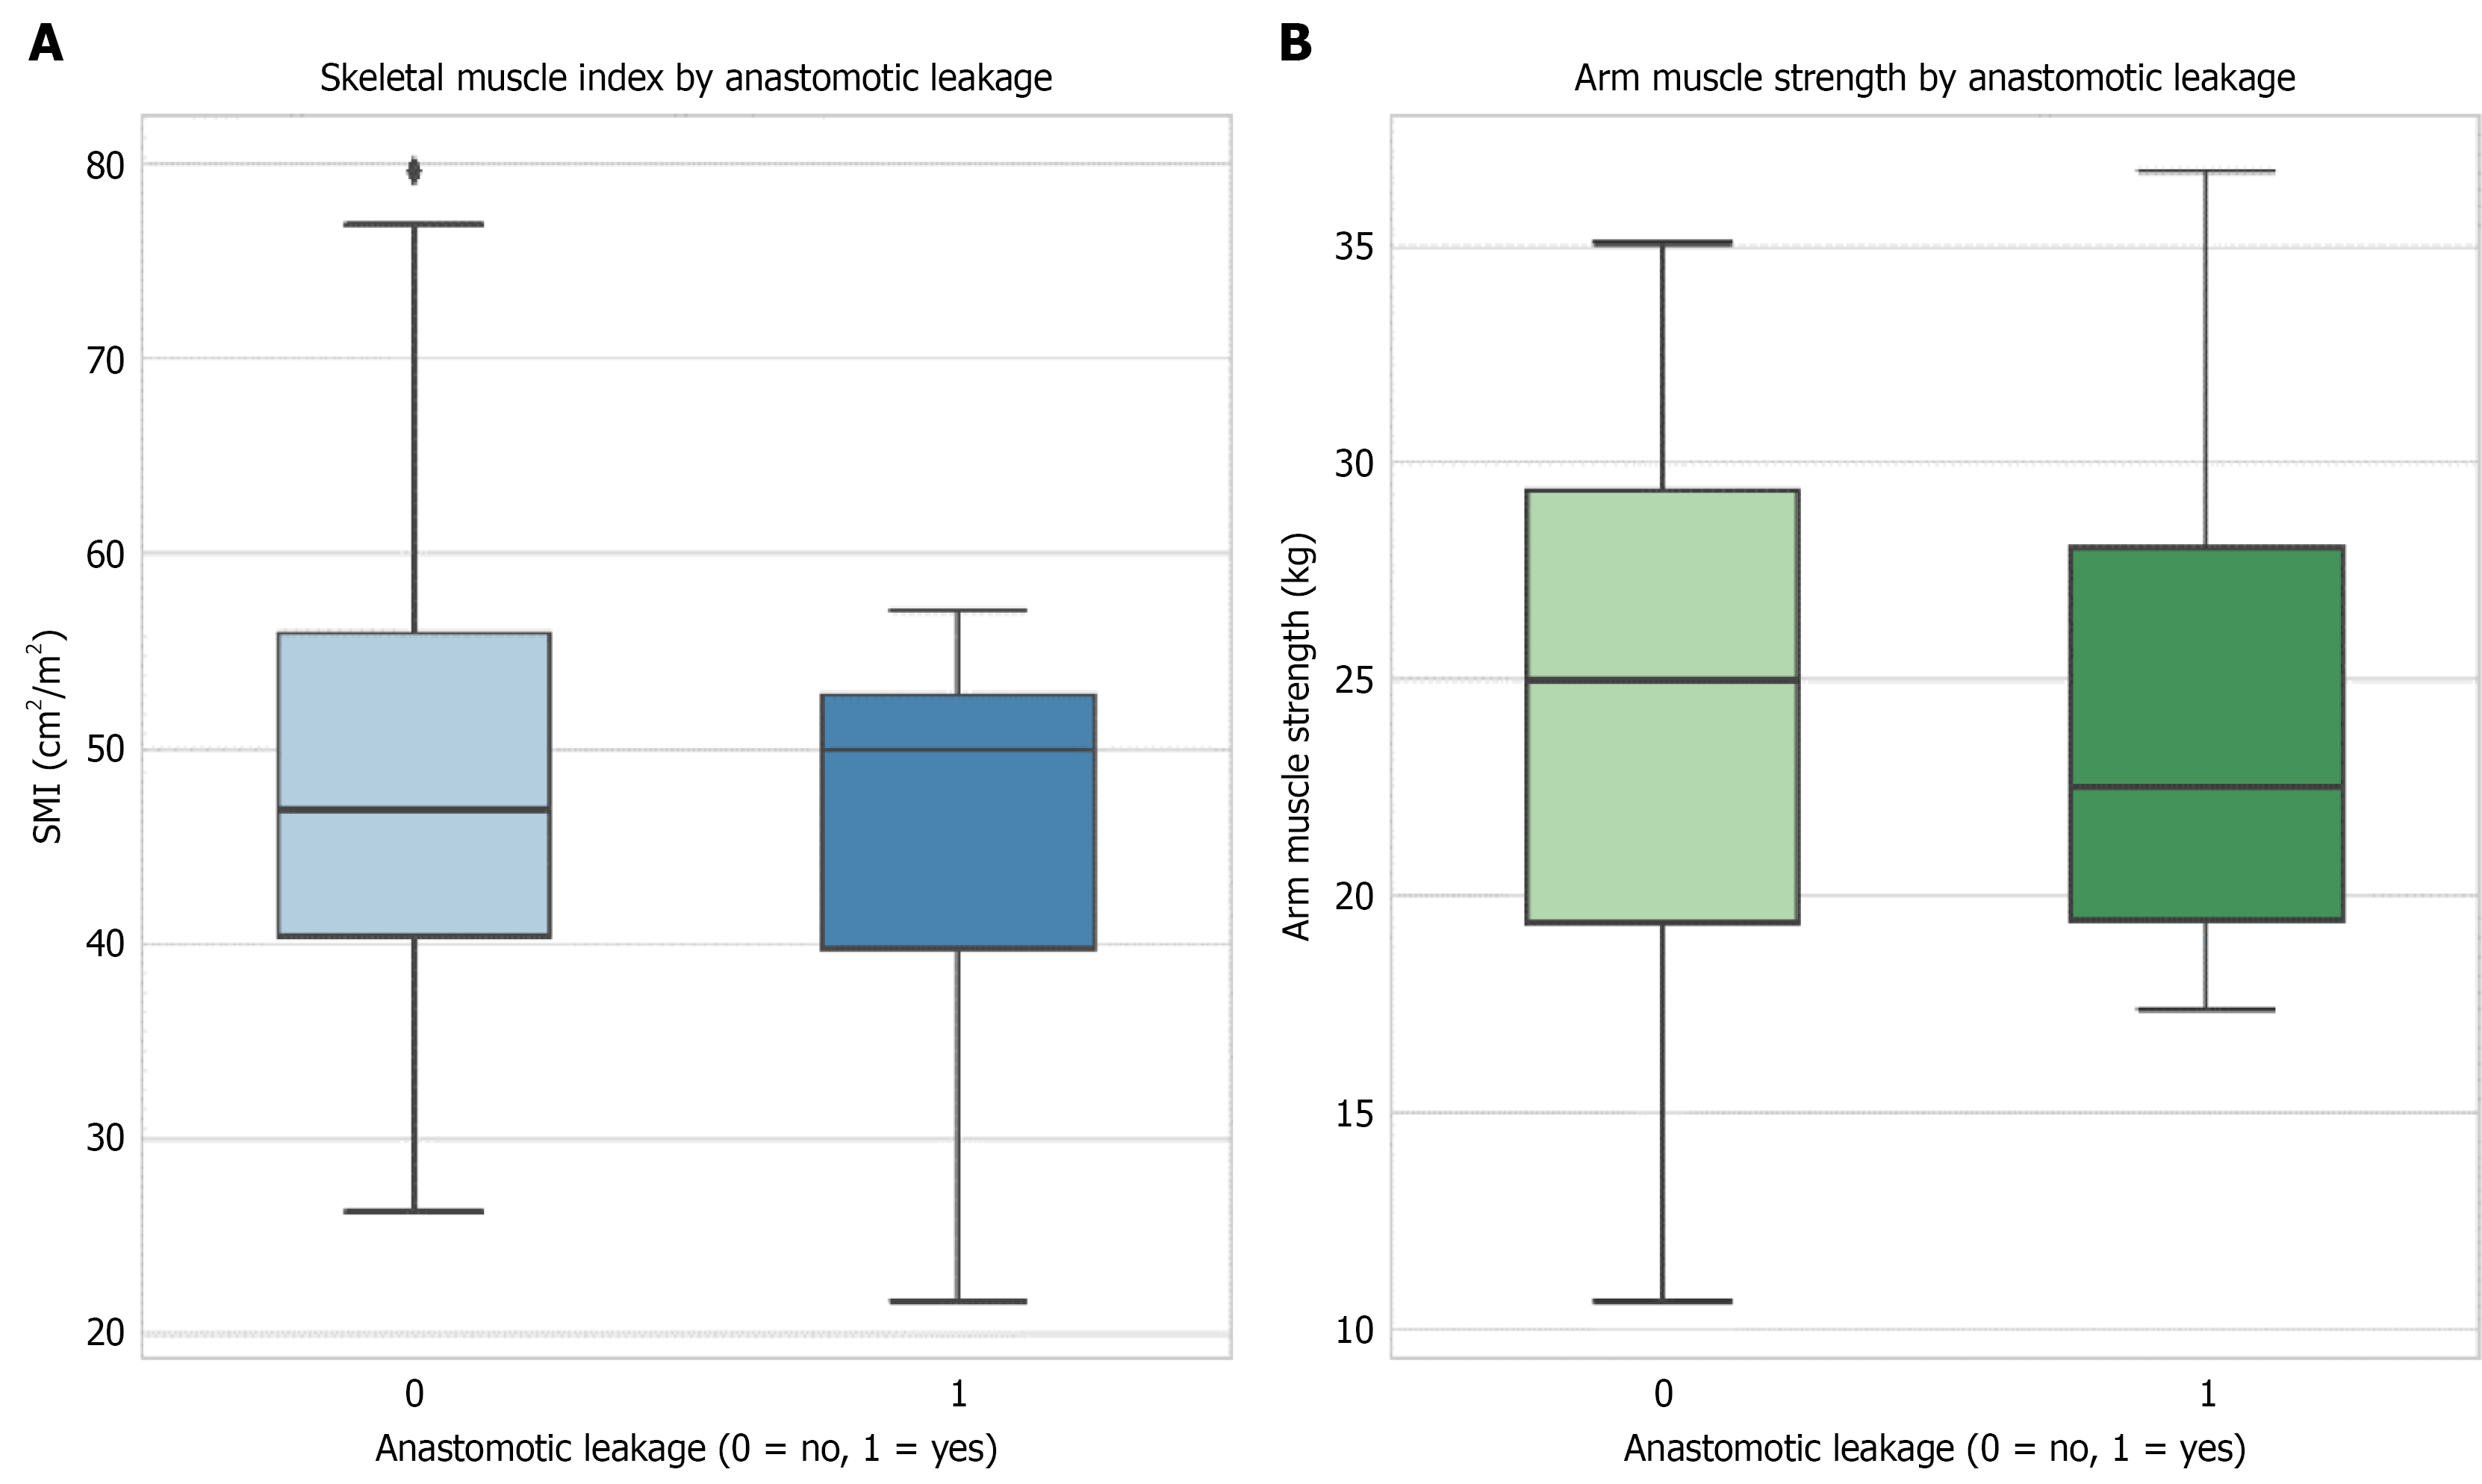
Figure 3 Box-and-whisker plots demonstrating the distribution of skeletal muscle index and handgrip strength according to anastomotic leakage status.
A: Patients who developed anastomotic leakage (n = 103) exhibited significantly lower skeletal mass index (cm2/m2) values (P = 0.03) compared with those without anastomotic leakage (n = 14); B: Patients who developed anastomotic leakage (n = 103) exhibited reduced handgrip strength (kg; P < 0.001) compared with those without anastomotic leakage (n = 14). SMI: Skeletal mass index.
- Citation: Gökdere OG, Öndeş B, Kanat BH, Ünlü S. Weak grip, weak anastomosis? Handgrip strength and sarcopenia as predictors of anastomotic leakage after colorectal cancer surgery. World J Gastrointest Surg 2026; 18(5): 118468
- URL: https://www.wjgnet.com/1948-9366/full/v18/i5/118468.htm
- DOI: https://dx.doi.org/10.4240/wjgs.v18.i5.118468