
















Copyright: ©Author(s) 2026.
World J Gastrointest Surg. May 27, 2026; 18(5): 116822
Published online May 27, 2026. doi: 10.4240/wjgs.v18.i5.116822
Published online May 27, 2026. doi: 10.4240/wjgs.v18.i5.116822
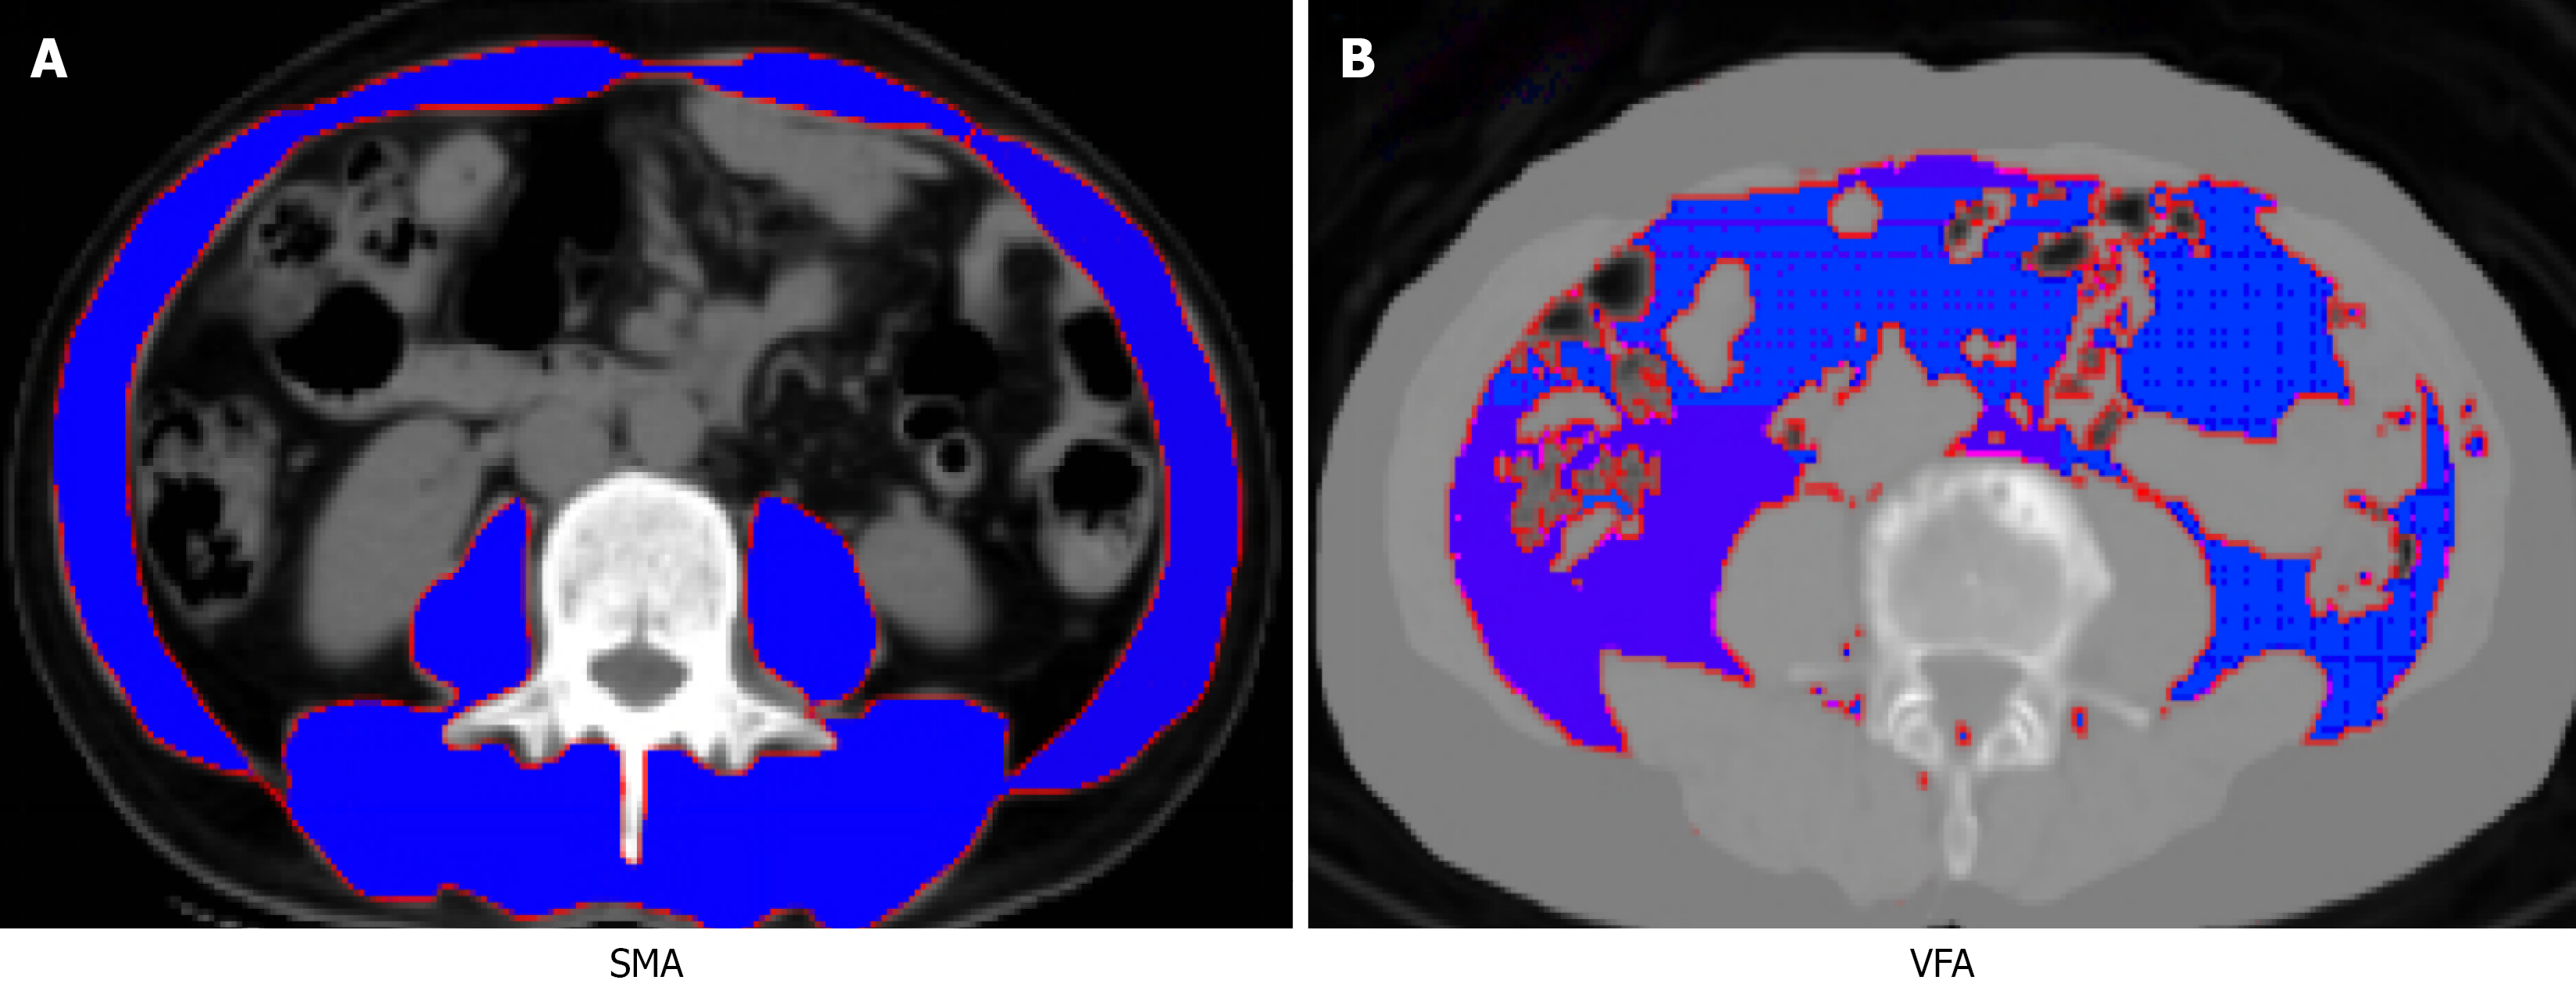
Figure 1 Computed tomography-based body composition analysis at the L3 vertebra.
Analyses were performed using ImageJ software. A: Skeletal muscle area was delineated using HU thresholds of -29 HU to 150 HU; B: Visceral fat area was delineated using thresholds of -150 HU to -50 HU. SMA: Skeletal muscle area; VFA: Visceral fat area.
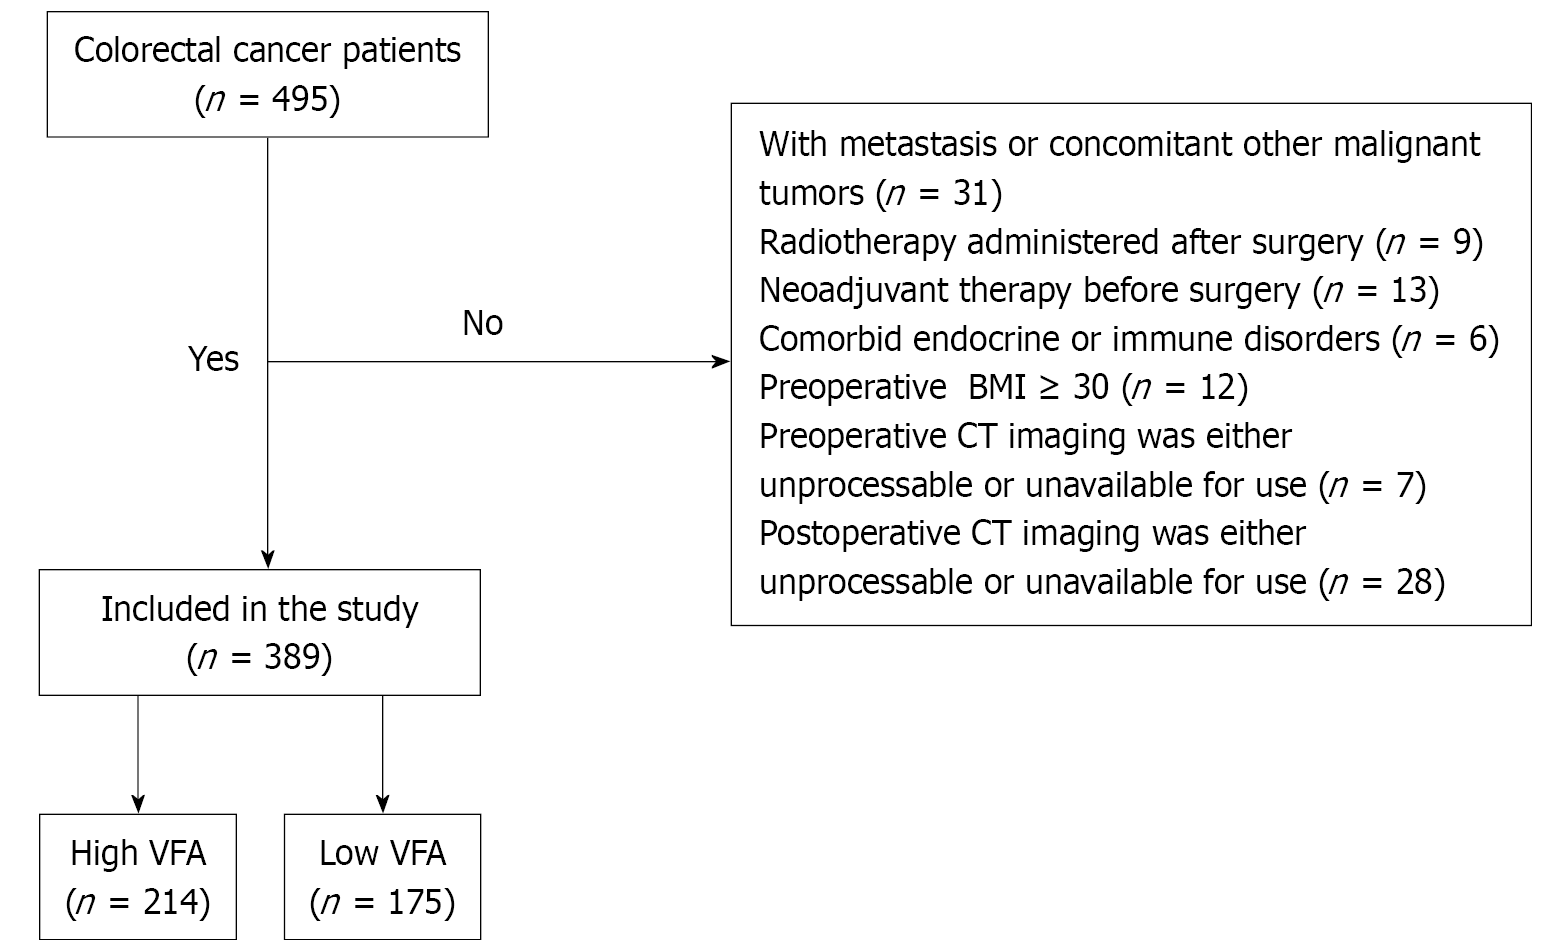
Figure 2 Flowchart of patient selection.
Of 495 initially screened colorectal cancer patients, 389 were included in the final analysis after applying inclusion and exclusion criteria. VFA: Visceral fat area; BMI: Body mass index; CT: Computed tomography.
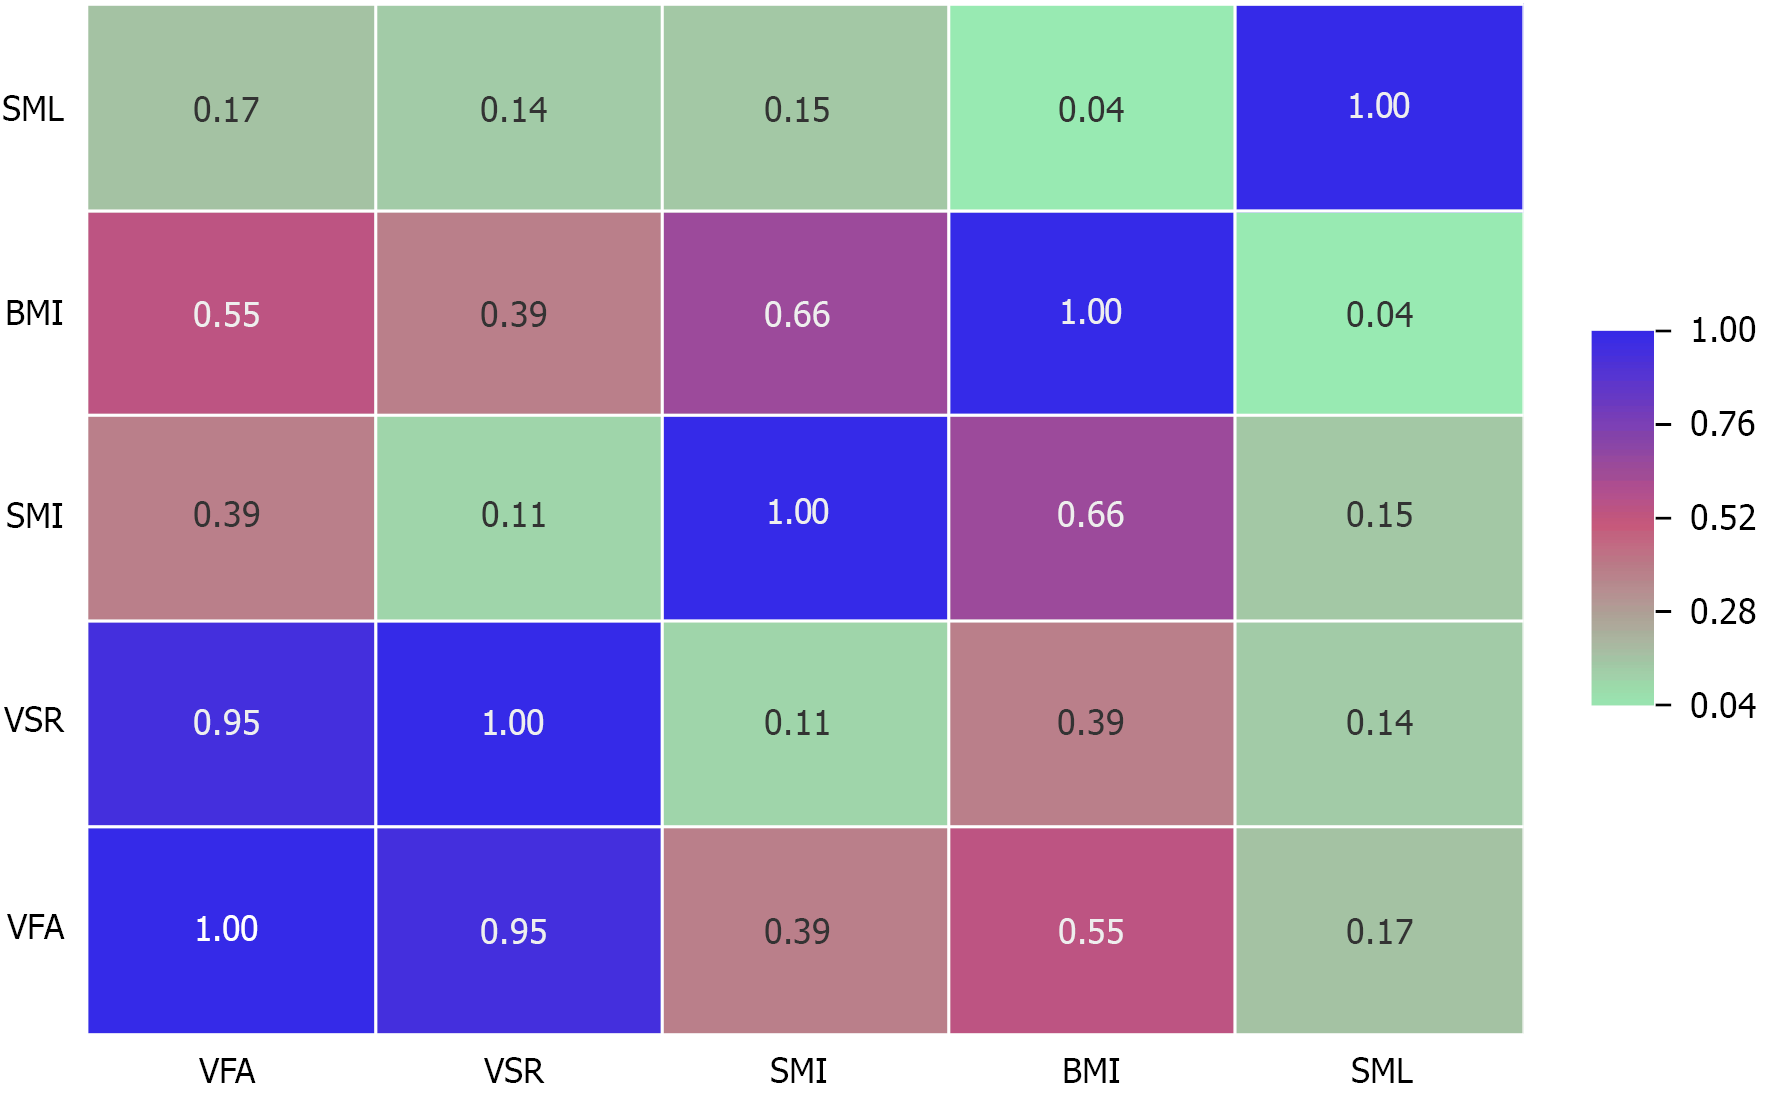
Figure 3 Spearman correlation heatmap among body composition parameters and skeletal color intensity represents the correlation coefficient.
Interpretation: r < 0.1, negligible; r < 0.3, weak; r < 0.5, moderate; r < 0.7, strong; r ≤ 1.0, very strong. SML: Skeletal muscle loss; BMI: Body mass index; SMI: Skeletal muscle index; VSR: Visceral-to-skeletal muscle ratio; VFA: Visceral fat area.
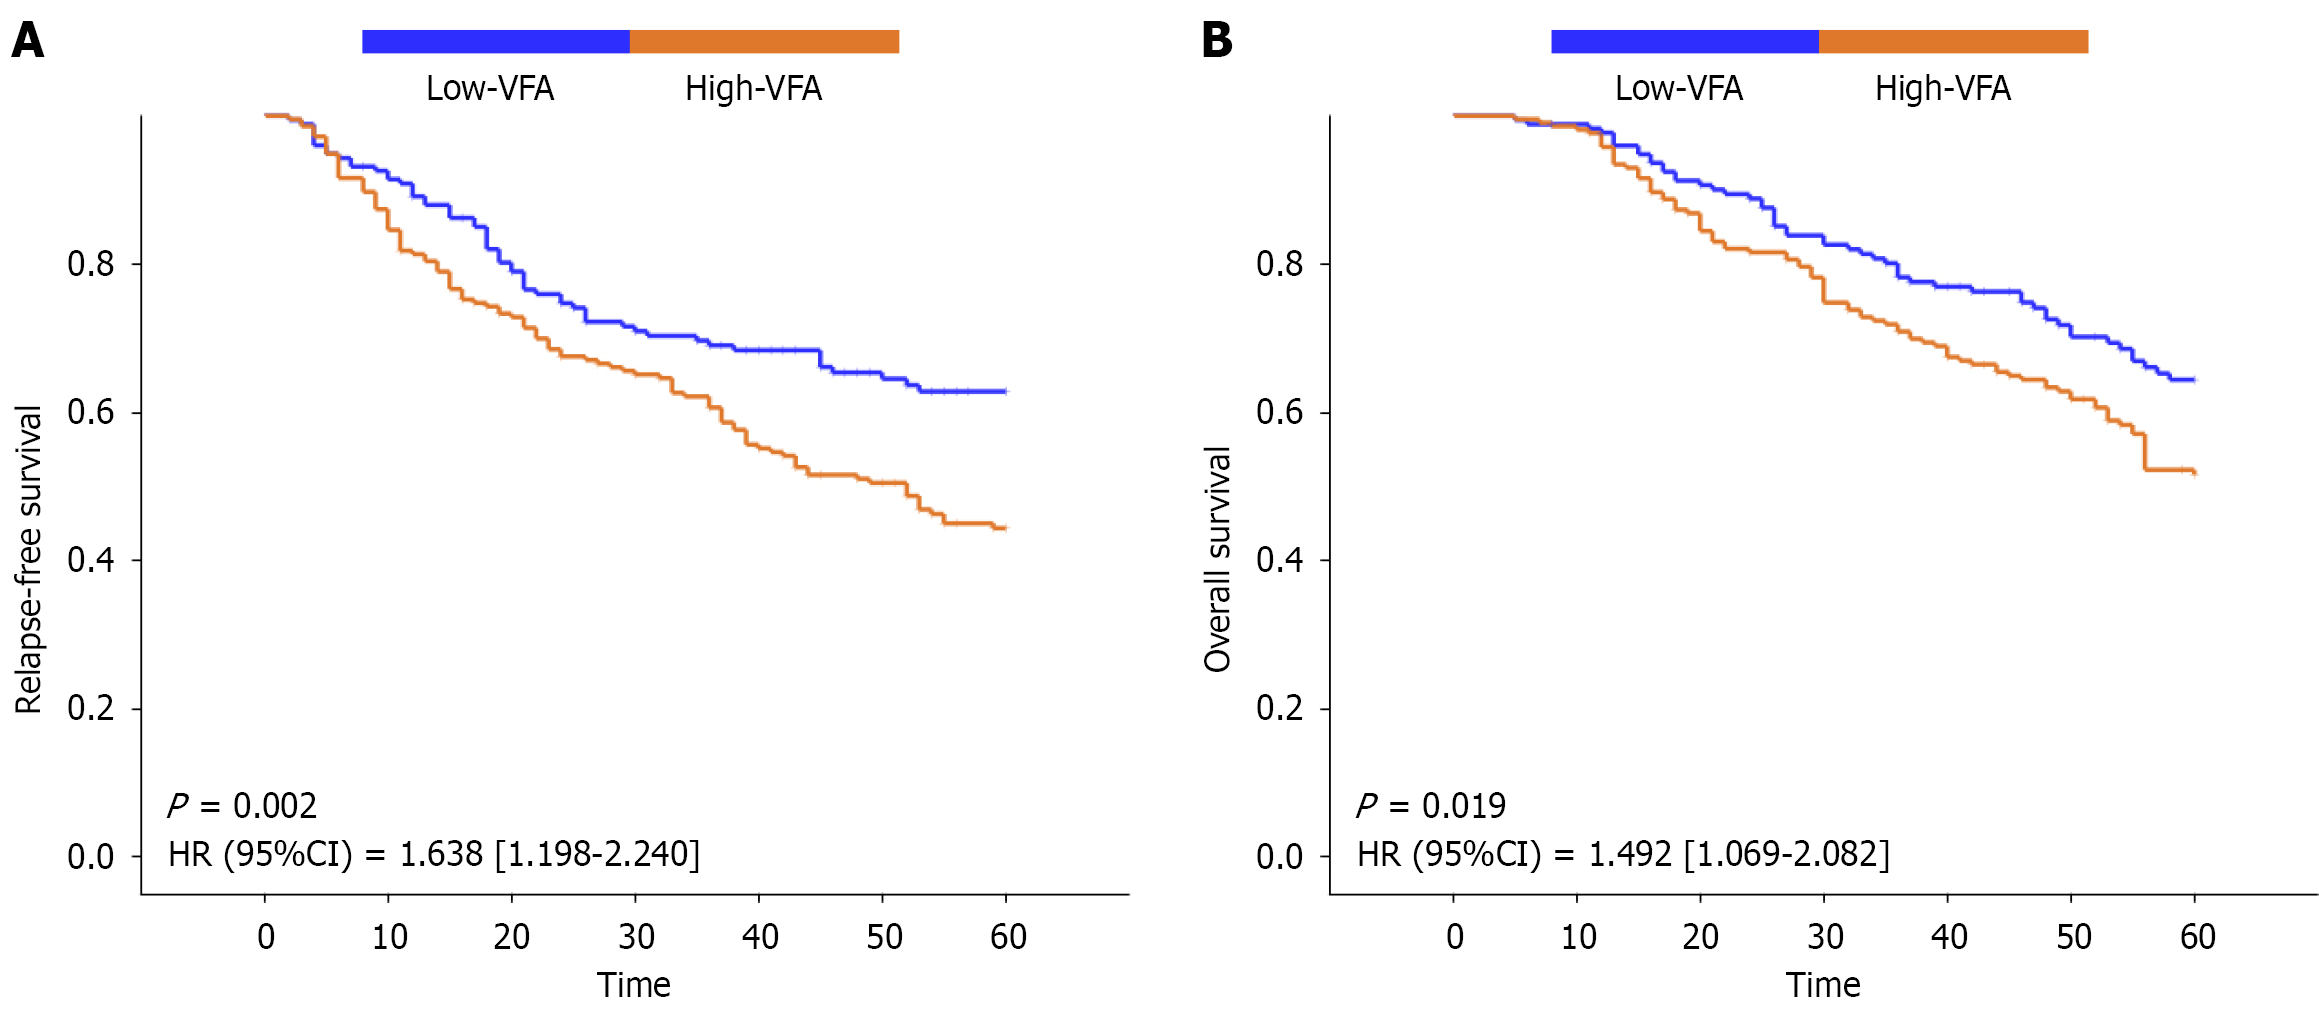
Figure 4 Kaplan-Meier survival curves stratified by visceral fat area.
Log-rank test was used for comparison. A: Relapse-free survival between high-visceral fat area (VFA; ≥ 100 cm2) and low-VFA (< 100 cm2) groups; B: Overall survival between high-VFA and low-VFA groups. VFA: Visceral fat area; CI: Confidence interval.
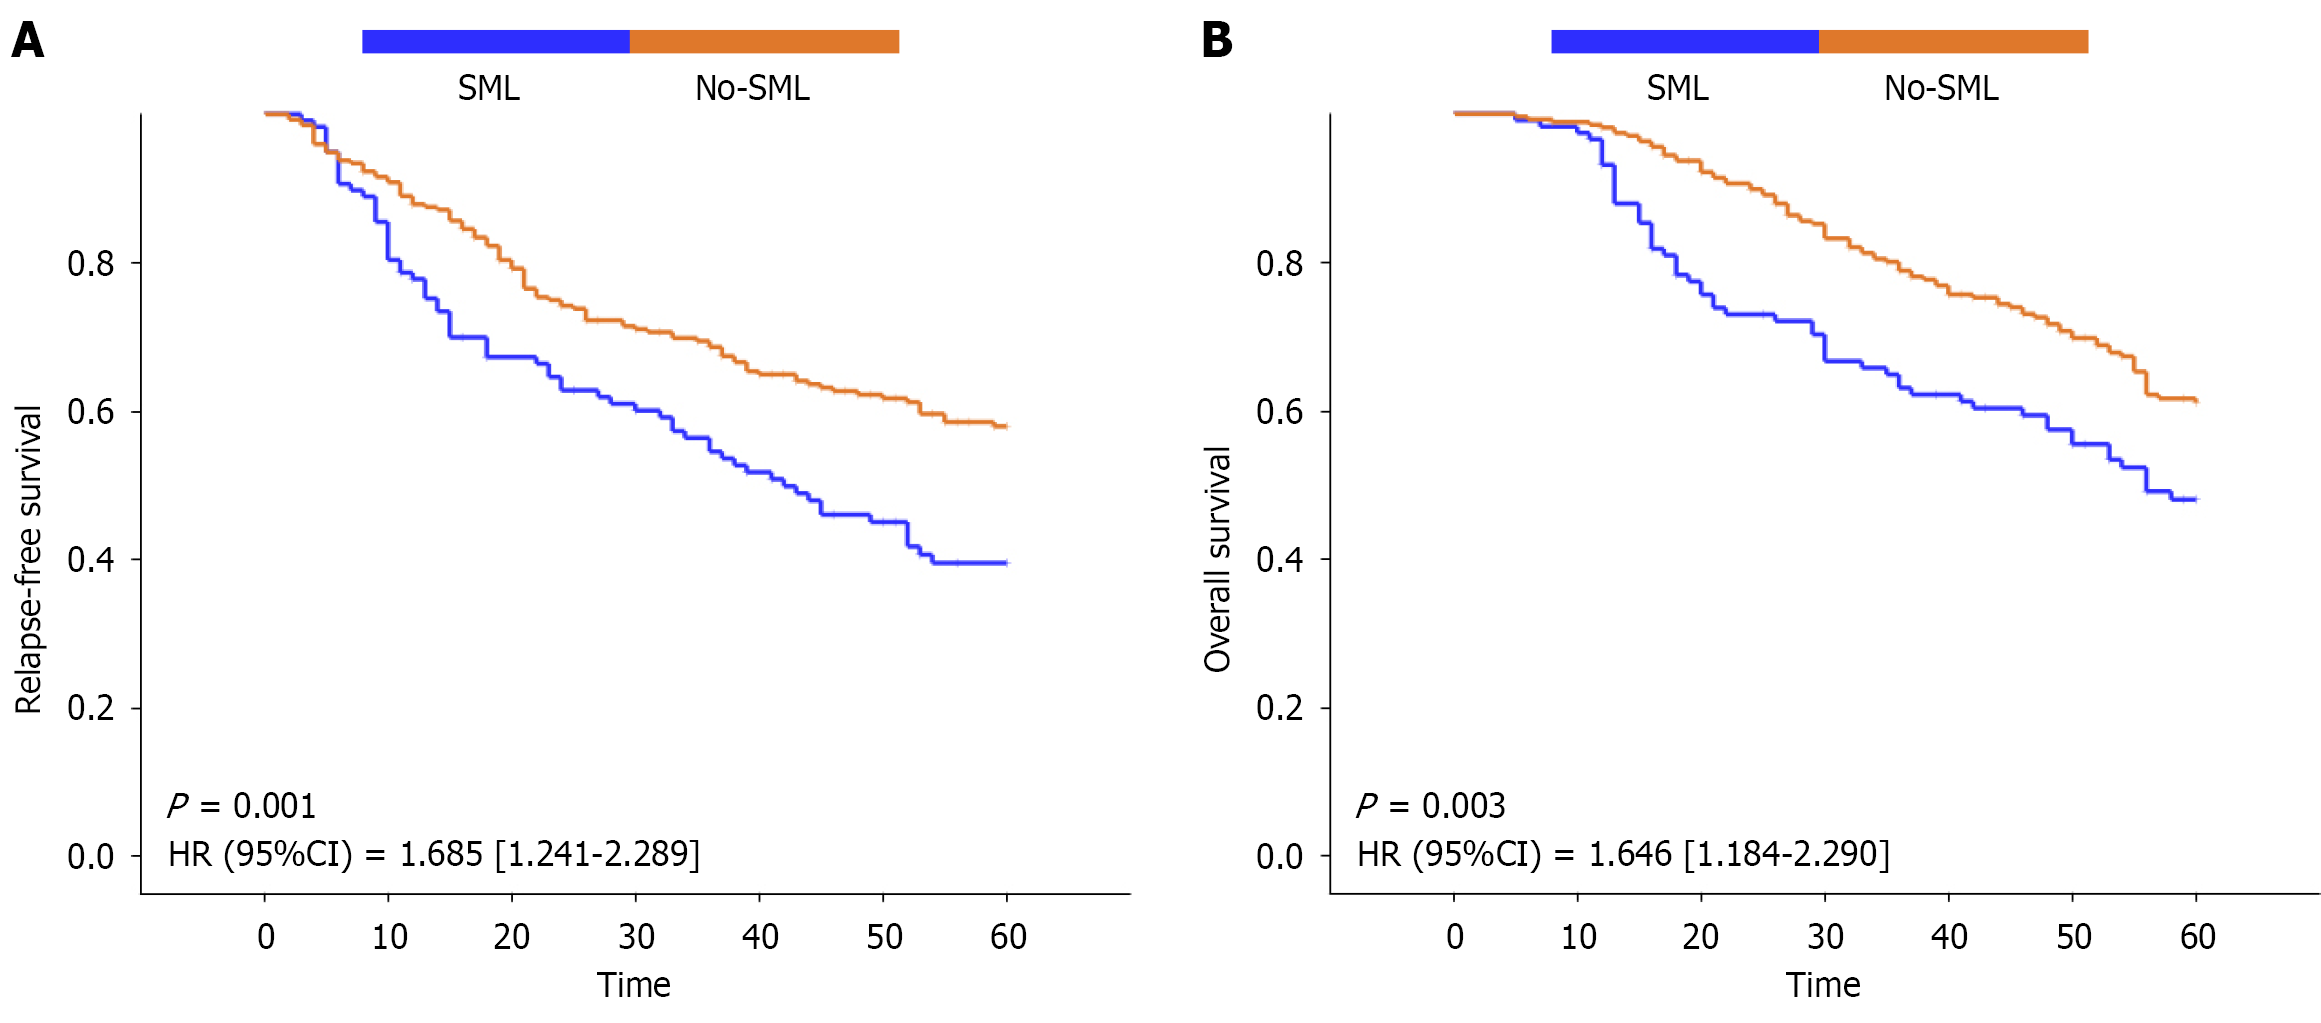
Figure 5 Kaplan-Meier survival curves stratified by the occurrence of postoperative skeletal muscle loss.
Log-rank test was used for comparison. A: Relapse-free survival between skeletal muscle loss (SML; Δ skeletal muscle index ≥ -5%) and non-SML groups; B: Overall survival between SML and non-SML groups. SML: Skeletal muscle loss; CI: Confidence interval.
- Citation: Wang Y, Bu J, Zhan CY, Xu DL, Hu JQ, Zhang MH, Zhu KJ, Qi Y. Visceral obesity exacerbates perioperative muscle loss and impairs survival in colorectal cancer. World J Gastrointest Surg 2026; 18(5): 116822
- URL: https://www.wjgnet.com/1948-9366/full/v18/i5/116822.htm
- DOI: https://dx.doi.org/10.4240/wjgs.v18.i5.116822