
















Copyright: ©Author(s) 2026.
World J Gastrointest Surg. May 27, 2026; 18(5): 115921
Published online May 27, 2026. doi: 10.4240/wjgs.v18.i5.115921
Published online May 27, 2026. doi: 10.4240/wjgs.v18.i5.115921
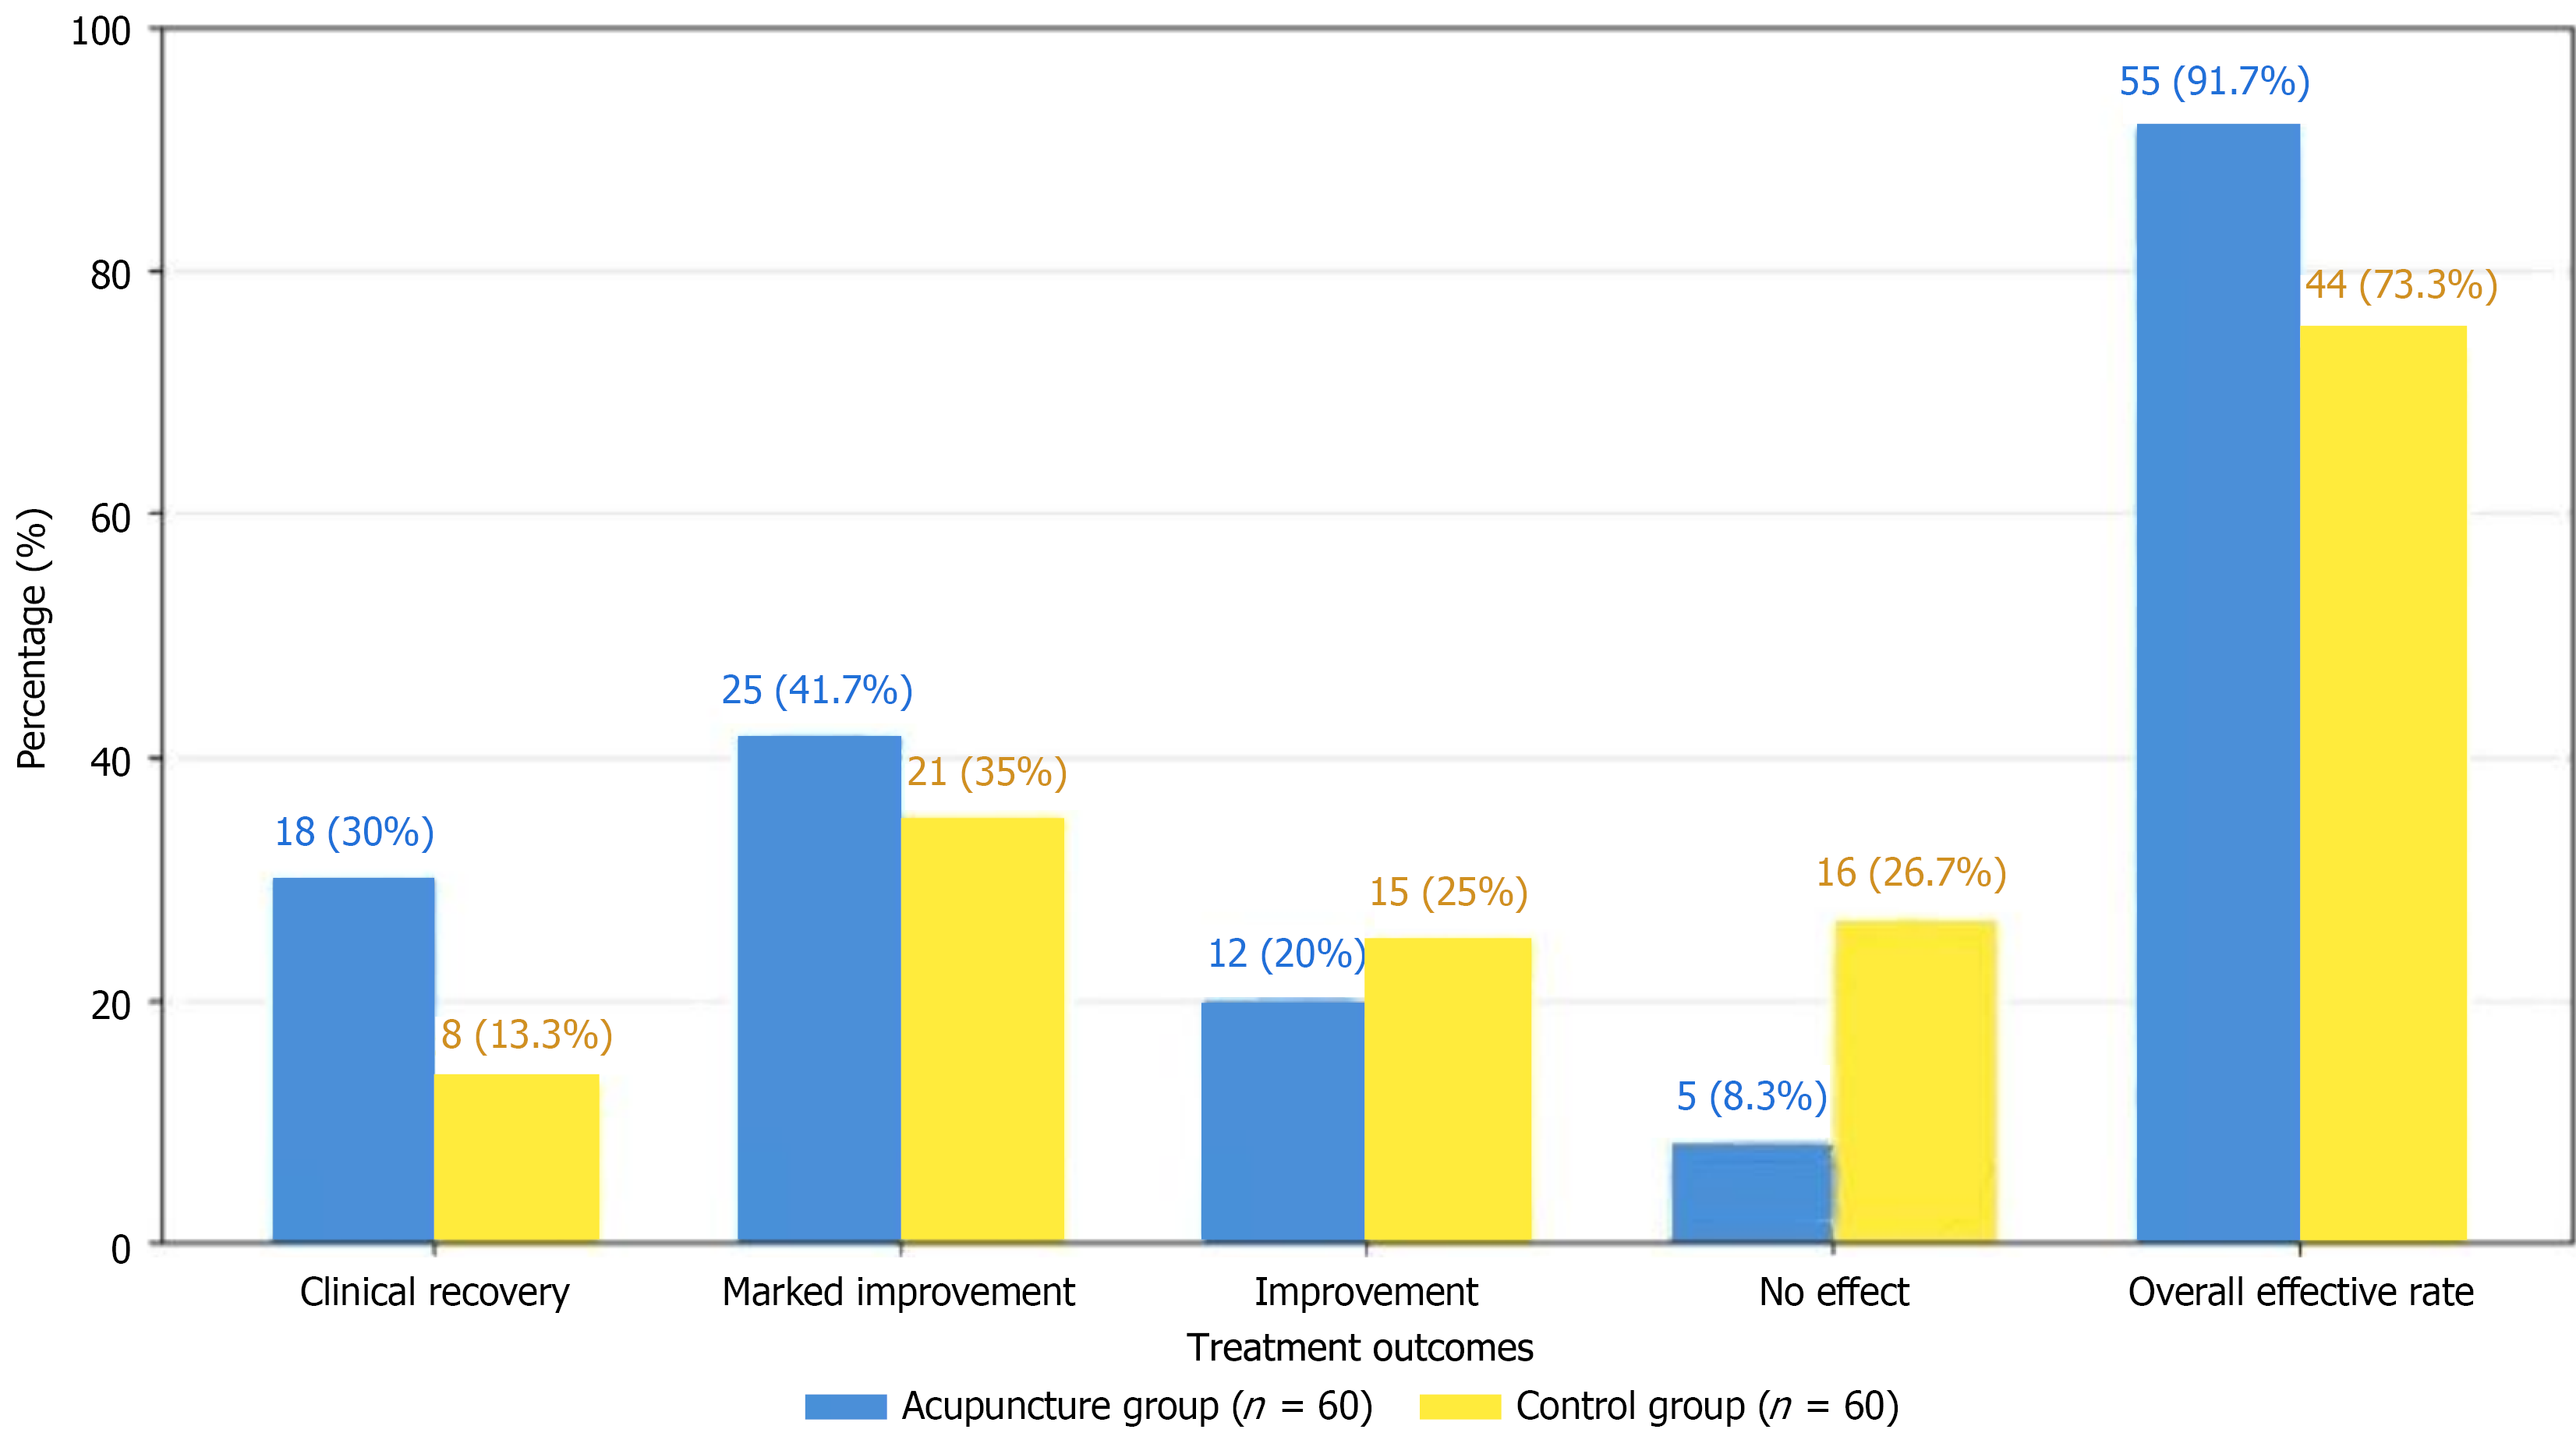
Figure 1 Comparison of clinical efficacy between the two groups.
Blue bars represent the acupuncture group (n = 60) and yellow bars represent the control group (n = 60). The overall effective rate was significantly higher in the acupuncture group (91.7%) compared with the control group (73.3%) (P < 0.01). Overall effective rate = (clinical recovery + marked improvement + improvement)/total cases × 100%.
- Citation: Yan LQ, Li P. Effect of Neiguan and Gongsun acupuncture on gastric electrical rhythm after gastric cancer surgery. World J Gastrointest Surg 2026; 18(5): 115921
- URL: https://www.wjgnet.com/1948-9366/full/v18/i5/115921.htm
- DOI: https://dx.doi.org/10.4240/wjgs.v18.i5.115921