
















Copyright: ©Author(s) 2026.
World J Gastrointest Surg. May 27, 2026; 18(5): 115903
Published online May 27, 2026. doi: 10.4240/wjgs.v18.i5.115903
Published online May 27, 2026. doi: 10.4240/wjgs.v18.i5.115903
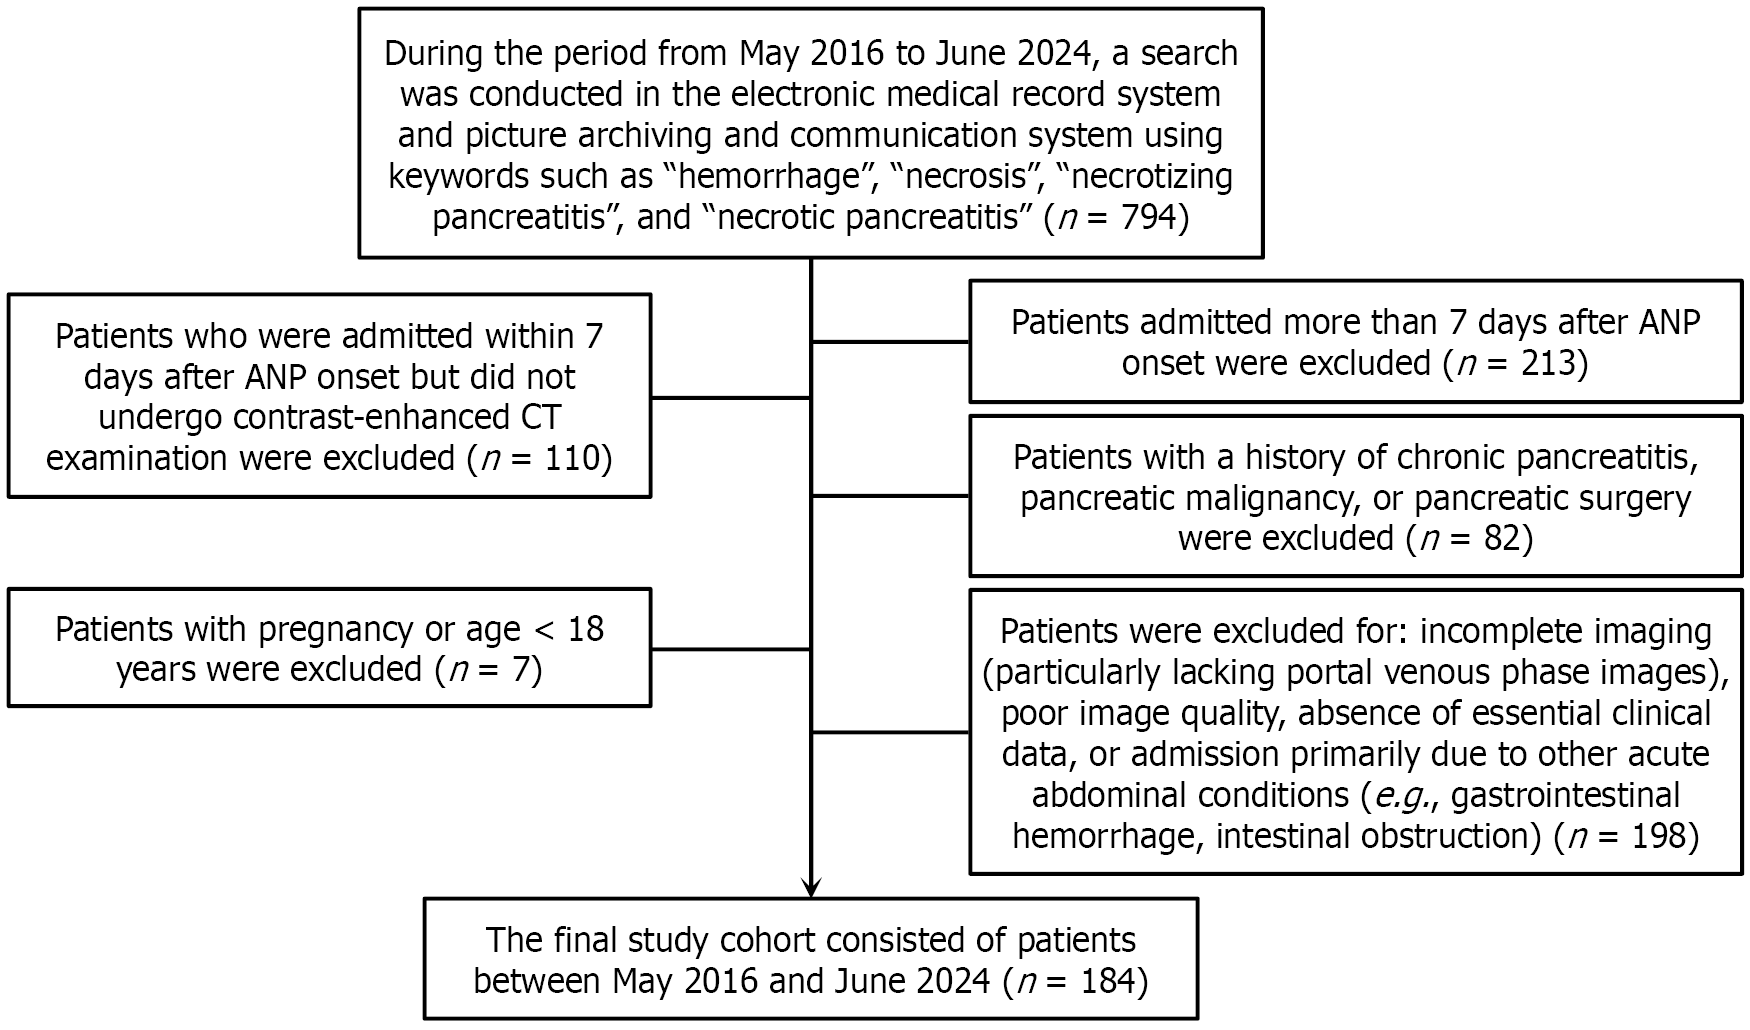
Figure 1 Patient selection flowchart.
ANP: Acute necrotizing pancreatitis; CT: Computed tomography.
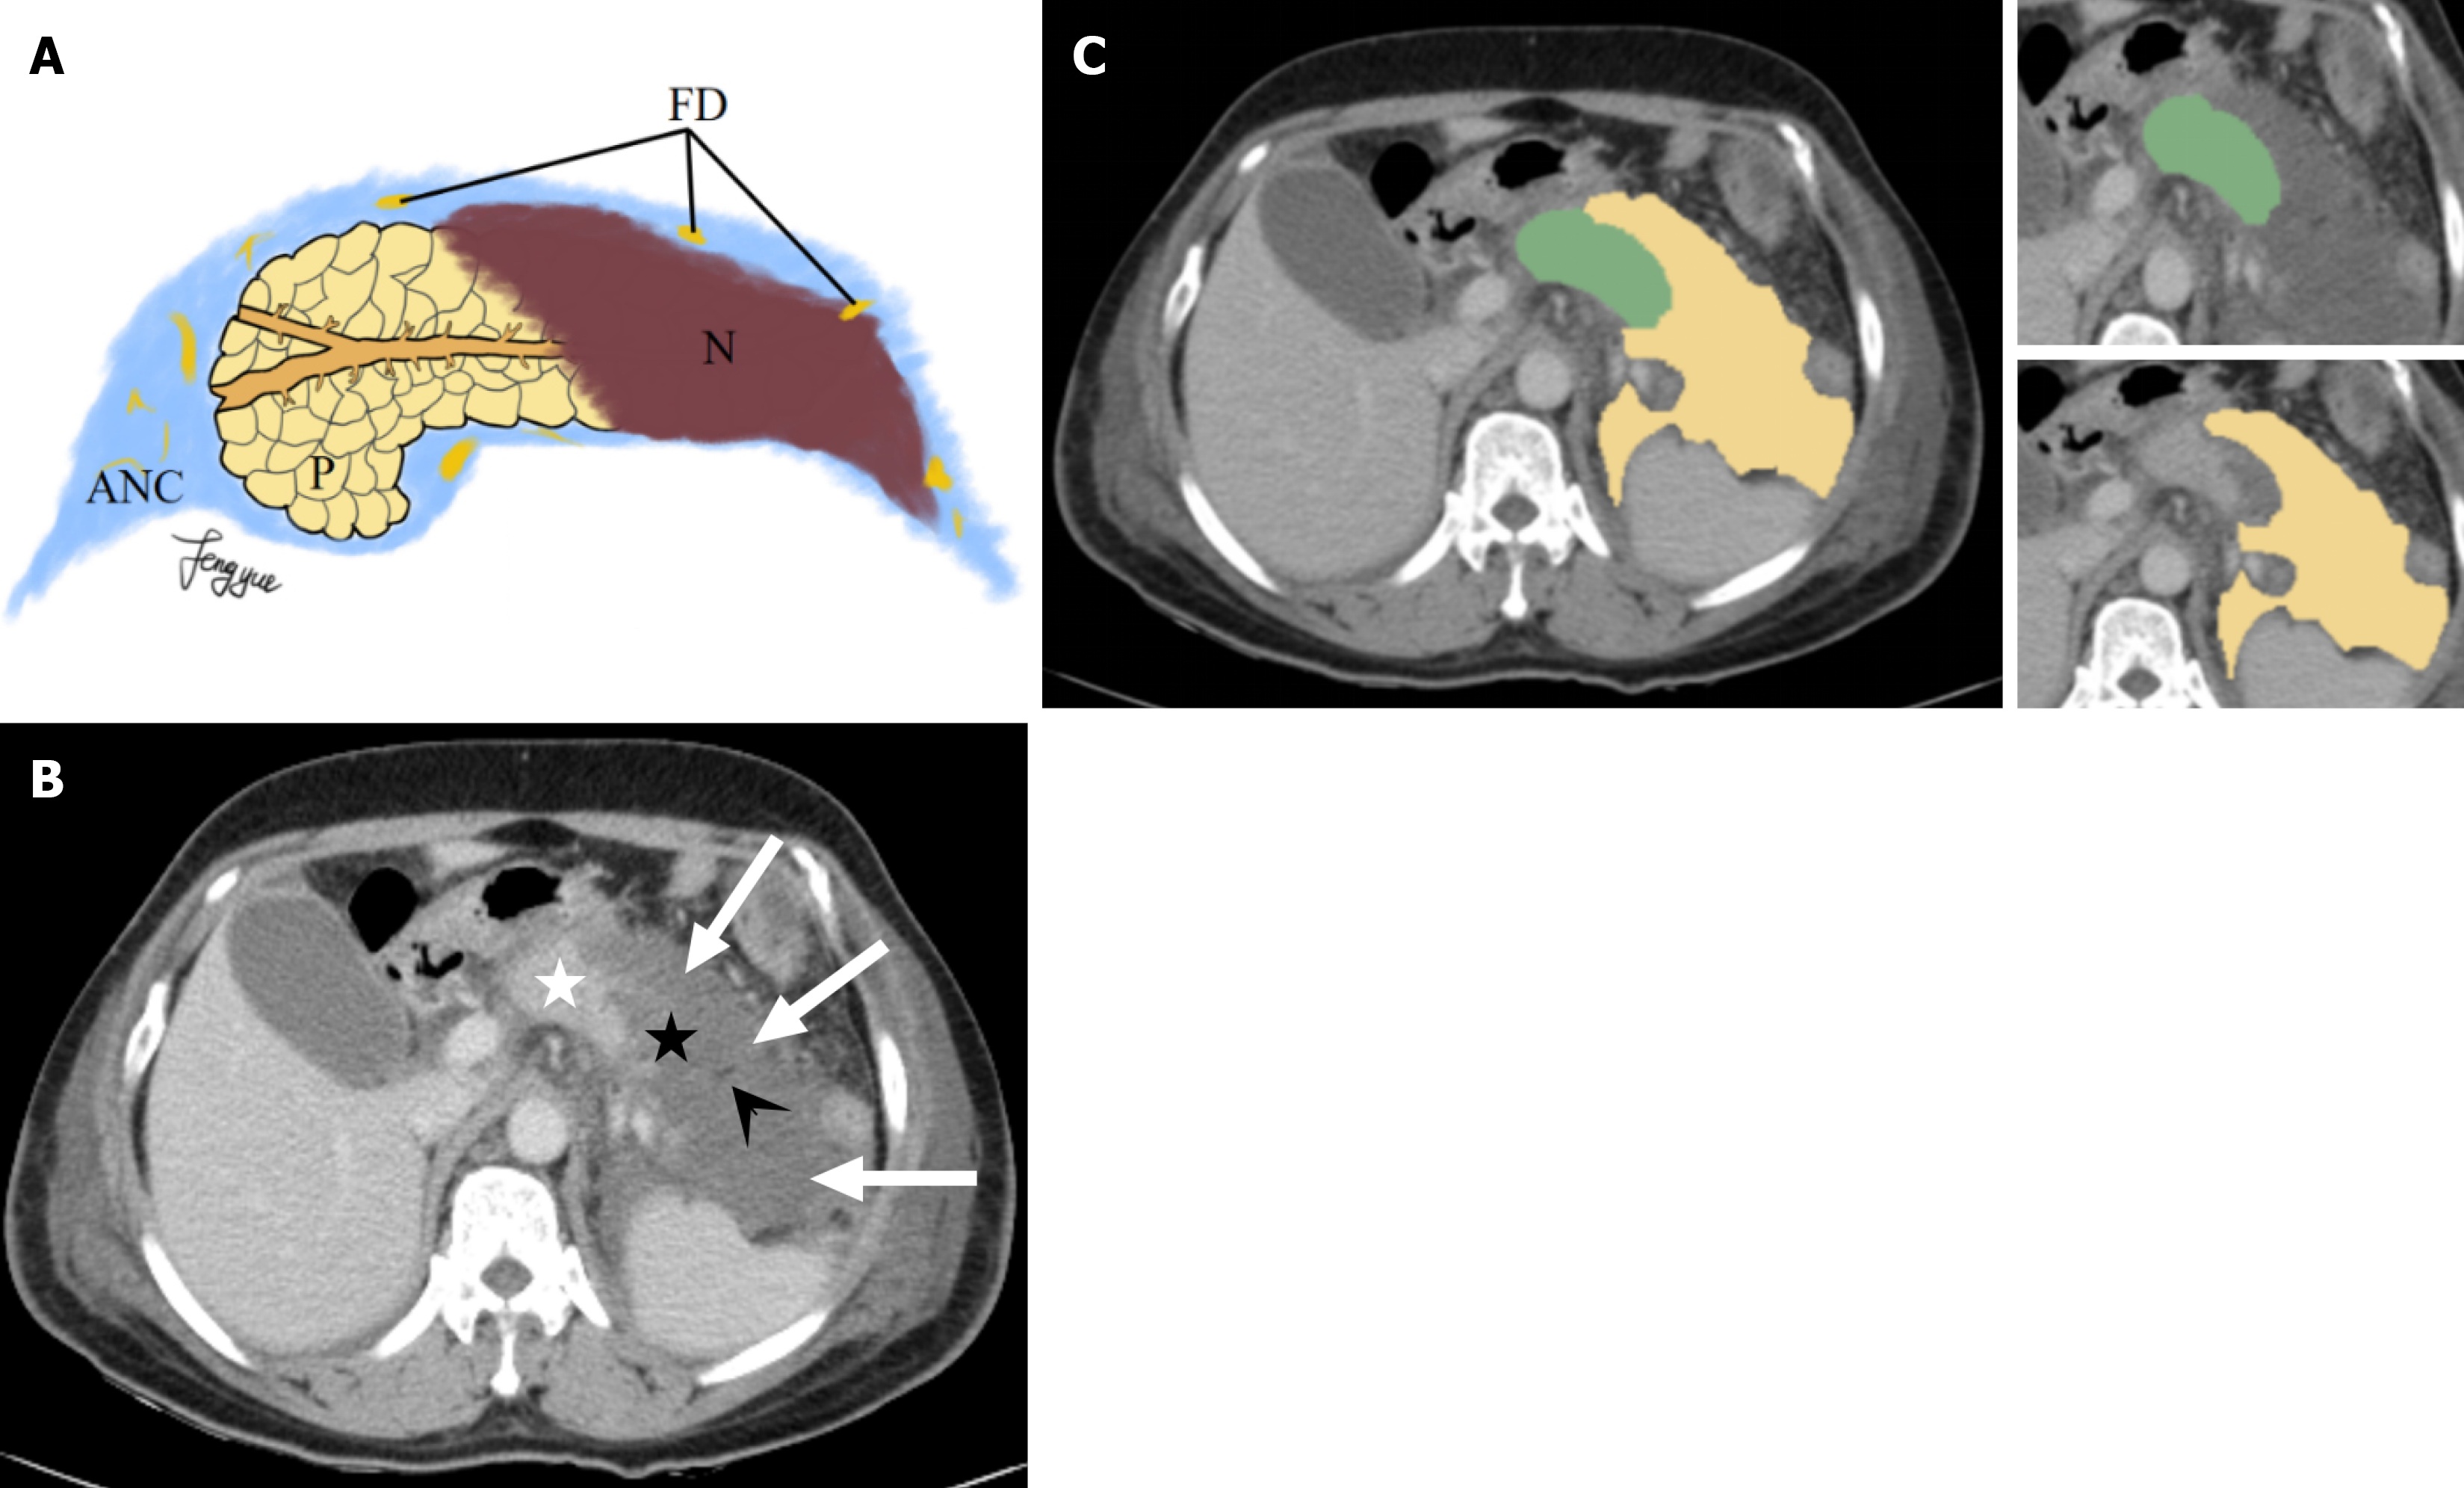
Figure 2 Mixed pancreatic necrosis.
A: Schematic of mixed pancreatic necrosis: Necrotic foci in the pancreatic body and tail with peripancreatic fatty debris; B: Portal venous contrast-enhanced computed tomography in a 55-year-old female with mixed necrosis shows parenchymal necrosis (black star), peripancreatic necrotic collections (white arrows) containing fatty debris (black arrowhead), and residual normal pancreas (white star); C: Corresponding regions of interests: Green area manually delineates the entire pancreatic parenchyma (necrotic tissue included; ducts and vessels excluded); yellow area represents peripancreatic necrotic collections at the same anatomical levels as the pancreas. P: Pancreas; N: Necrotic foci; FD: Fatty debris; ANC: Acute necrotizing collection.
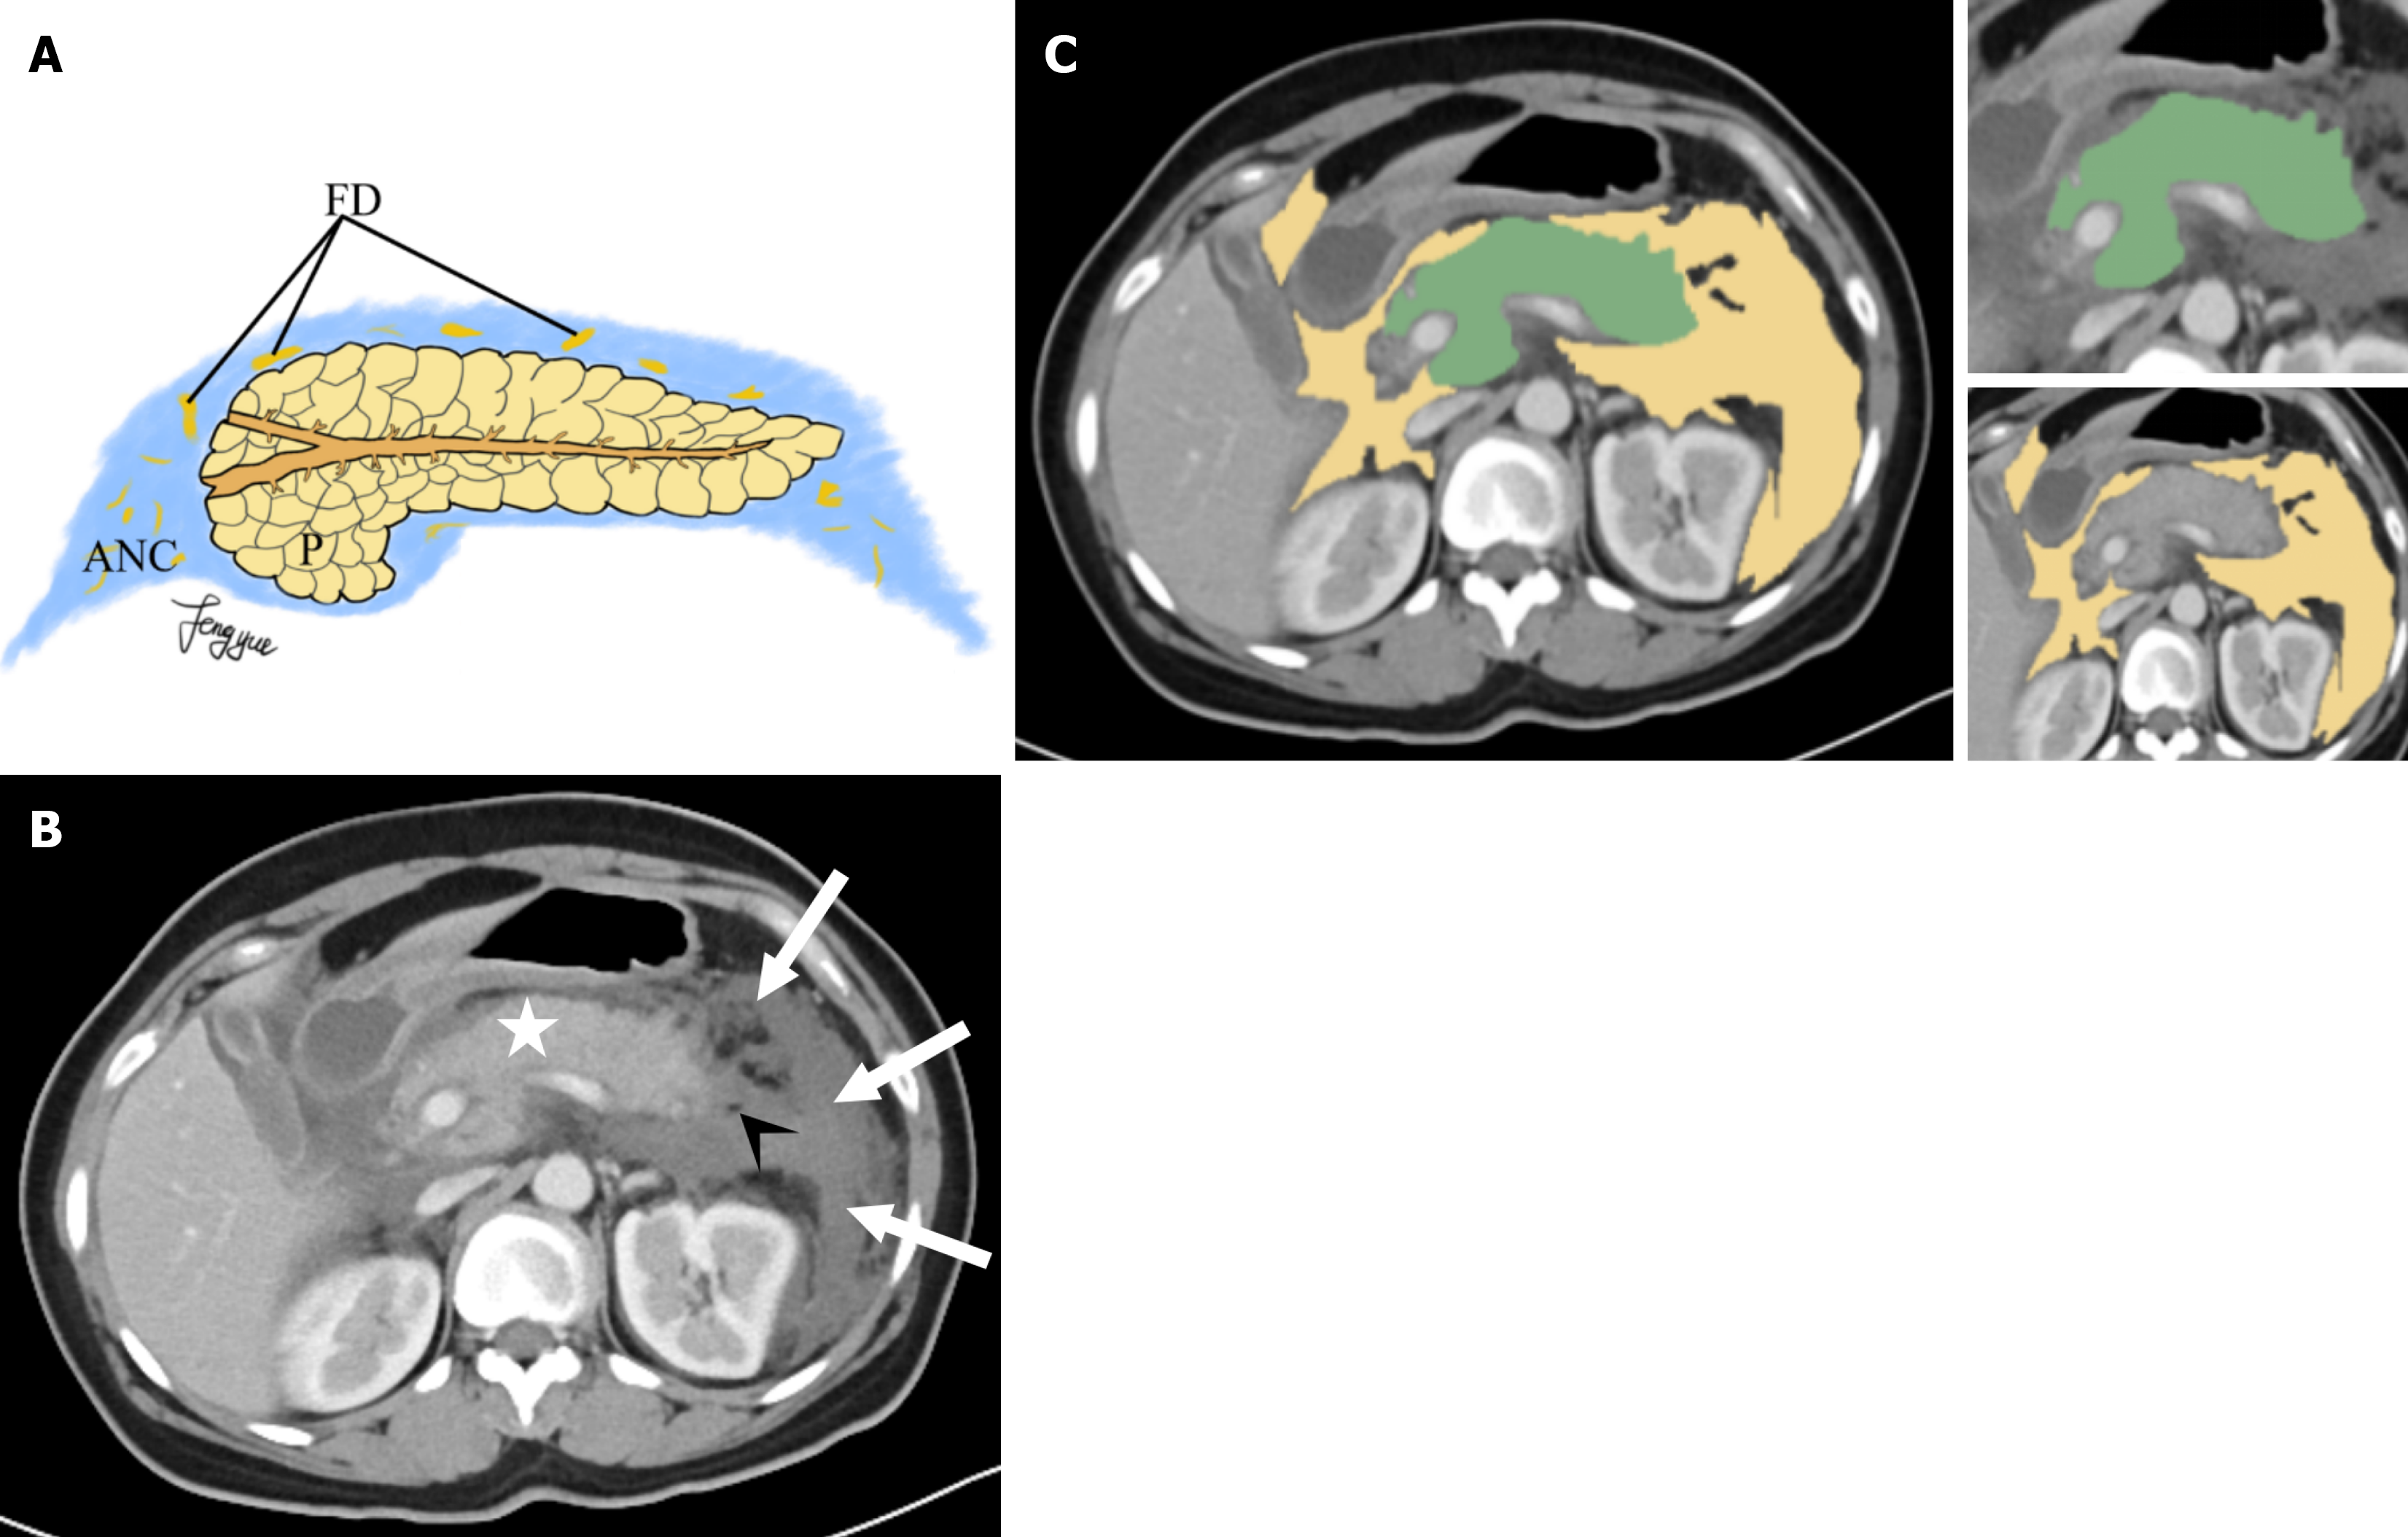
Figure 3 Peripancreatic necrosis only.
A: Schematic of peripancreatic necrosis only: Fatty debris in peripancreatic adipose tissue without necrosis of the pancreatic parenchyma; B: Portal venous phase contrast-enhanced computed tomography in a 43-year-old male with peripancreatic necrosis only reveals peripancreatic necrotic collections (white arrows) containing scattered fatty debris (black arrowheads). Normal pancreatic parenchyma is indicated by a white star; C: Corresponding manually delineated regions of interest: Pancreatic parenchyma (green) and peripancreatic necrotic collections (yellow). P: Pancreas; FD: Fatty debris; ANC: Acute necrotizing collection.
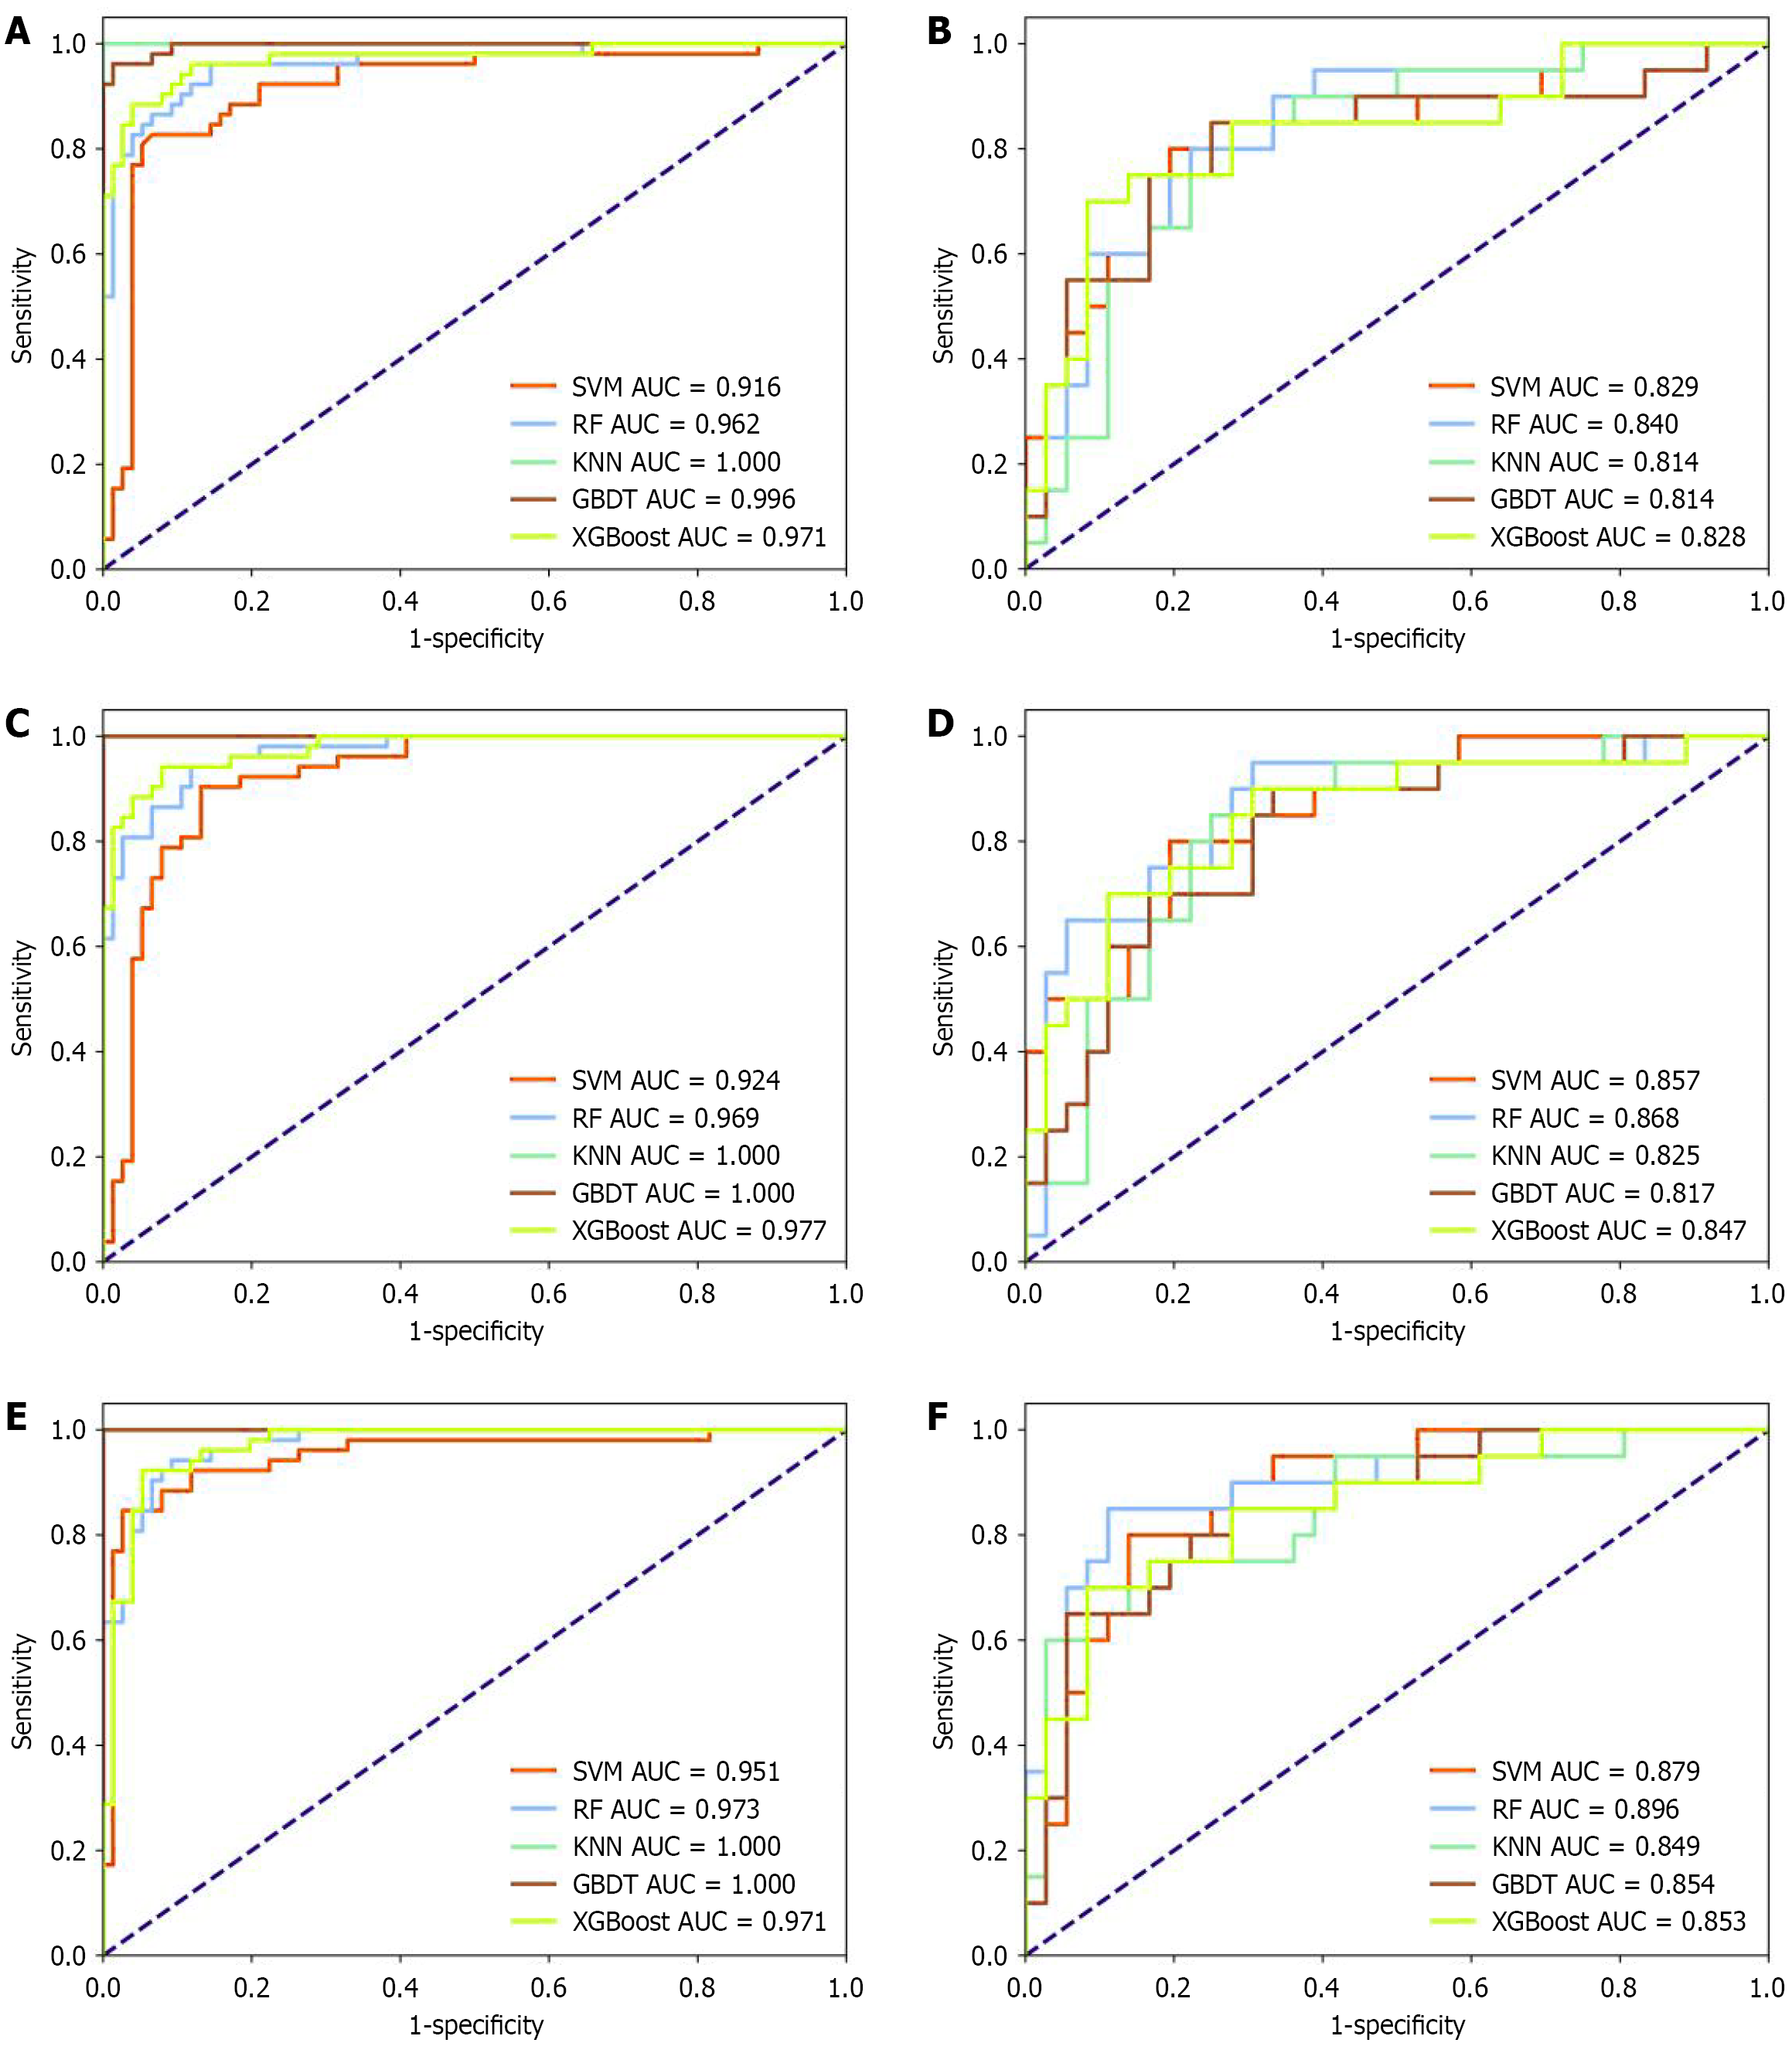
Figure 4 Receiver operating characteristic curves of radiomics-based discrimination models developed using five machine learning algorithms (support vector machine, random forest, k-nearest neighbor, gradient boosting decision tree, and extreme gradient boosting).
A: Pancreatic parenchyma in the training cohort; B: Pancreatic parenchyma in the test cohort; C: Peripancreatic necrotic collections in the training cohort; D: Peripancreatic necrotic collections in the test cohort; E: Combined pancreatic parenchyma with peripancreatic necrotic collections in the training cohort; F: Combined pancreatic parenchyma with peripancreatic necrotic collections in the test cohort. SVM: Support vector machine; AUC: Area under the curve; RF: Random forest; KNN: k-nearest neighbor; GBDT: Gradient boosting decision tree; XGBoost: Extreme gradient boosting.
- Citation: Feng Y, Hu XH, Xiao B. Machine learning and radiomics for differentiating severe from moderately severe acute necrotizing pancreatitis on contrast-enhanced computed tomography. World J Gastrointest Surg 2026; 18(5): 115903
- URL: https://www.wjgnet.com/1948-9366/full/v18/i5/115903.htm
- DOI: https://dx.doi.org/10.4240/wjgs.v18.i5.115903