
















Copyright: ©Author(s) 2026.
World J Gastrointest Surg. Oct 27, 2026; 18(10): 123122
Published online Oct 27, 2026. doi: 10.4240/wjgs.123122
Published online Oct 27, 2026. doi: 10.4240/wjgs.123122
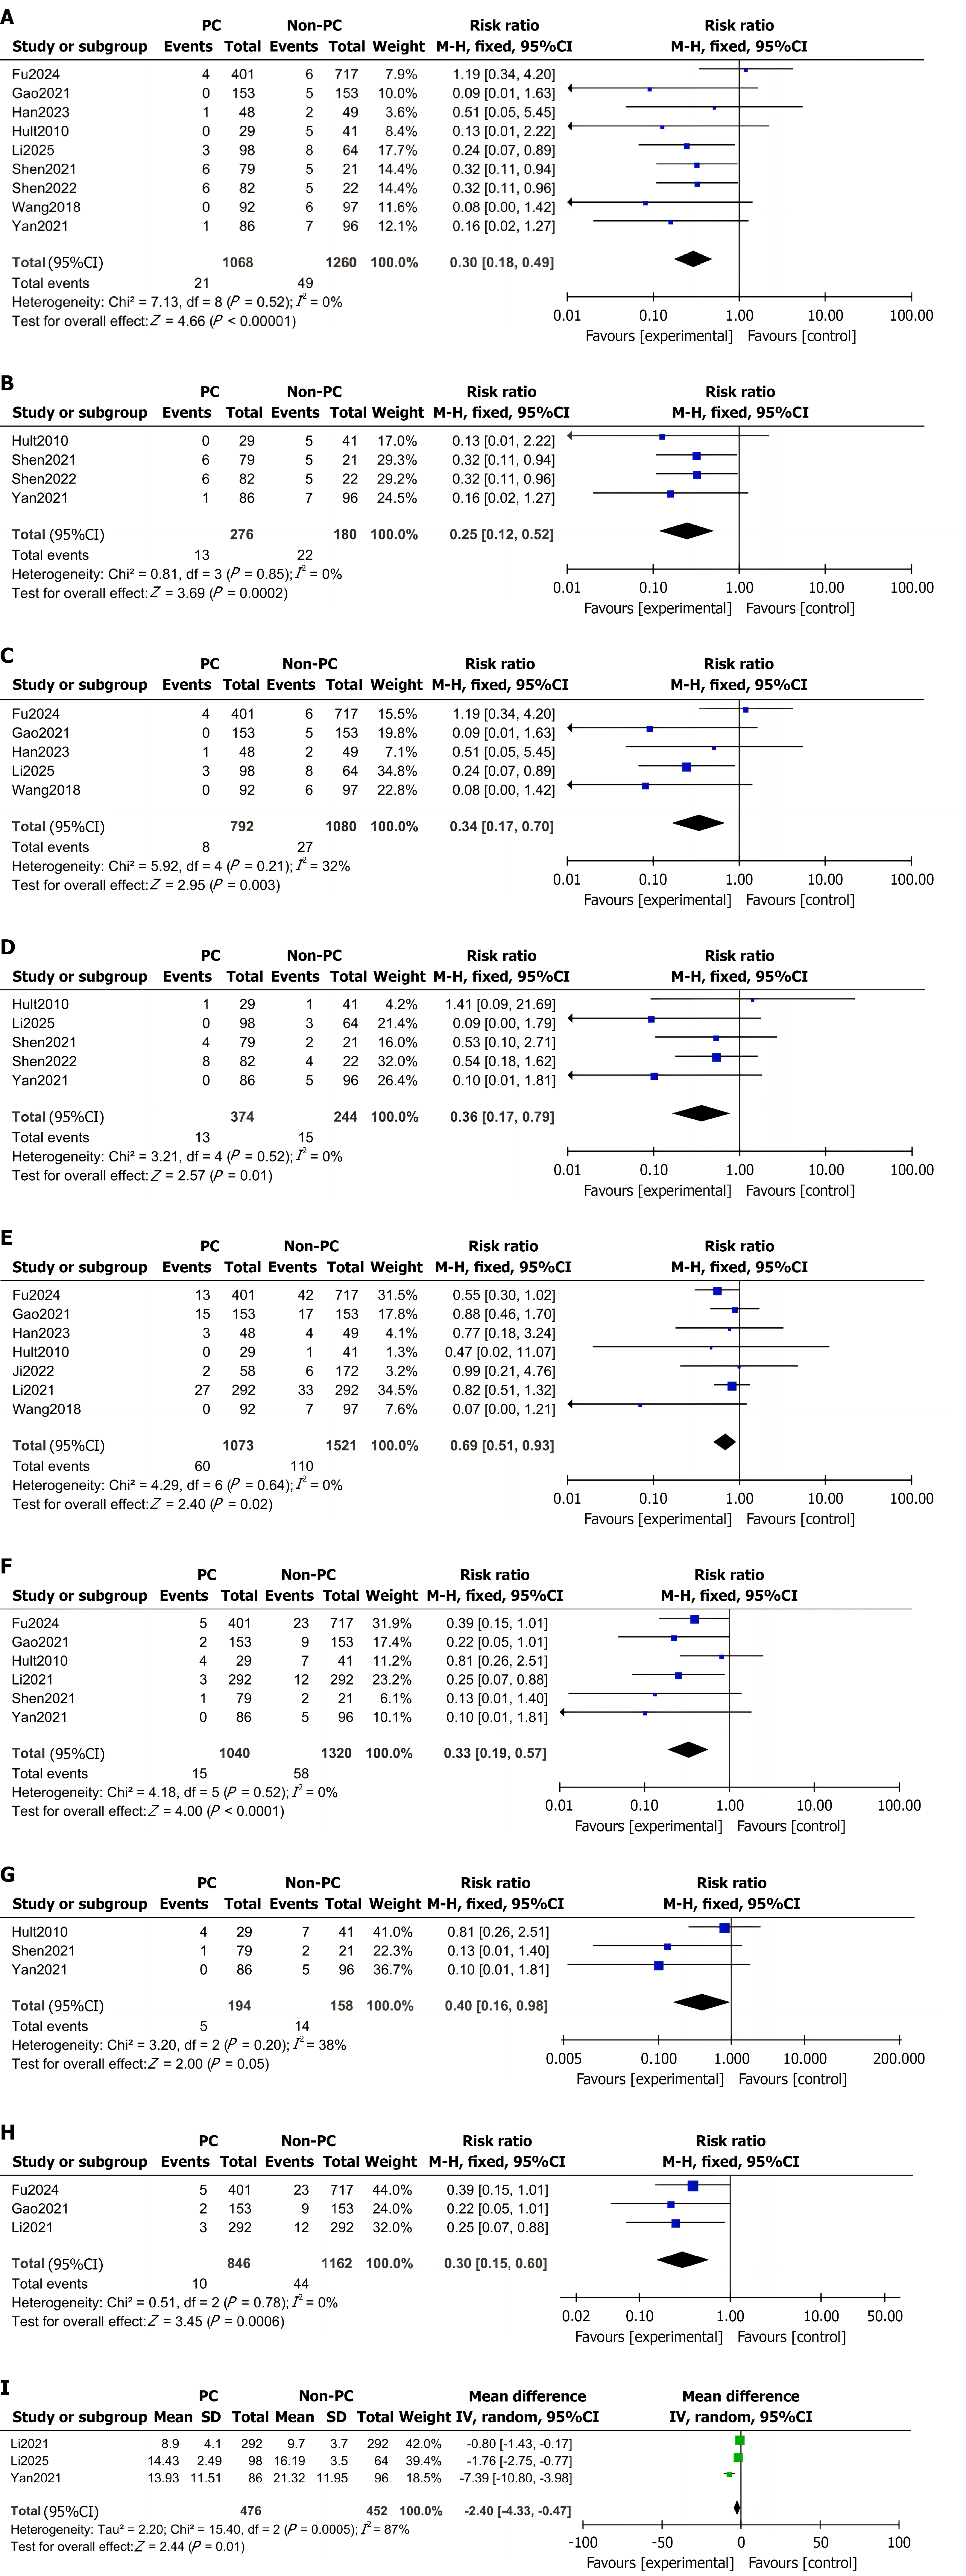
Figure 2 Forest plot.
A: Comparing the risk of postoperative intestinal obstruction between the reconstruction and control groups. The pooled association was relative risk (RR) = 0.30 (95%CI: 0.18-0.49, Peffect < 0.001), with I2 = 0% and Pheterogeneity = 0.52. A fixed-effect model was used; B: Comparing the risk of postoperative intestinal obstruction following laparoscopic abdominoperineal resection (LAPR) between the reconstruction and control groups. For LAPR/extralevator abdominoperineal excision (ELAPE), the pooled association was RR = 0.25 (95%CI: 0.12-0.52; Peffect < 0.001), with I2 = 0% and Pheterogeneity = 0.85; a fixed-effect model was used; C: Comparing the risk of postoperative intestinal obstruction following laparoscopic anterior rectal resection (LAR) between the reconstruction and control groups. For LAR, the pooled association was RR = 0.34 (95%CI: 0.17-0.70; Peffect = 0.003) with I2 = 32% and Pheterogeneity = 0.21; a fixed-effect model was used; D: Comparing the risk of postoperative internal hernia between the reconstruction and control groups. The pooled association was RR = 0.36 (95%CI: 0.17-0.79; Peffect = 0.010), with I2 = 0% and Pheterogeneity = 0.52; a fixed-effect model was used; E: Comparing the risk of postoperative anastomotic leak between the reconstruction and control groups. The pooled association was RR = 0.69 (95%CI: 0.51-0.93; Peffect = 0.020), with I2 = 5% and Pheterogeneity = 0.64; a fixed-effect model was used; F: Comparing the risk of postoperative unplanned reoperations between the reconstruction and control groups. The pooled association was RR = 0.33 (95%CI: 0.19-0.57; Peffect < 0.001), with I2 = 0% and Pheterogeneity = 0.52; a fixed-effect model was used; G: Comparing the risk of unplanned reoperations following LAPR between the reconstruction and control groups. For LAPR/ELAPE, the pooled association was RR = 0.40 (95%CI: 0.16-0.98; Peffect = 0.046), with I2 = 38% and Pheterogeneity = 0.20; a fixed-effect model was used; H: Comparing the risk of unplanned reoperations following LAR between the reconstruction and control groups. For LAR, the pooled association was RR = 0.30 (95%CI: 0.15-0.60; Peffect < 0.001), with I2 = 0% and Pheterogeneity = 0.78; a fixed-effect model was used; I: Comparing postoperative length of hospital stay between the reconstruction and control groups. The random-effects estimate was MD = -2.40 days (95%CI: -4.33 to -0.47; Peffect = 0.015), with I2 = 87% and Pheterogeneity < 0.001. The results were unstable in leave-one-out sensitivity analyses. PC: Pelvic floor peritoneal reconstruction.
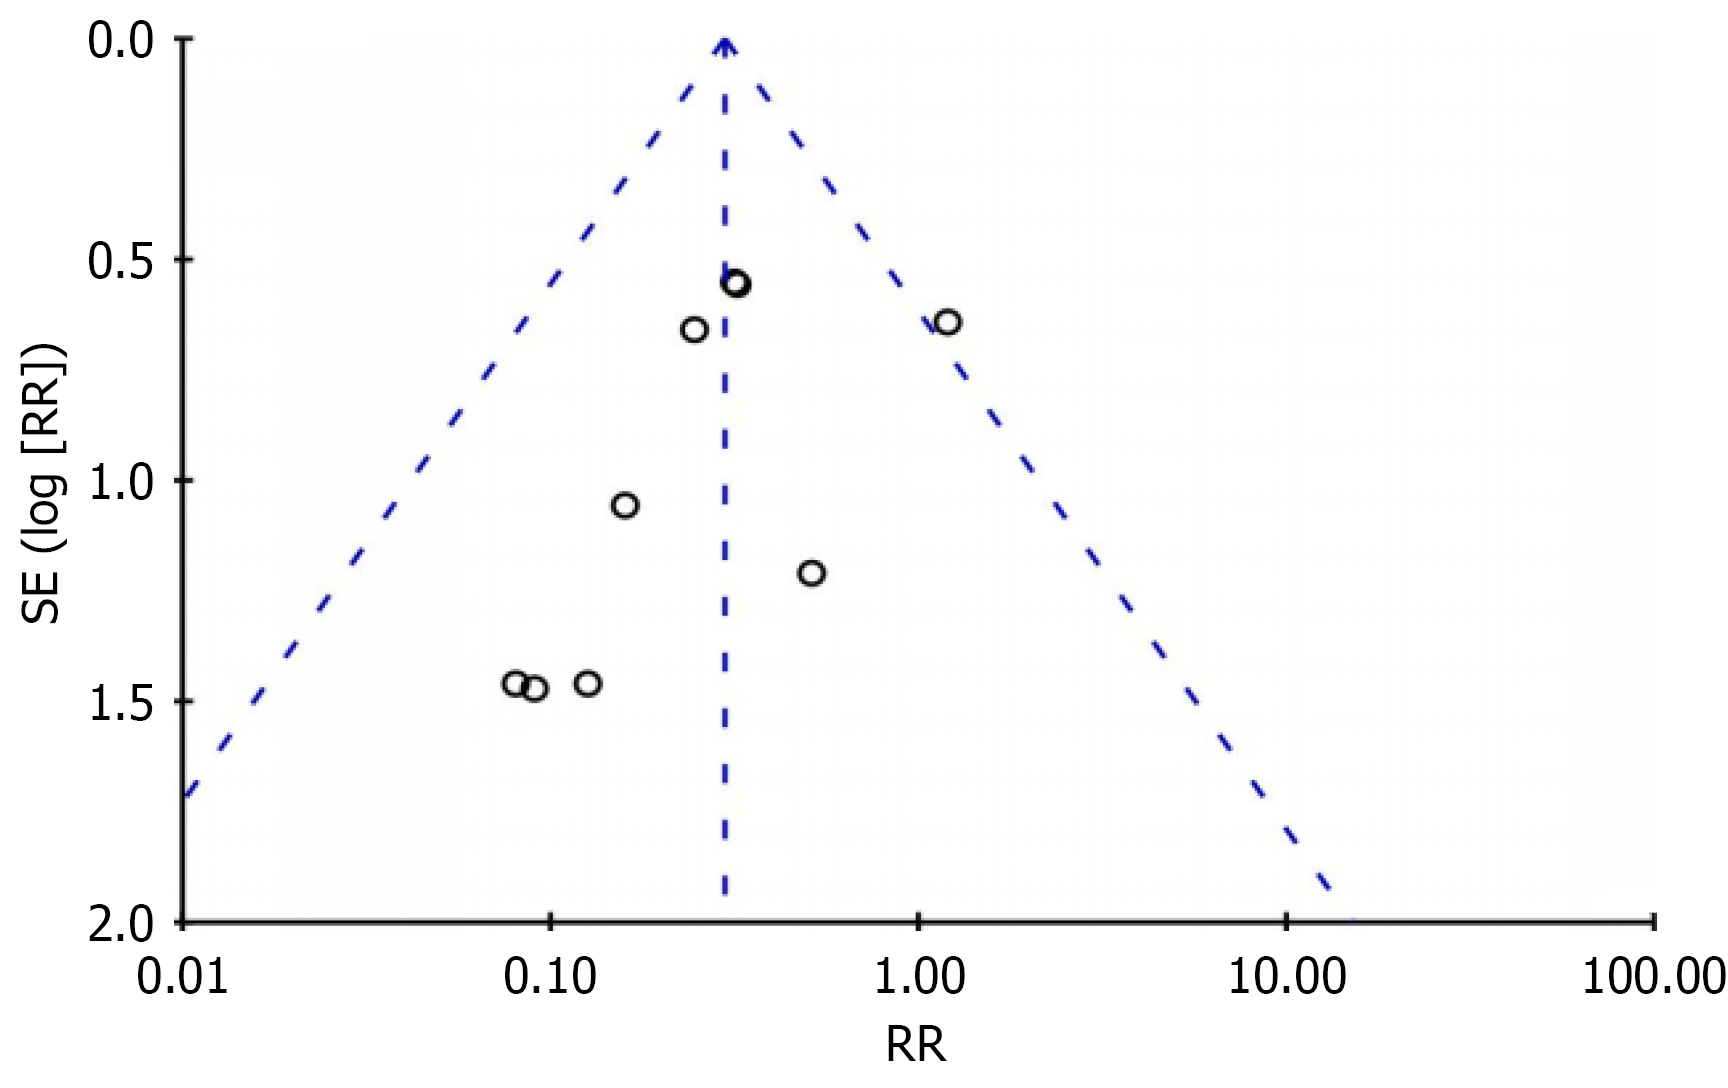
Figure 3 Funnel plot of the risk of intestinal obstruction.
Visual inspection did not show marked asymmetry. However, with only nine studies, the funnel plot had limited power, and publication bias could not be excluded. RR: Relative risk.
- Citation: Zhang X, Chen XR, Zhu YJ. Efficacy of pelvic floor peritoneal reconstruction after laparoscopic resection of middle and low rectal cancer: A meta-analysis. World J Gastrointest Surg 2026; 18(10): 123122
- URL: https://www.wjgnet.com/1948-9366/full/v18/i10/123122.htm
- DOI: https://dx.doi.org/10.4240/wjgs.123122