
















Copyright: ©Author(s) 2026.
World J Gastrointest Surg. Oct 27, 2026; 18(10): 122889
Published online Oct 27, 2026. doi: 10.4240/wjgs.122889
Published online Oct 27, 2026. doi: 10.4240/wjgs.122889
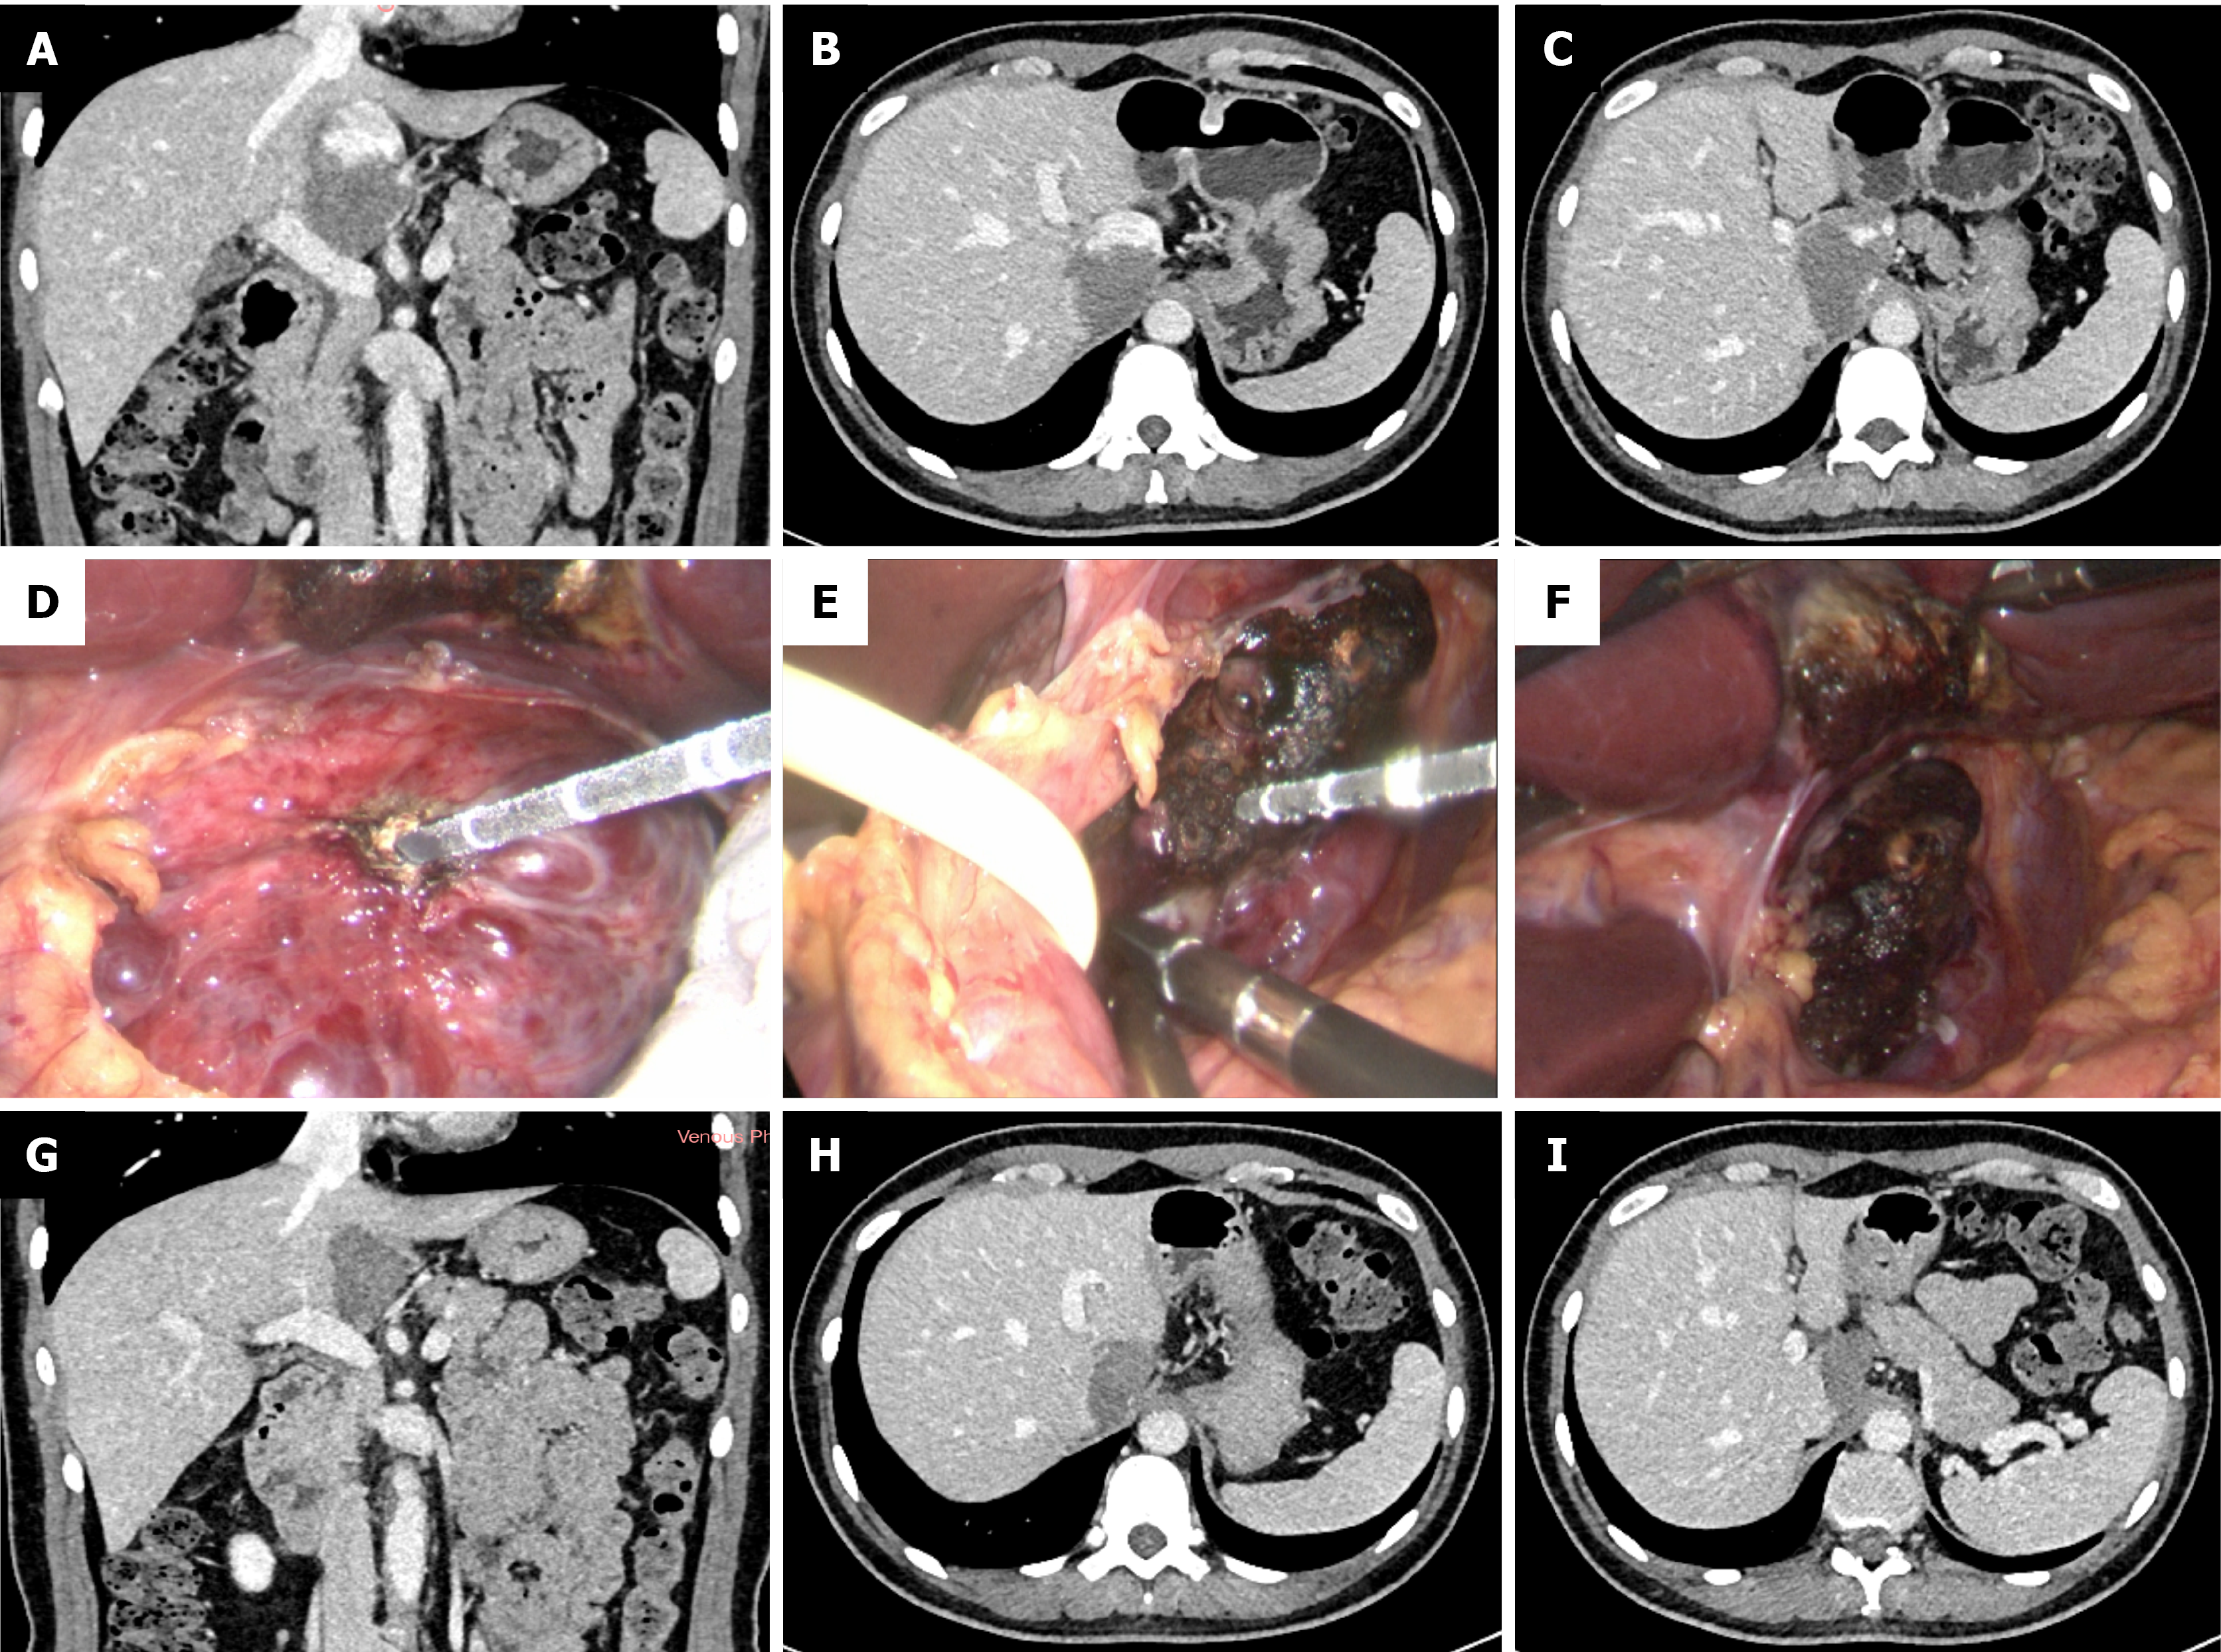
Figure 1 Microwave ablation of a 6.
4 cm hepatic Spiegel lobe hemangioma. A-C: Preoperative computed tomography (CT) scan demonstrated a 6.4 cm hepatic caudate lobe hemangioma (Spiegel lobe); D-F: Expose the hepatic hemangioma and perform microwave ablation; G-I: Follow-up abdominal contrast-enhanced CT at 3 months postoperatively.
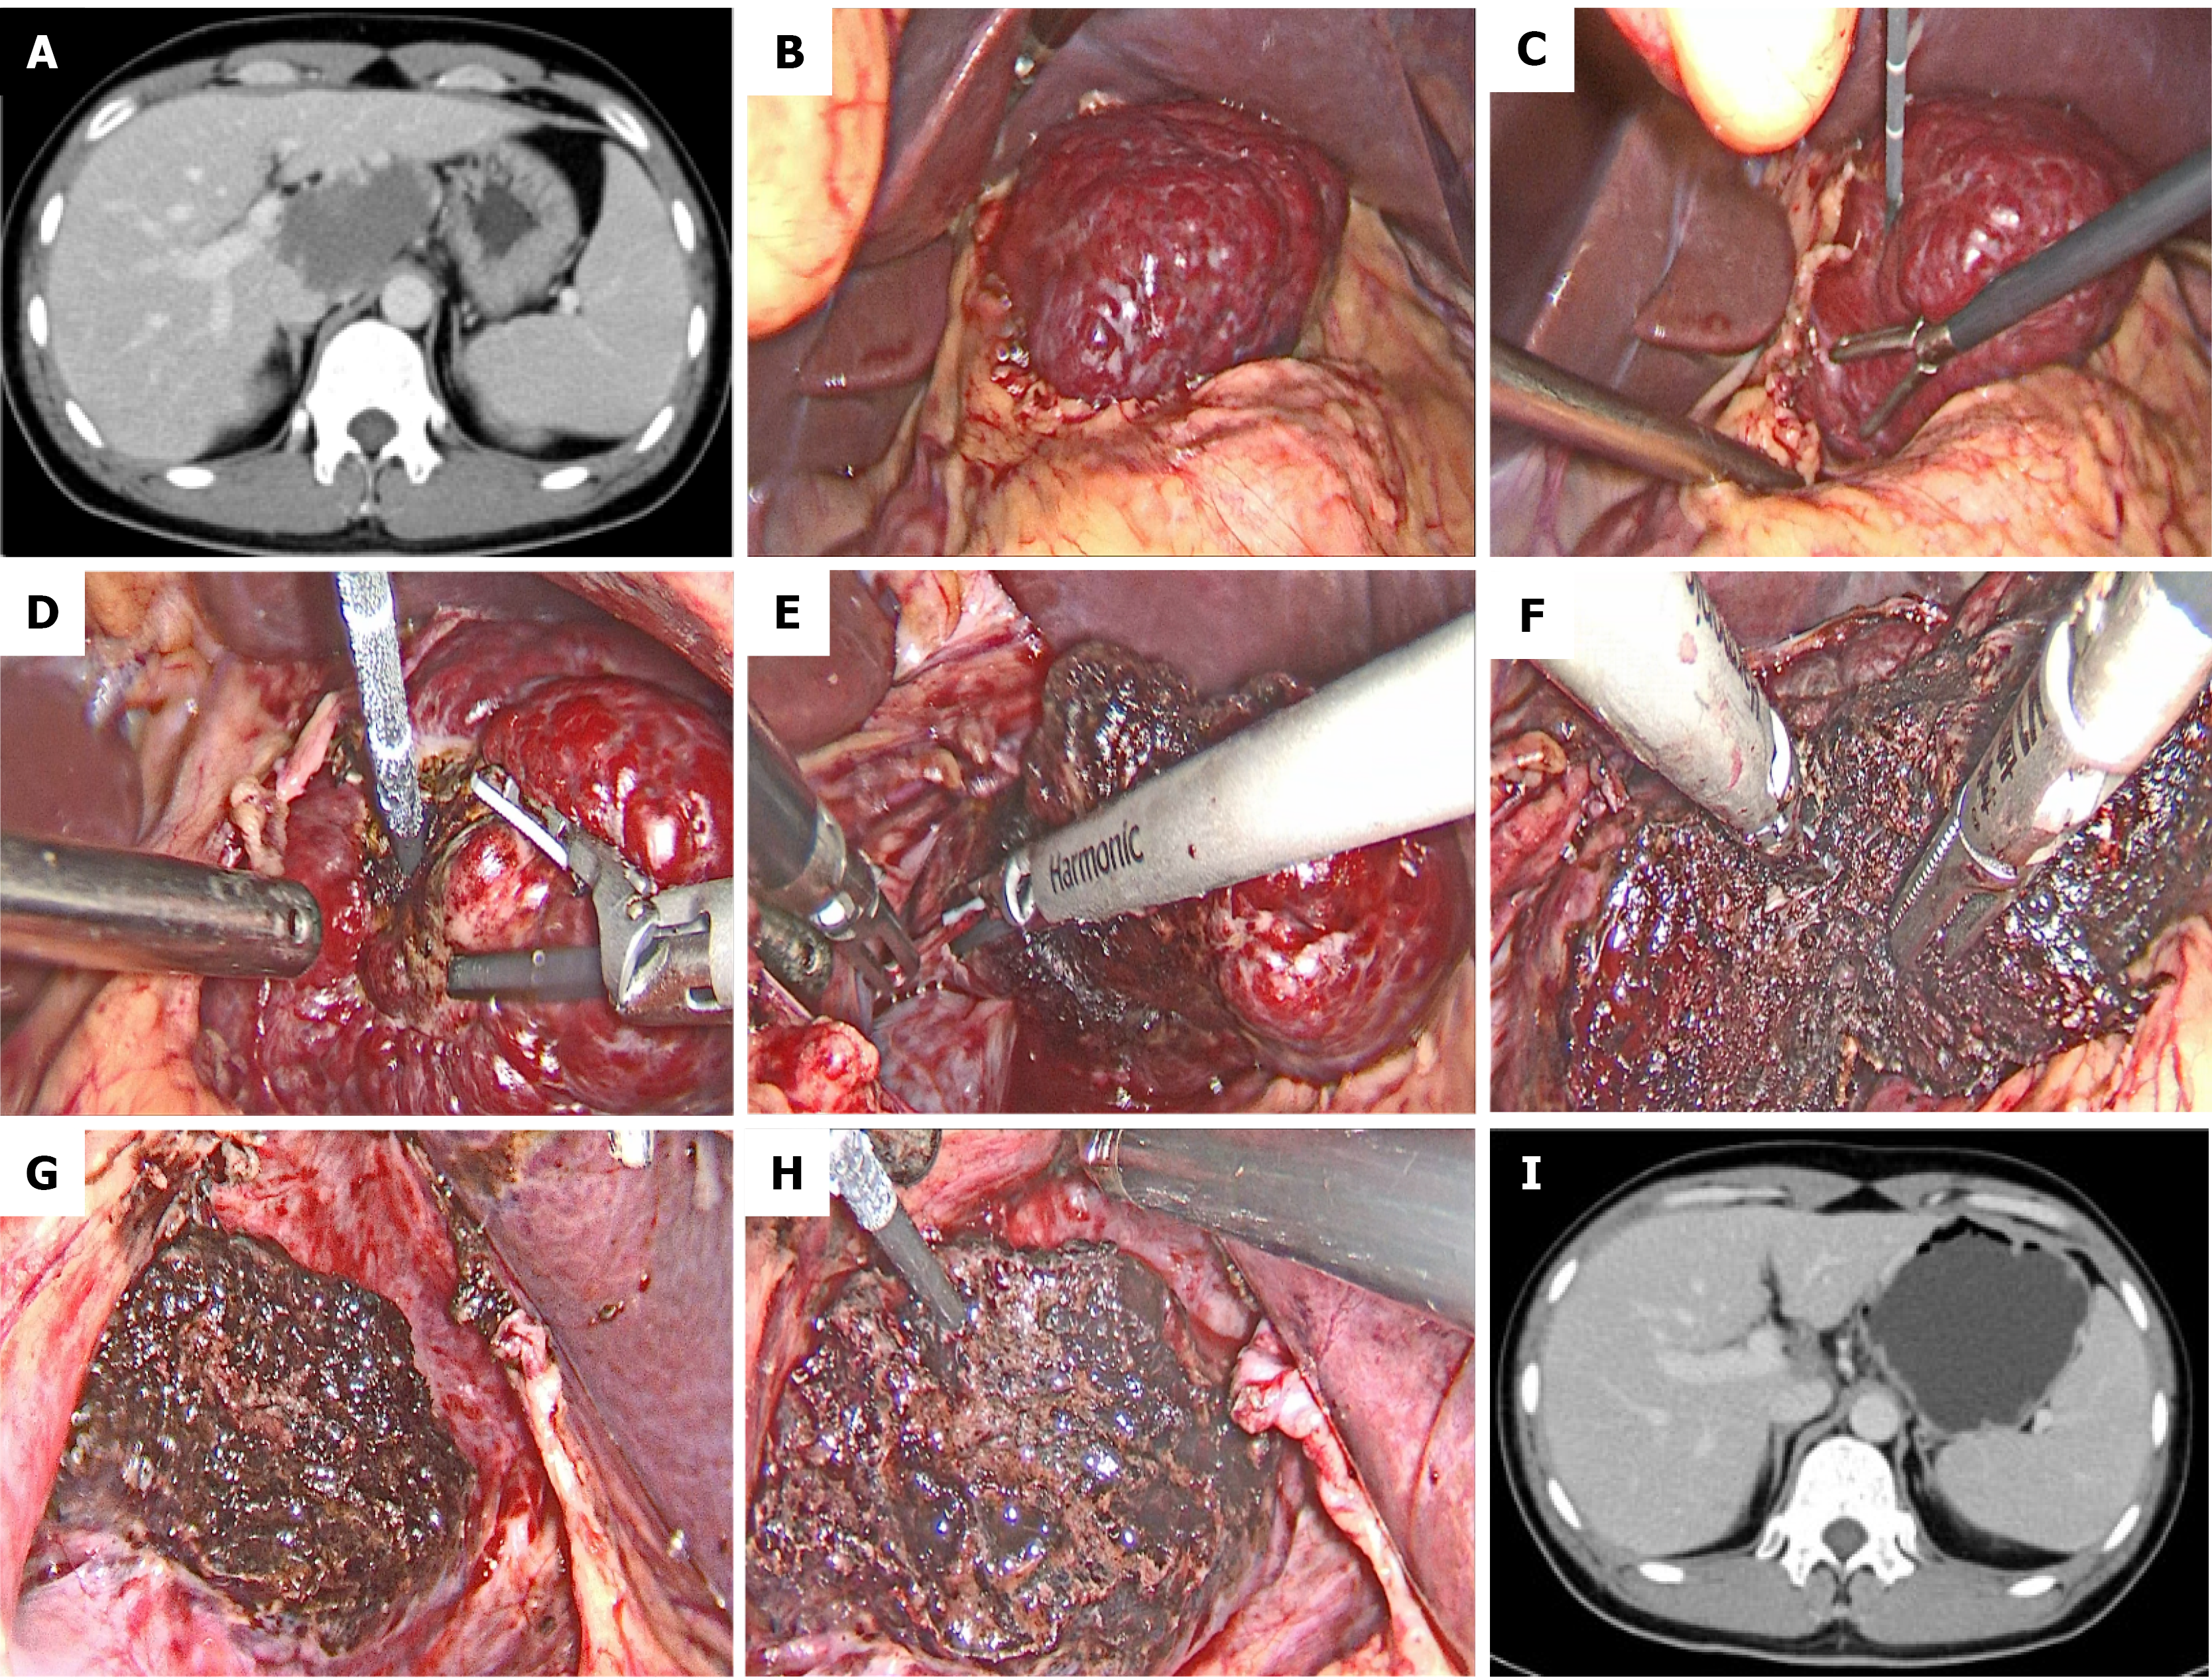
Figure 2 Laparoscopic intratumoral resection facilitated by coagulation of a 7.
0 cm hepatic Spiegel lobe hemangioma. A: Contrast-enhanced computed tomography (CT) demonstrated a 7.0 cm hepatic hemangioma in the Spiegel lobe; B: Expose the hemangioma in the hepatic Spiegel lobe; C and D: The resection margin was on the hemangioma about 1.0 cm away from the boundary between the normal liver parenchyma and the tumor. Ablation-induced coagulation was performed along the resection margin by percutaneously introducing a microwave antenna under direct visualization; E and F: The hepatic hemangioma was dissected along the coagulation-marked resection margin using a harmonic scalpel; G: The hemangioma was removed, and a 1.0-cm band of ablation-coagulated hemangioma was left in place; H: The ablation antenna was used to achieve hemostasis on the resection surface of the hepatic hemangioma; I: Contrast-enhanced CT shows that the hemangioma was completely resected without residual tissue.
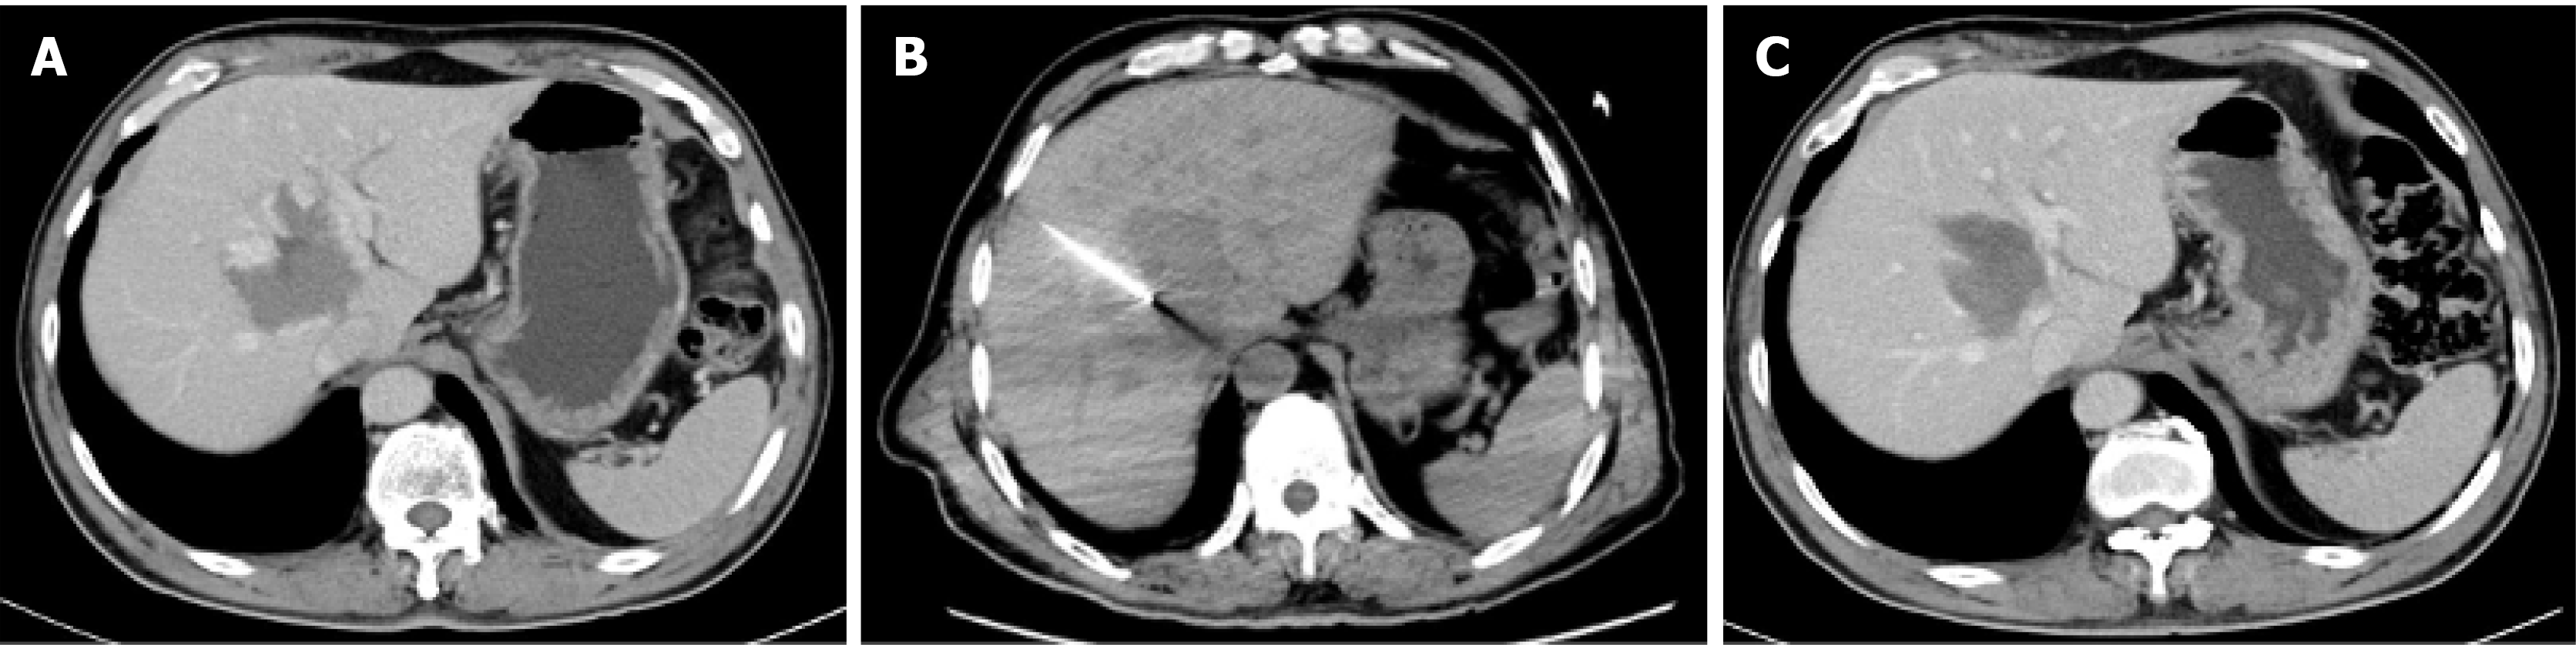
Figure 3 Percutaneous computed tomography-guided radiofrequency ablation of a 6.
5 cm hepatic paracaval portion hemangioma. A: Preoperative computed tomography (CT) scan demonstrated a hepatic caudate lobe hemangioma of 6.5 cm in paracaval portion of the caudate lobe; B: CT image showing radiofrequency needle within the lesion, lesion approached through the right intercostal approach; C: Follow-up CT at 1 month showed that the hemangioma was significantly smaller than before and had no enhancement.
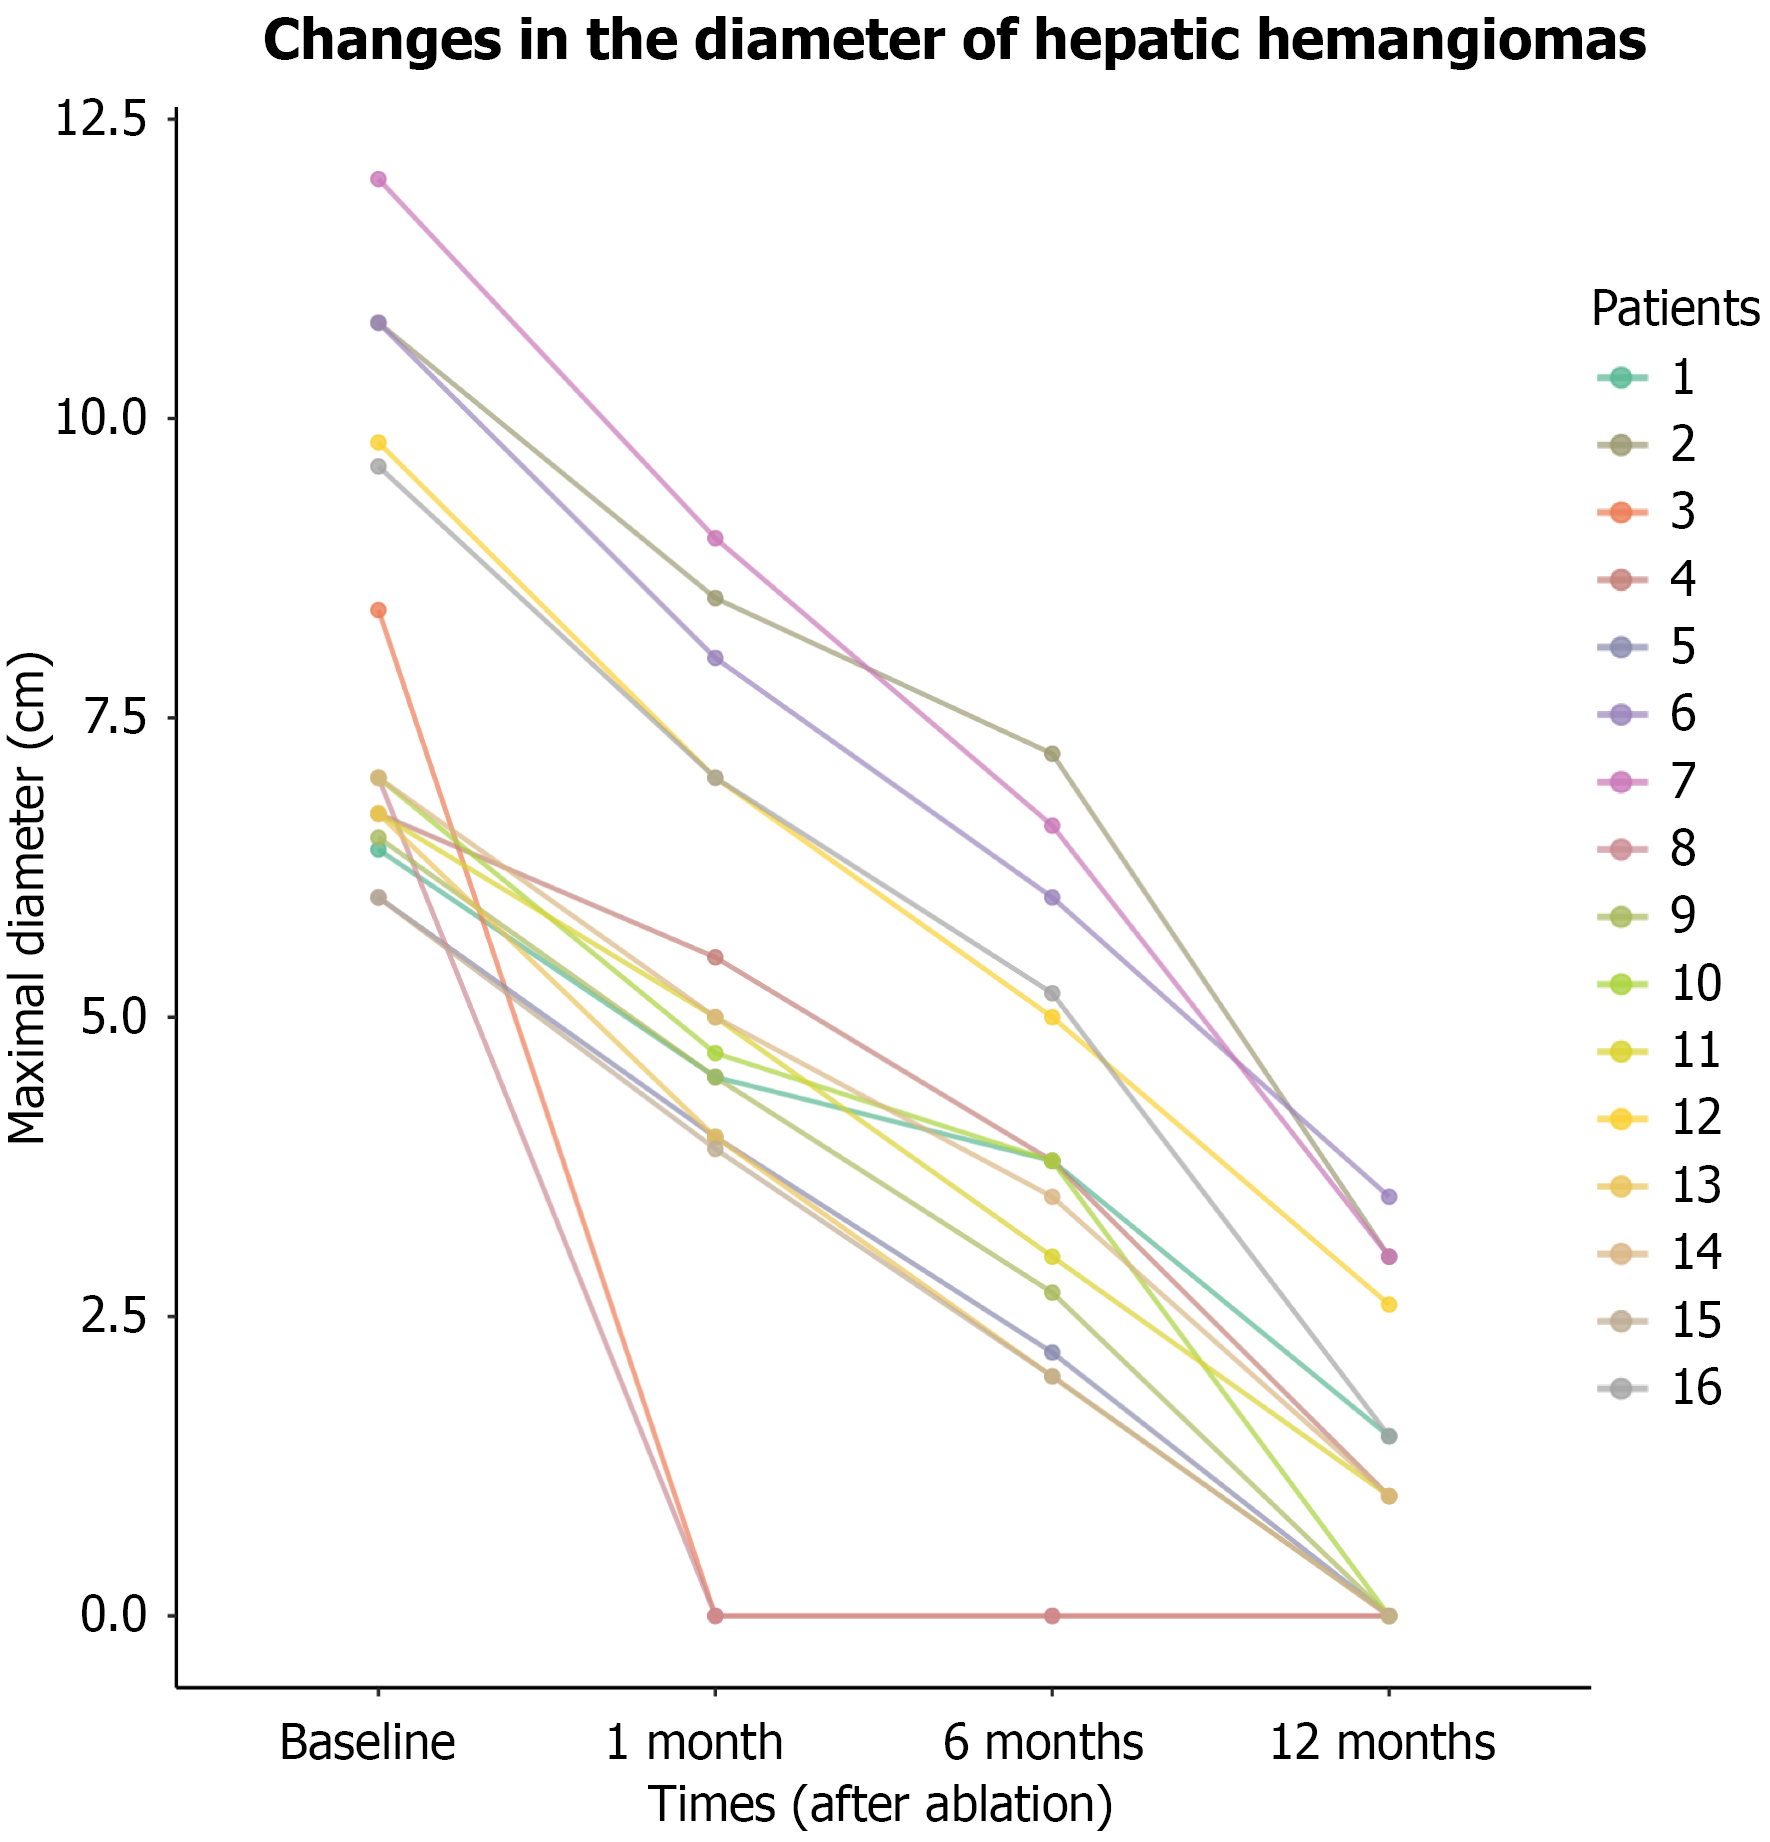
Figure 4 Line chart showing changes in hepatic caudate lobe hemangioma diameter.
- Citation: Xu L, Gao RZ, Dong SY, Kong J, Yao CY, Wu SL, Ke S, Zhou ZT, Gao J, Wang SH. Efficacy and safety of thermal ablation for large hepatic caudate lobe hemangioma. World J Gastrointest Surg 2026; 18(10): 122889
- URL: https://www.wjgnet.com/1948-9366/full/v18/i10/122889.htm
- DOI: https://dx.doi.org/10.4240/wjgs.122889