
















Copyright: ©Author(s) 2026.
World J Gastrointest Surg. Oct 27, 2026; 18(10): 121585
Published online Oct 27, 2026. doi: 10.4240/wjgs.121585
Published online Oct 27, 2026. doi: 10.4240/wjgs.121585
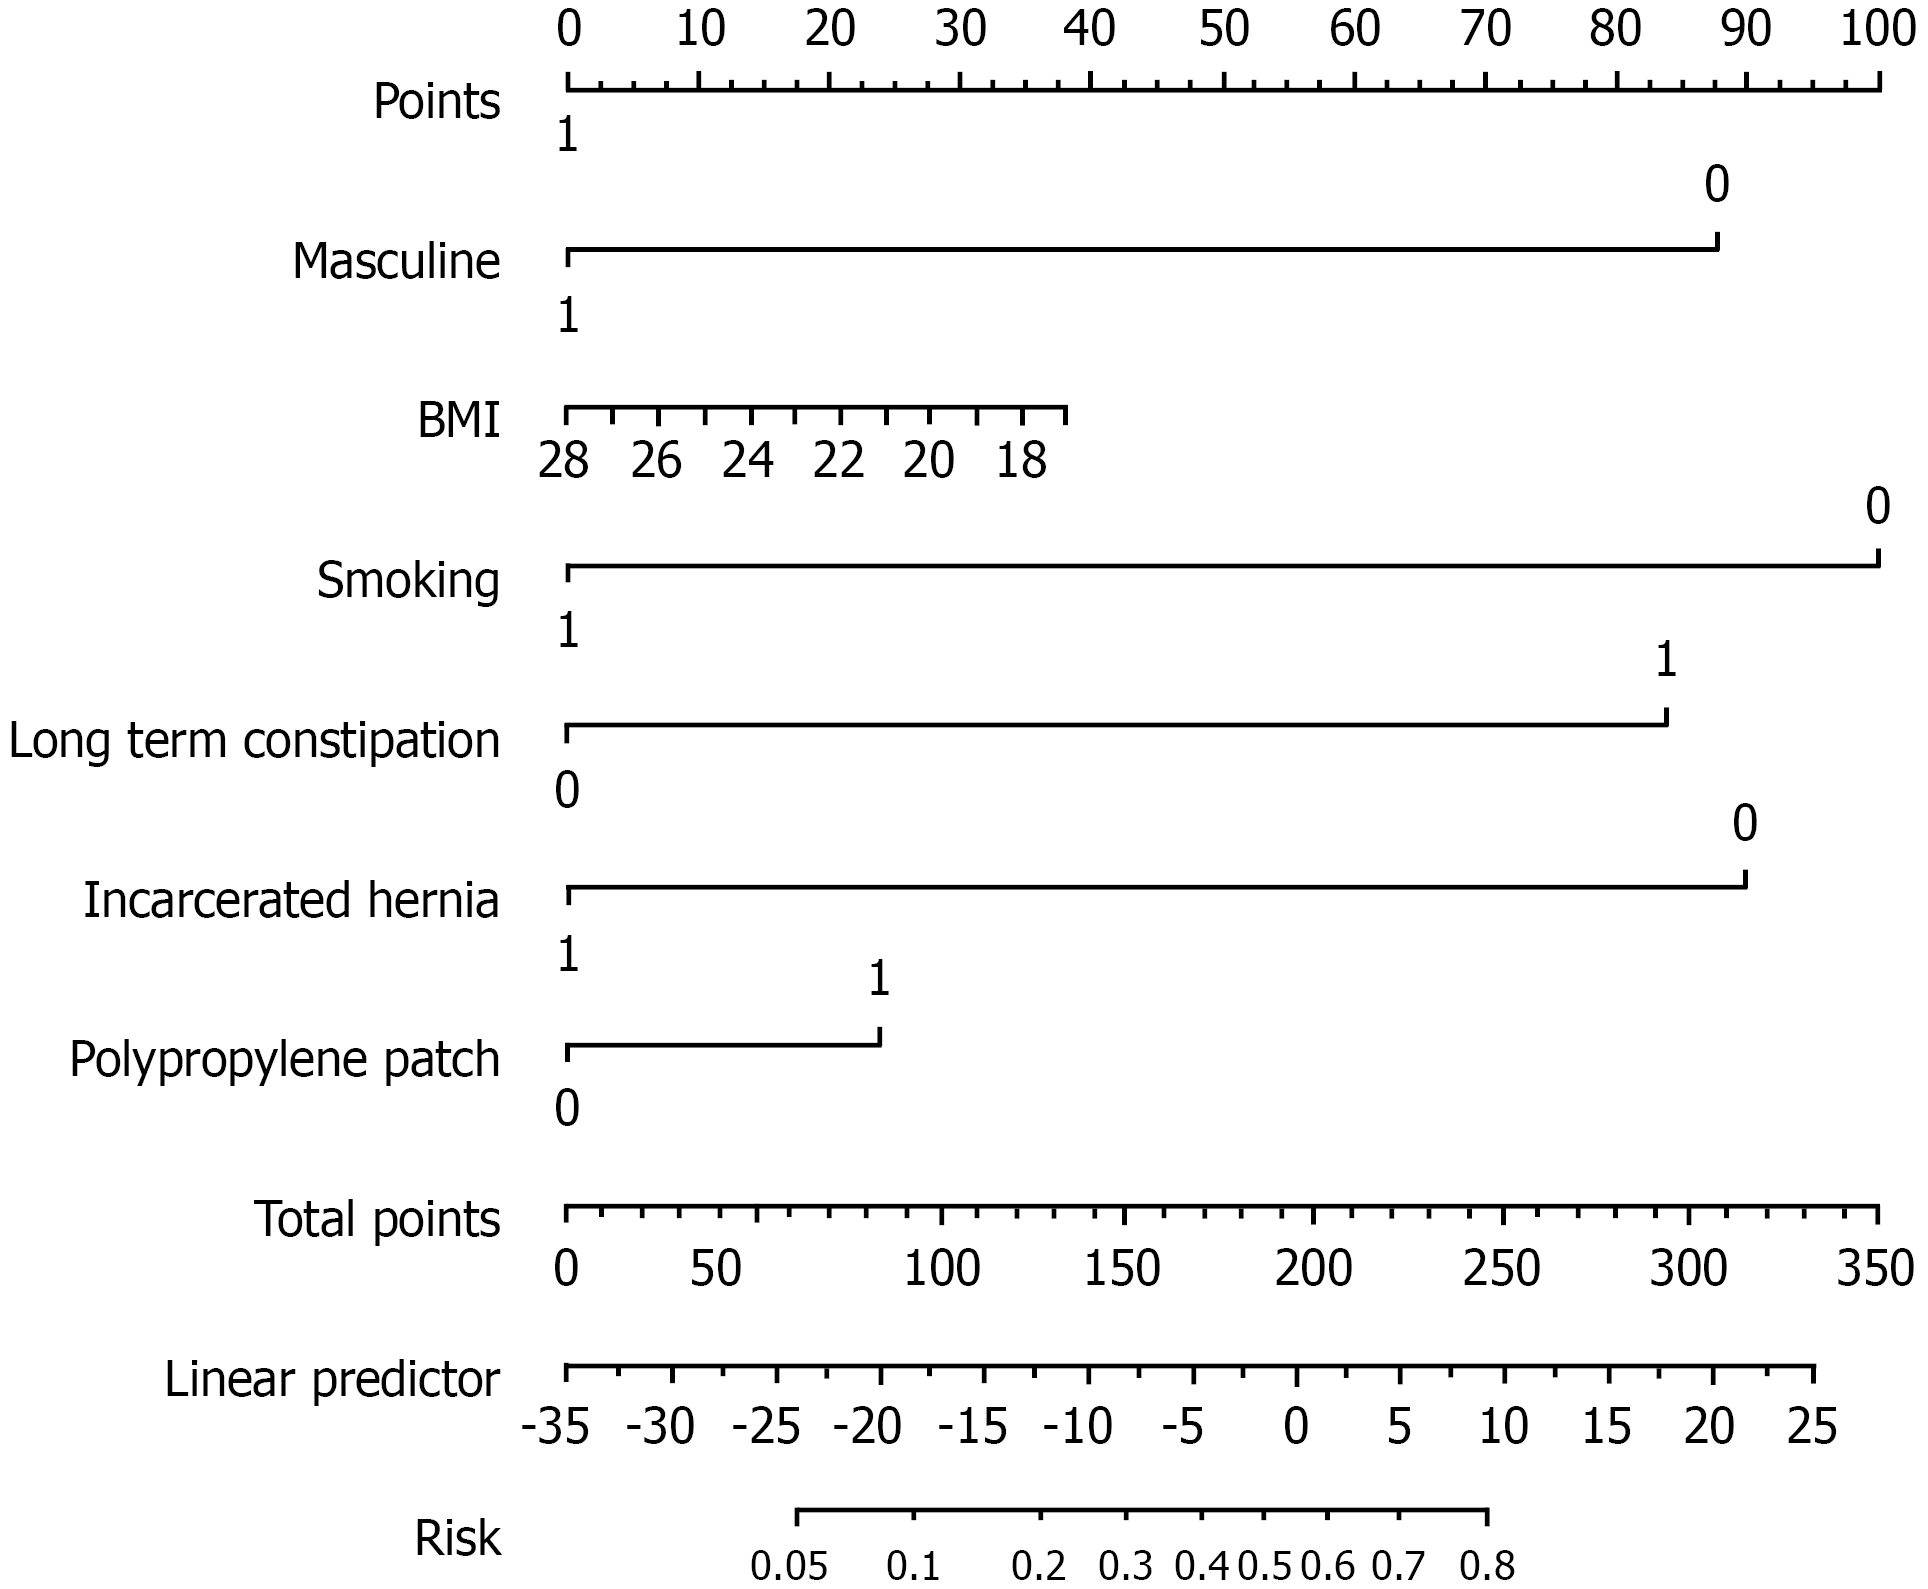
Figure 1 Column diagram of clinical prediction model.
BMI: Body mass index.
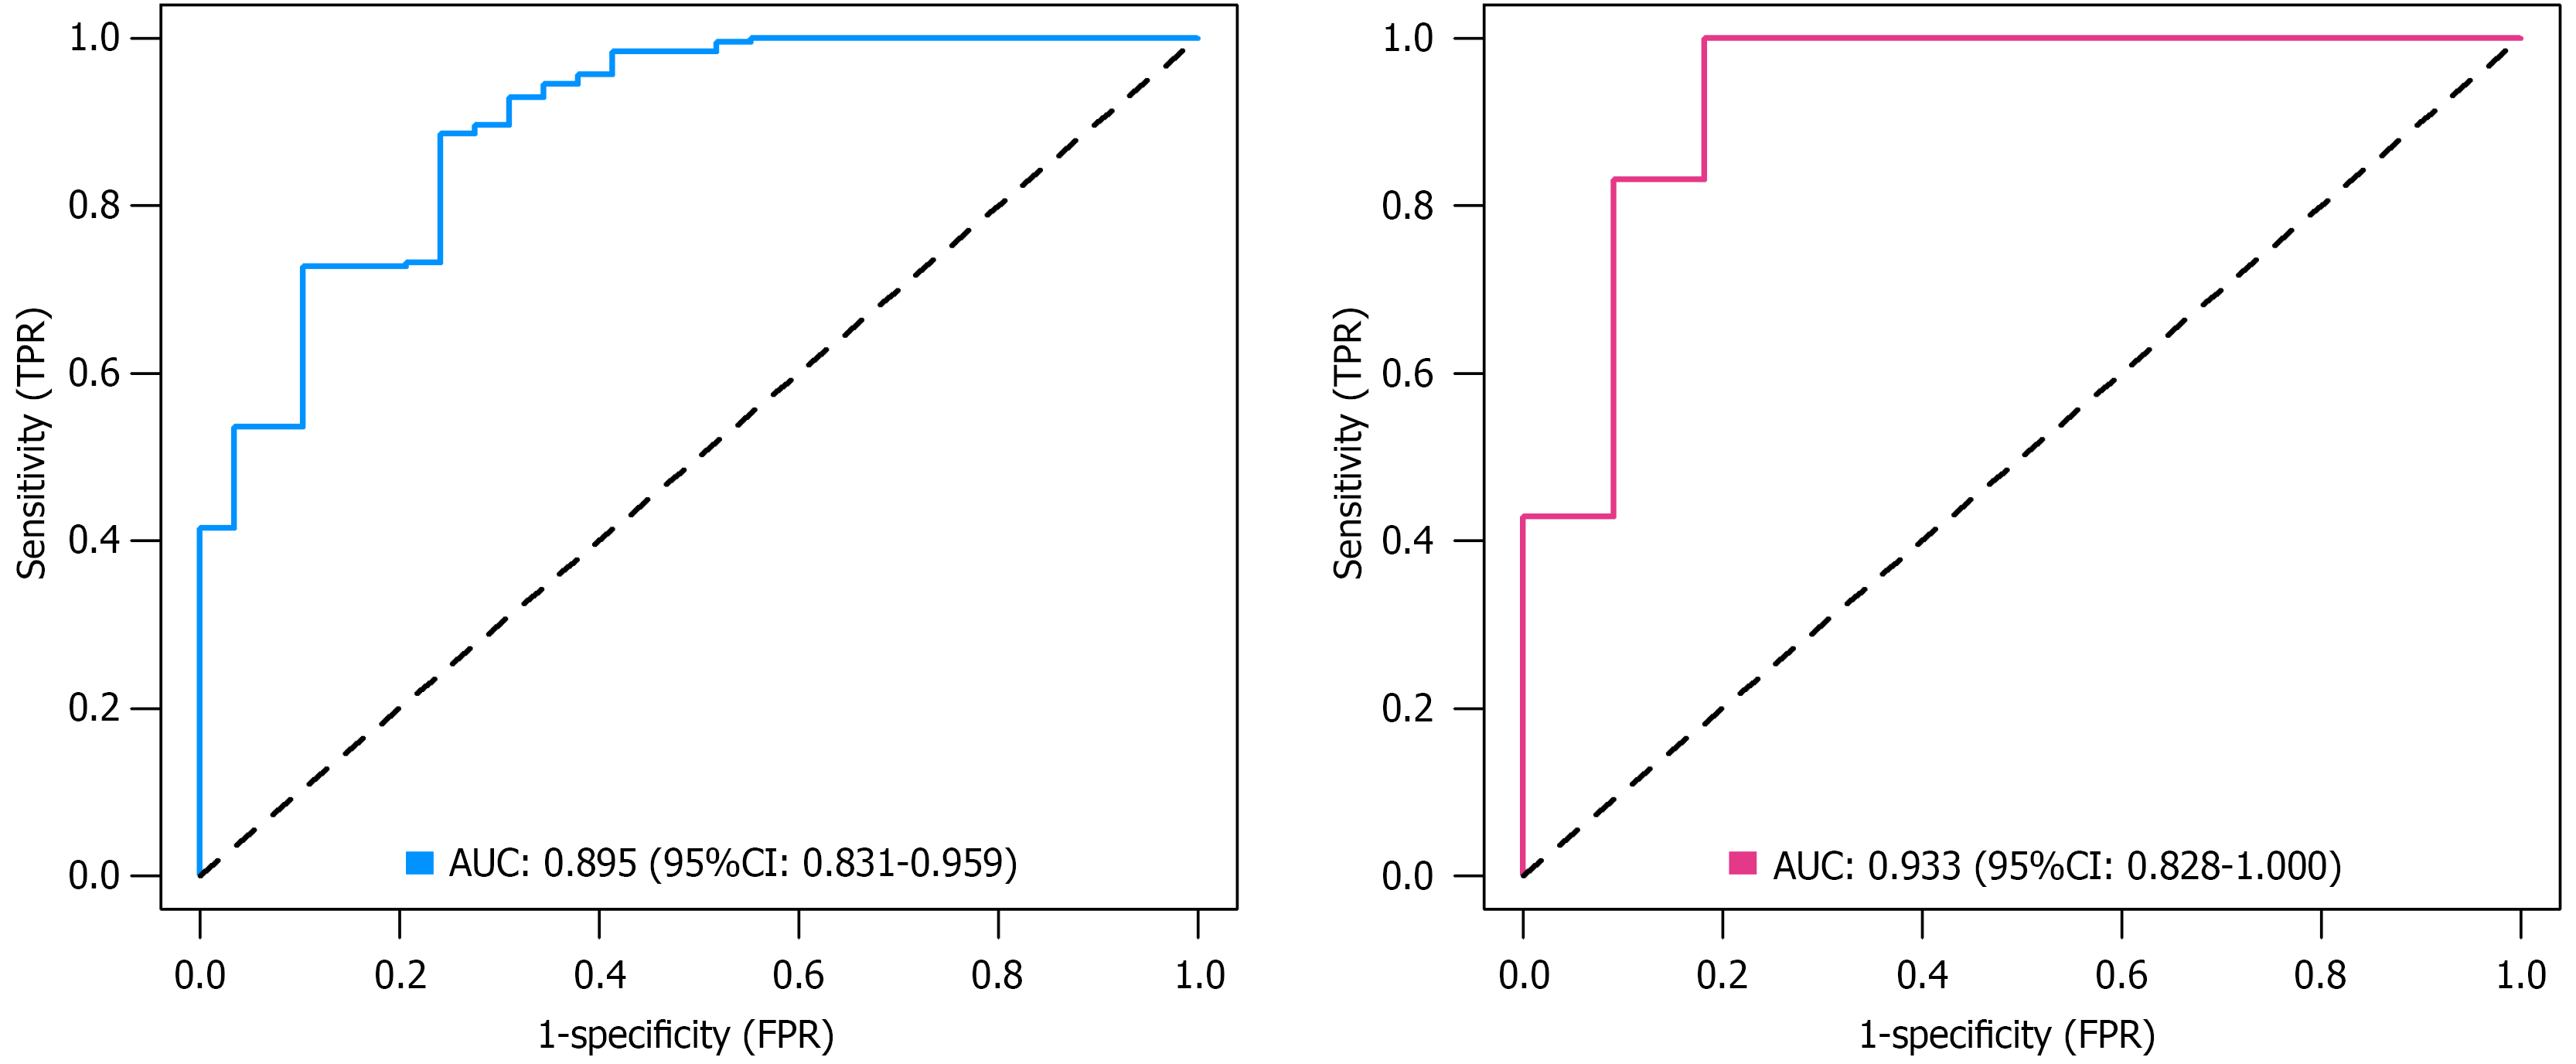
Figure 2 The receiver operating characteristic curve of model predictions for training set and validation set.
TPR: True positive rate; FPR: False rejection rate; AUC: Area under the curve; CI: Confidence interval.
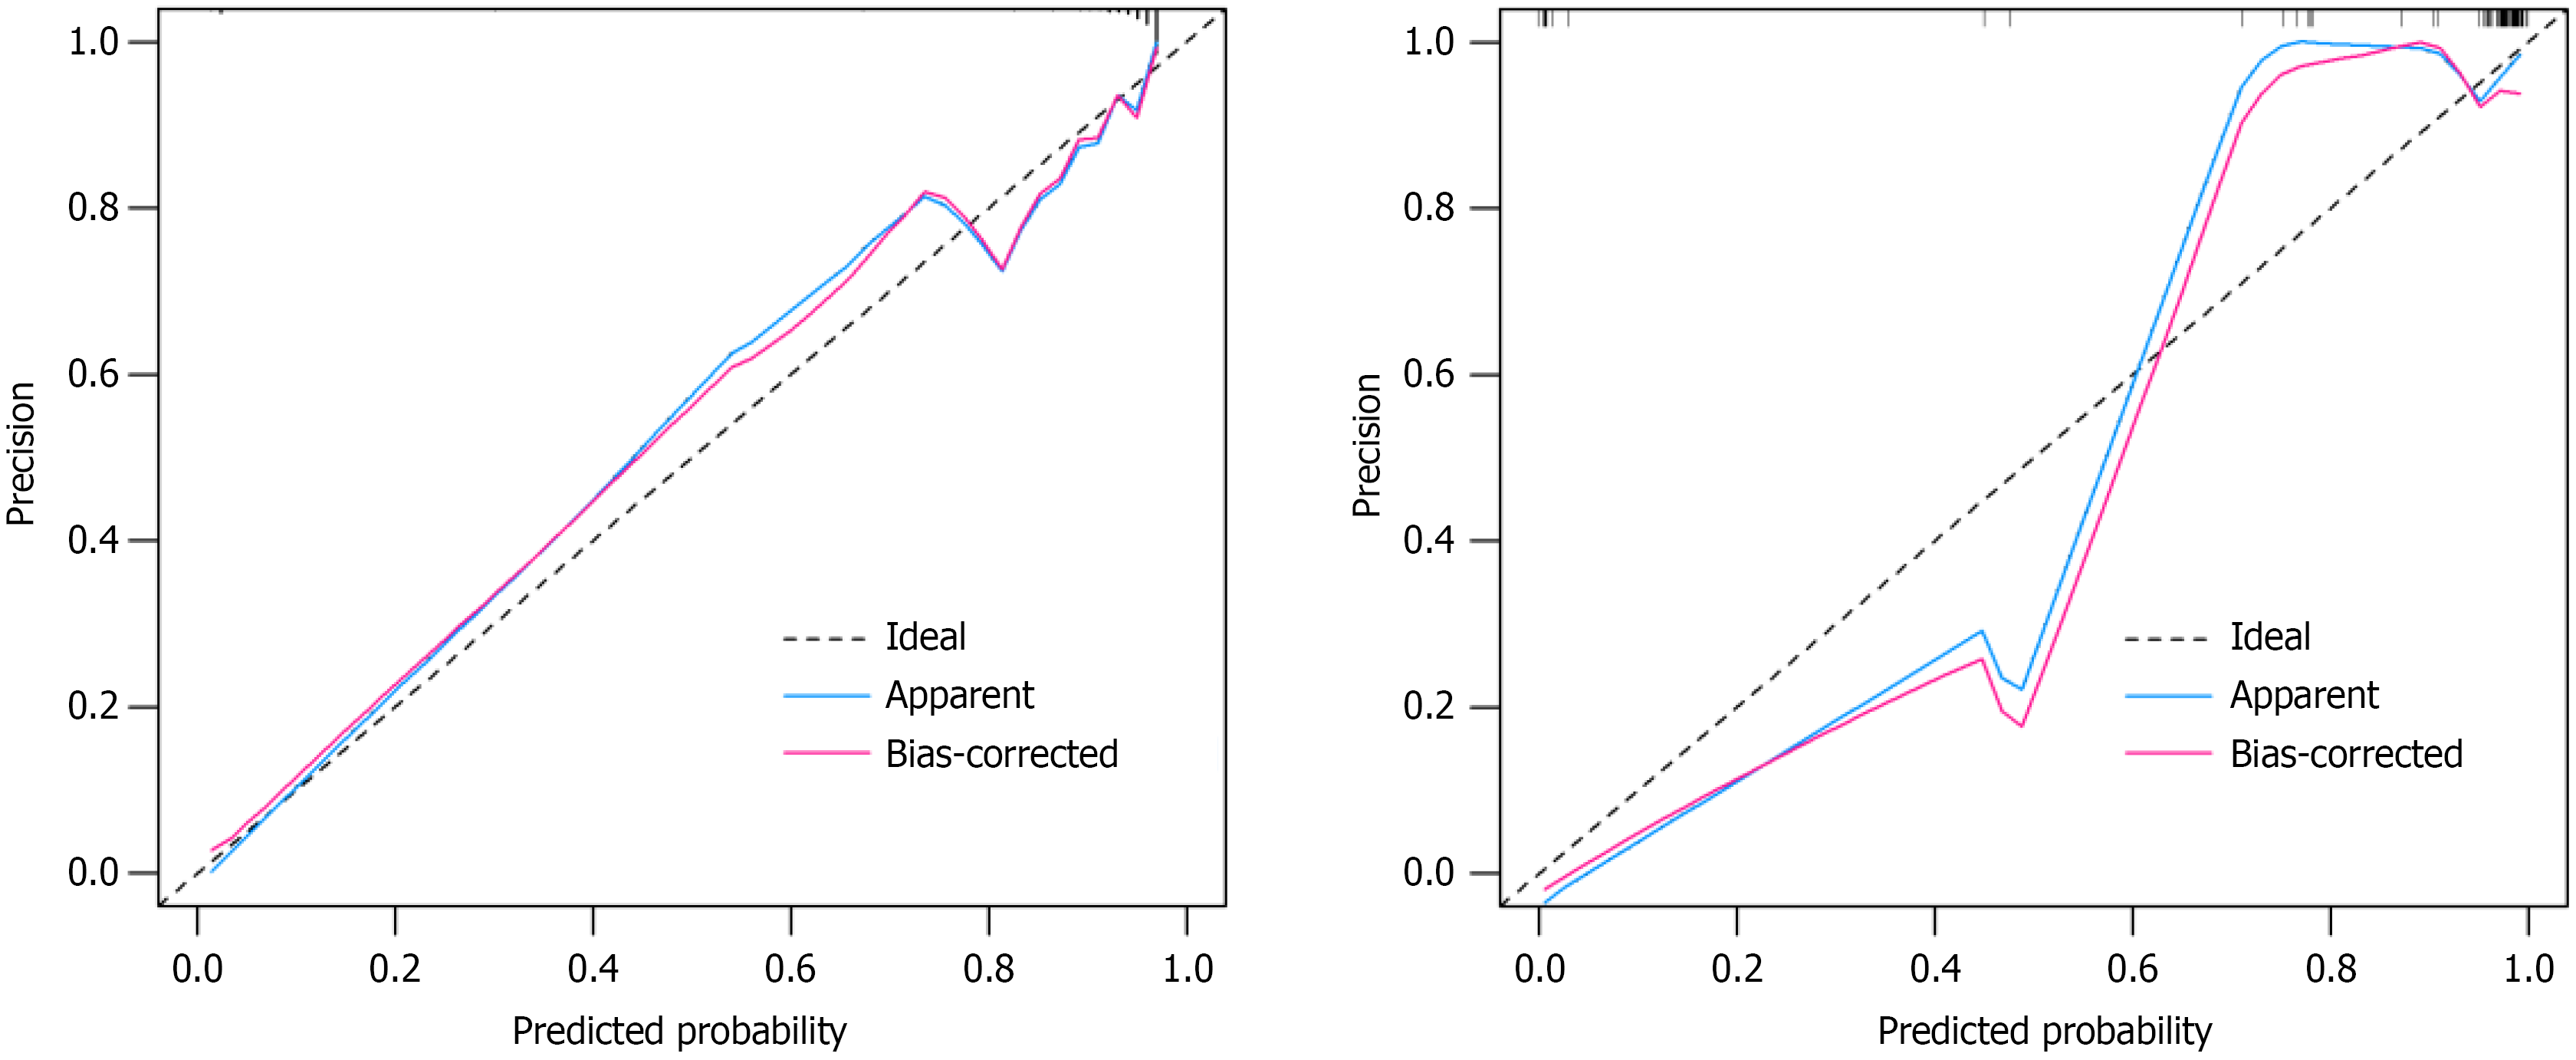
Figure 3
The clinical calibration curves for training set and validation set.
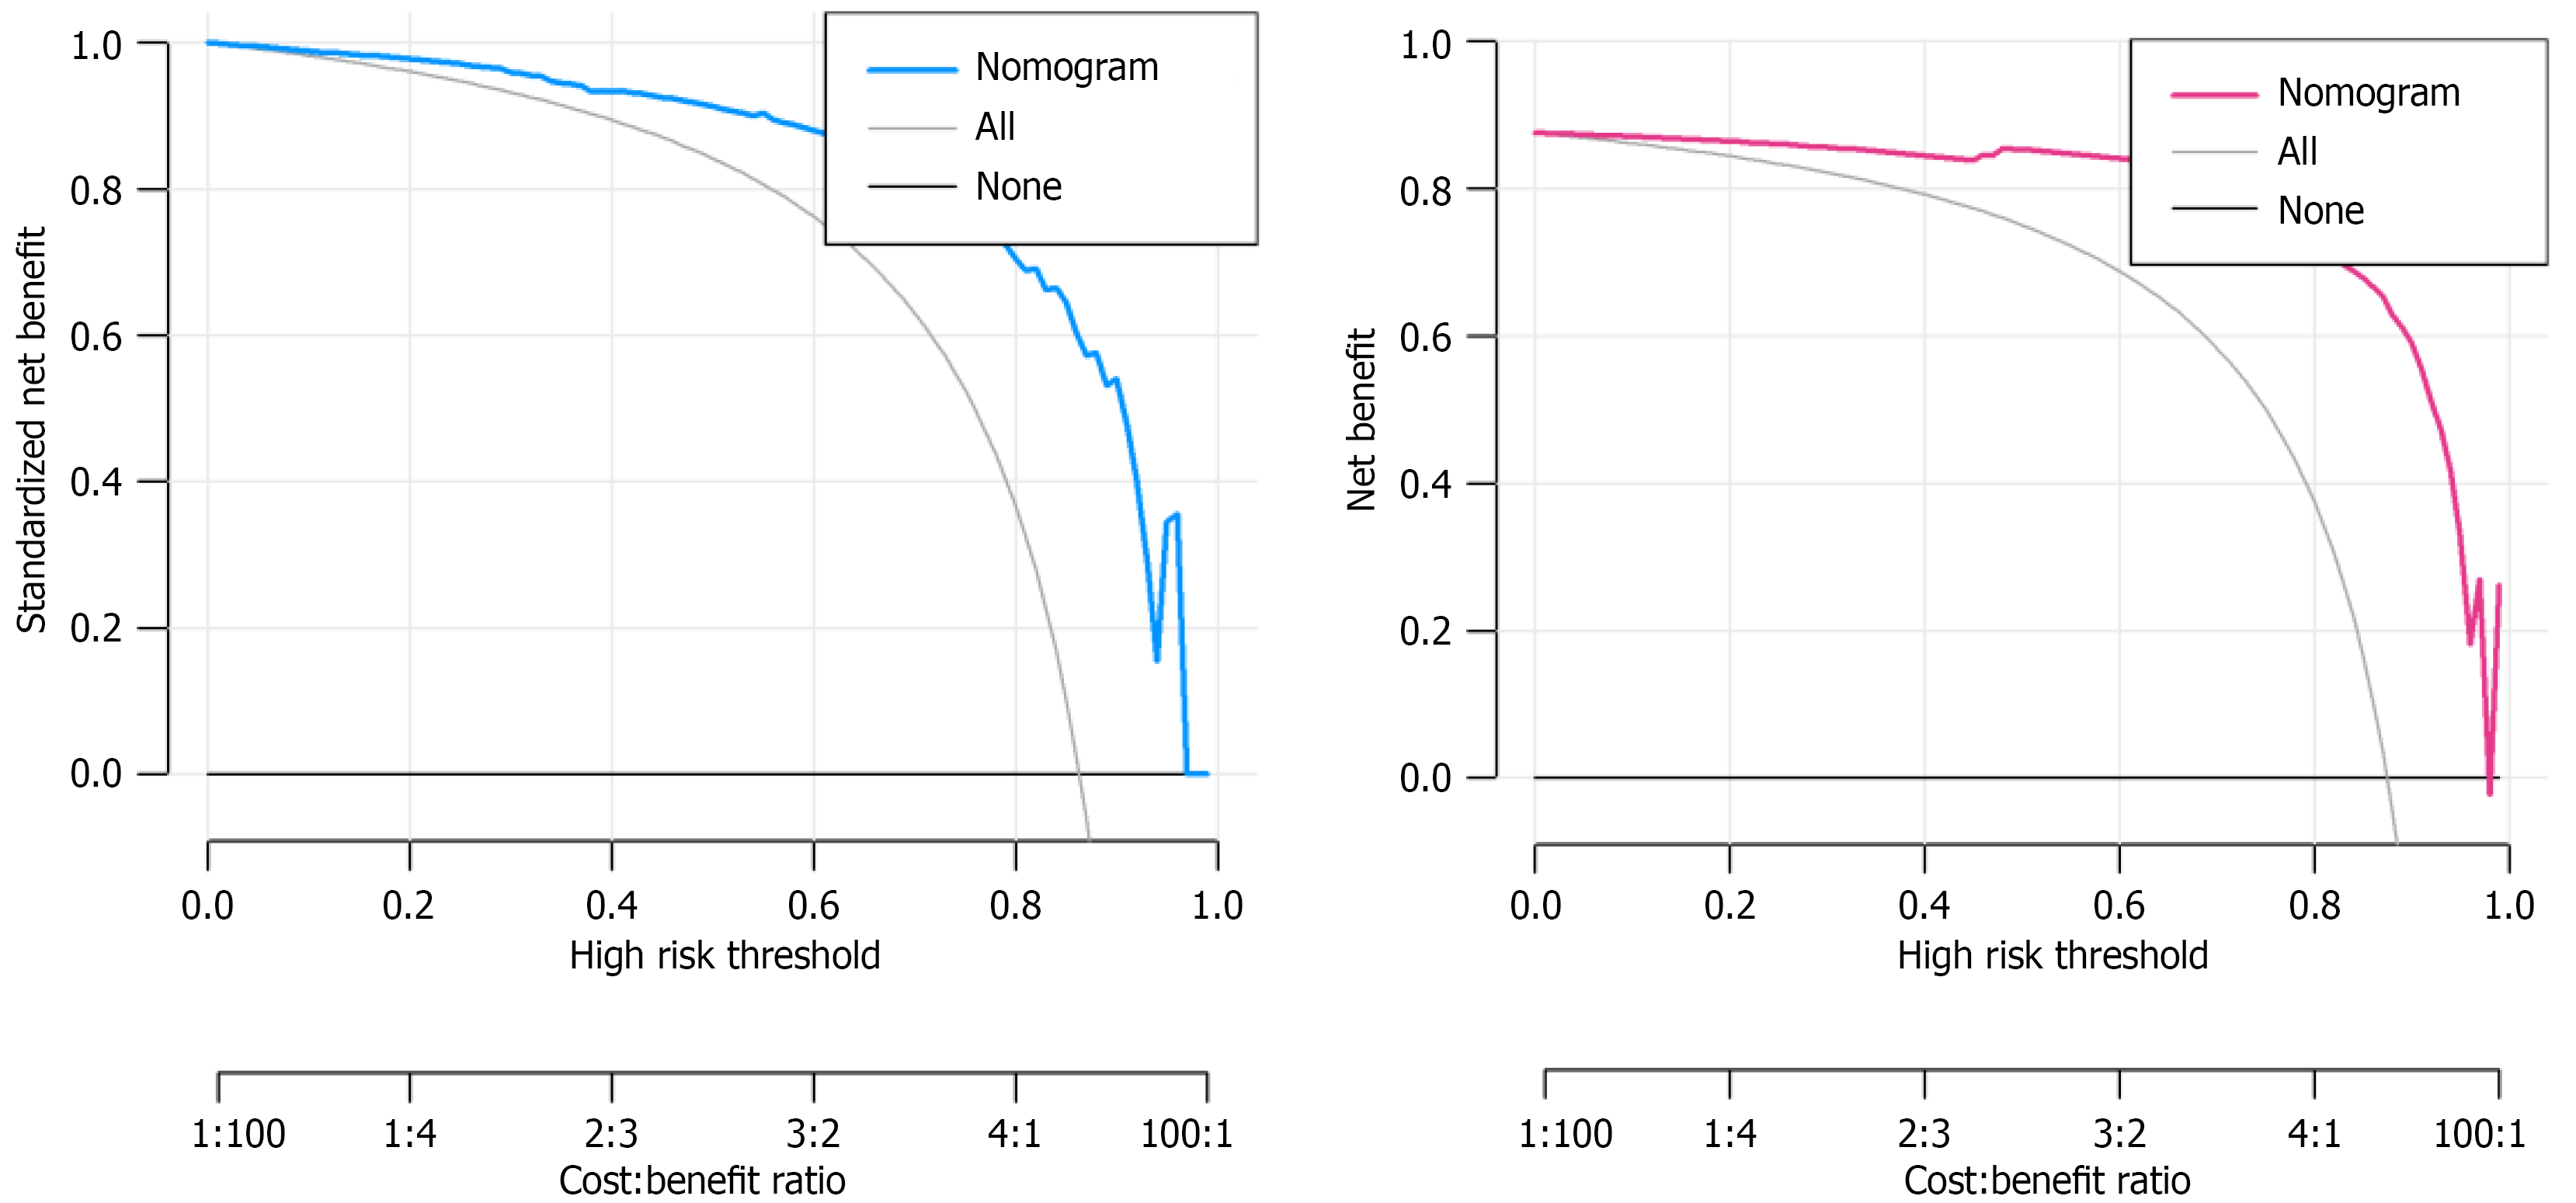
Figure 4
The decision-making curve analyses curves for training set and validation set.
- Citation: Cao CP, Xiong H, Zhu ZH, Zhang JP. Clinical prediction model for inguinal hernia recurrence risk after transabdominal preperitoneal hernia repair surgery in elderly patients. World J Gastrointest Surg 2026; 18(10): 121585
- URL: https://www.wjgnet.com/1948-9366/full/v18/i10/121585.htm
- DOI: https://dx.doi.org/10.4240/wjgs.121585