Copyright
©The Author(s) 2025.
World J Gastrointest Surg. Jul 27, 2025; 17(7): 105833
Published online Jul 27, 2025. doi: 10.4240/wjgs.v17.i7.105833
Published online Jul 27, 2025. doi: 10.4240/wjgs.v17.i7.105833
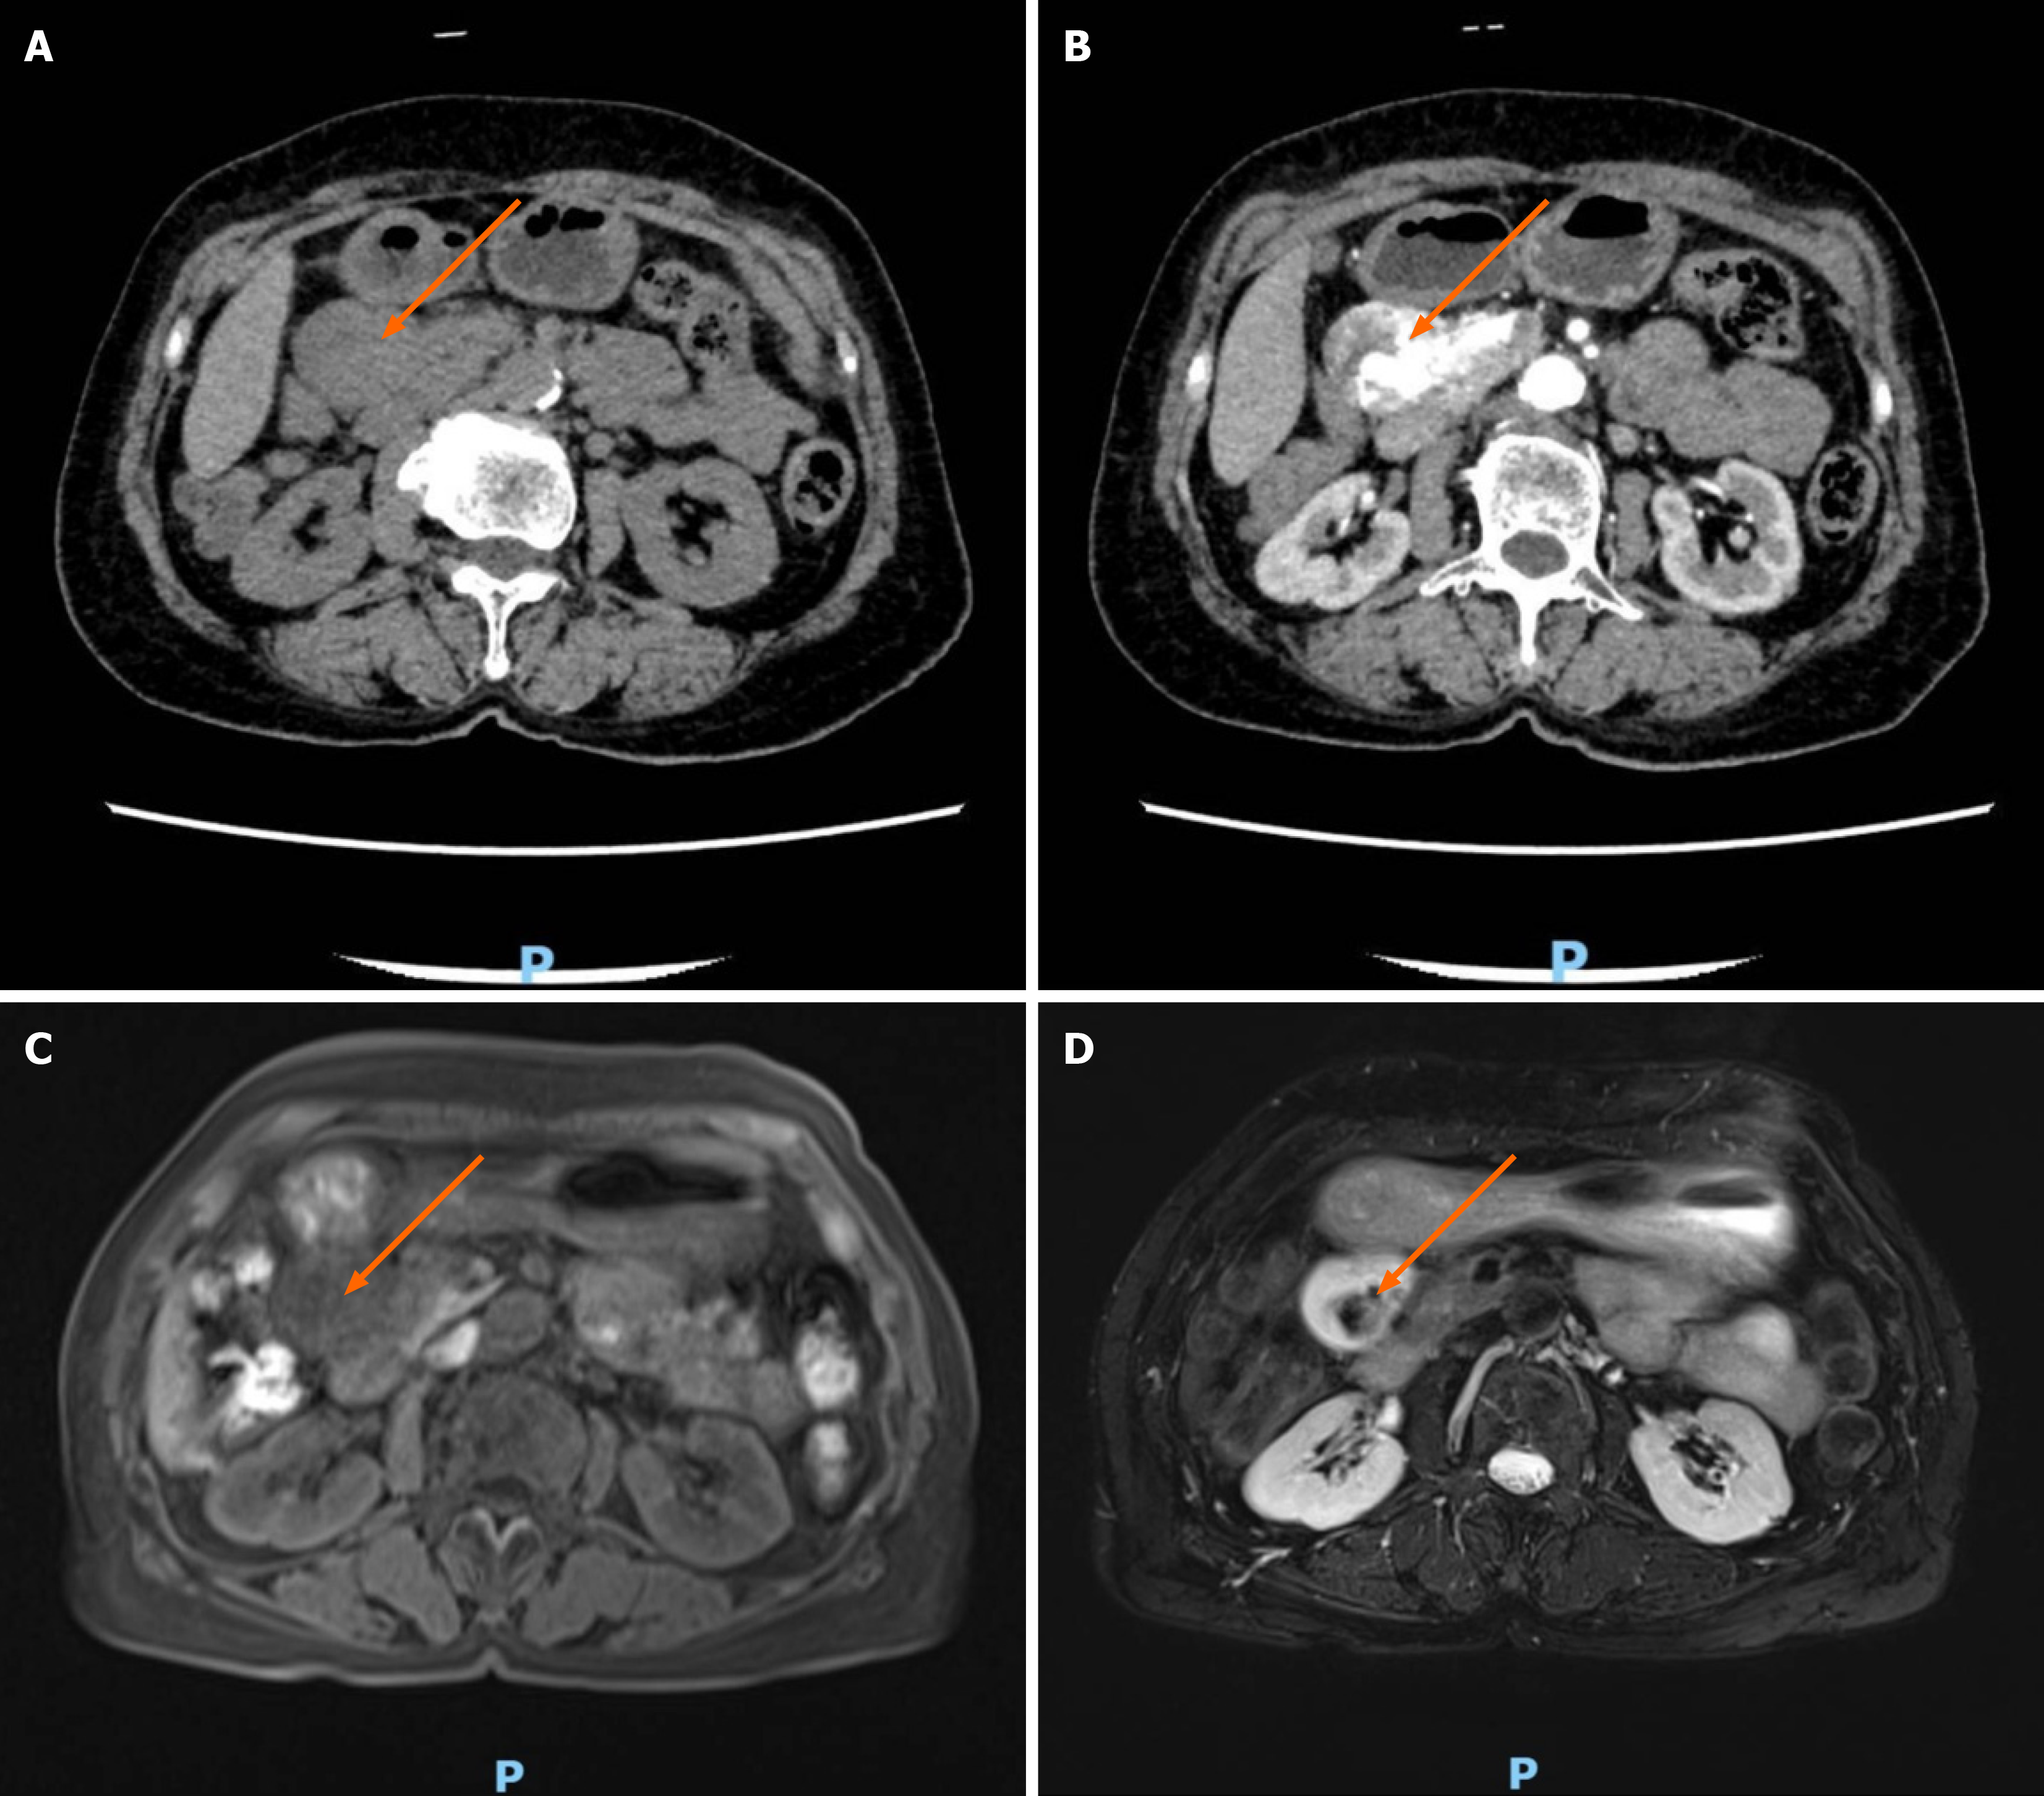
Figure 1 Computed tomography and magnetic resonance imaging findings.
A: A Non-contrast-enhanced computed tomography scan showing a mass of approximately 3.2 cm × 4.1 cm × 5.0 cm in size at the lower edge of the liver and pancreatic head (orange arrow: Pancreas); B: Computed tomography enhancement showing the passage of blood vessels within the tumor, with patchy areas without enhancement and dilated blood vessels in the center (orange arrow: Pancreas); C: Non-contrast-enhanced magnetic resonance imaging in the pancreatic head; D: Magnetic resonance imaging enhanced arterial scan showed patchy enhancement in the center of the lesion and the delayed scan showed non-enhancement in the strip of patchy areas.
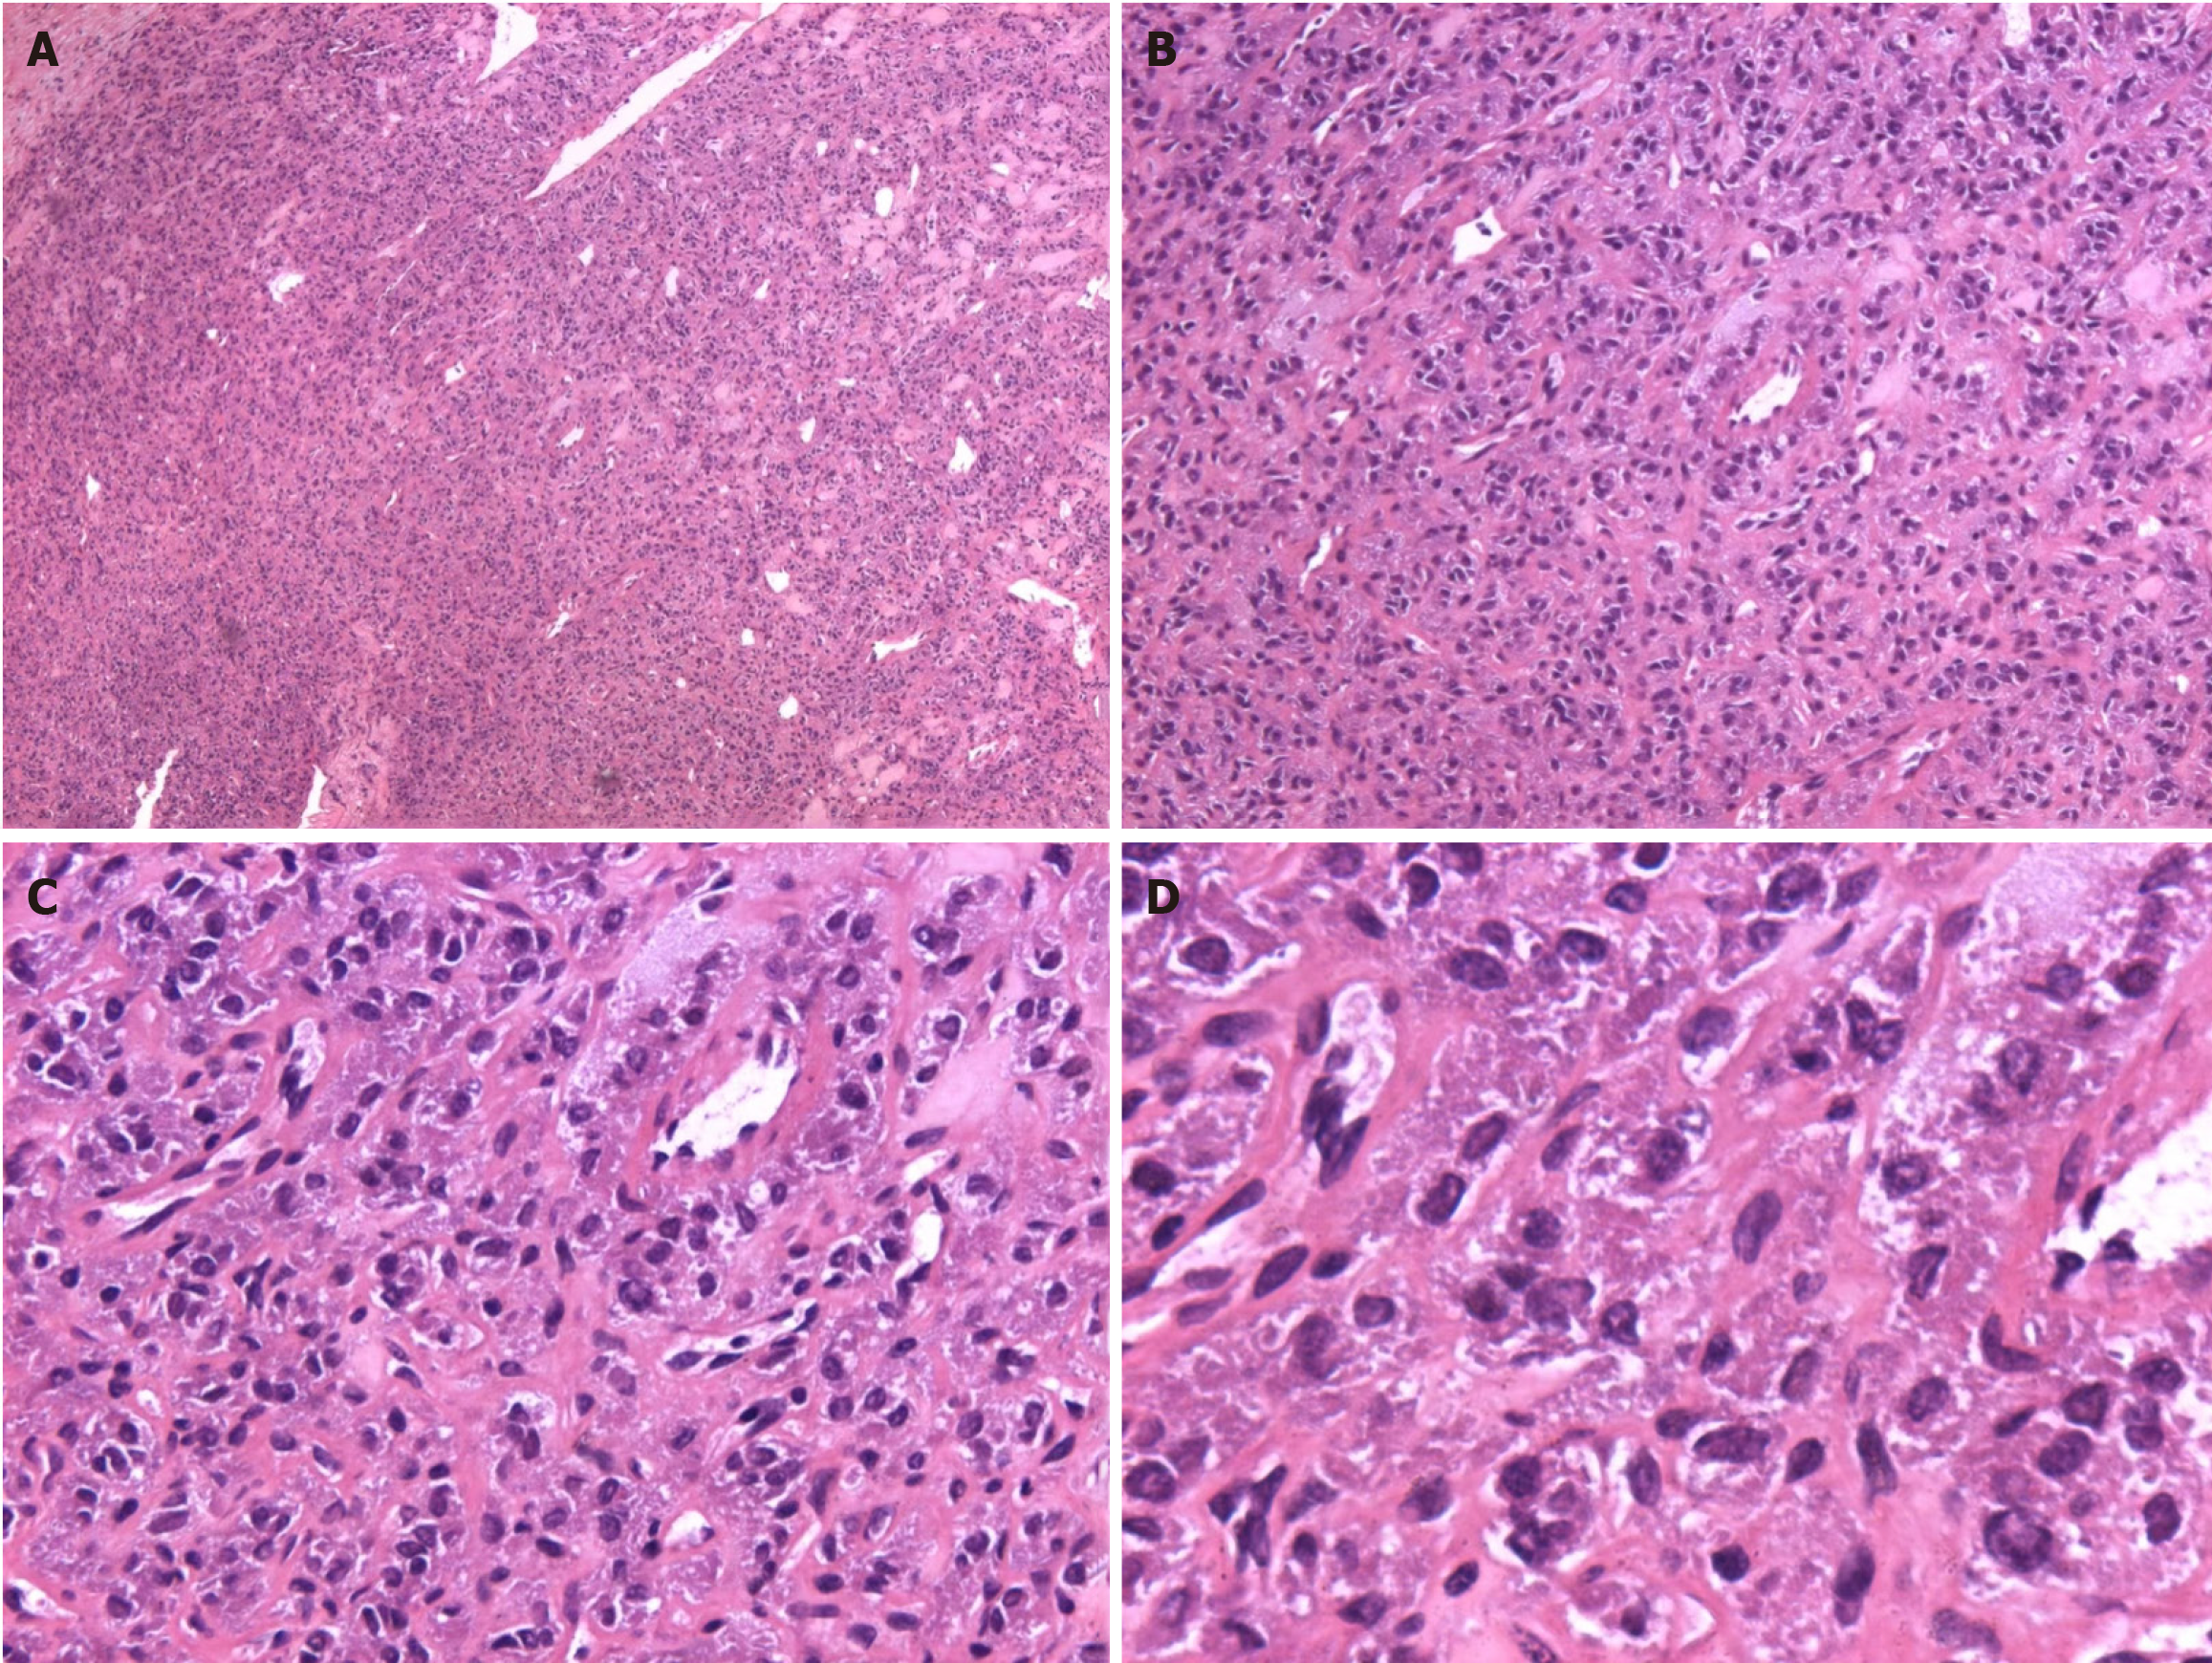
Figure 2 Postoperative microscopic images.
A: Heterogeneous cells arranged in organoid or chrysanthemum-shaped clusters [Hematoxylin and eosin (HE): 50 ×]; B: Cells with increased nucleoplasmic ratios and eosinophilic cytoplasm (HE: 100 ×); C: Interstitial fibrous tissue proliferation and myxoid degeneration (HE: 200 ×); D: Irregular nuclear membranes. finechromatin.no necrosis formation (HE: 400 ×).
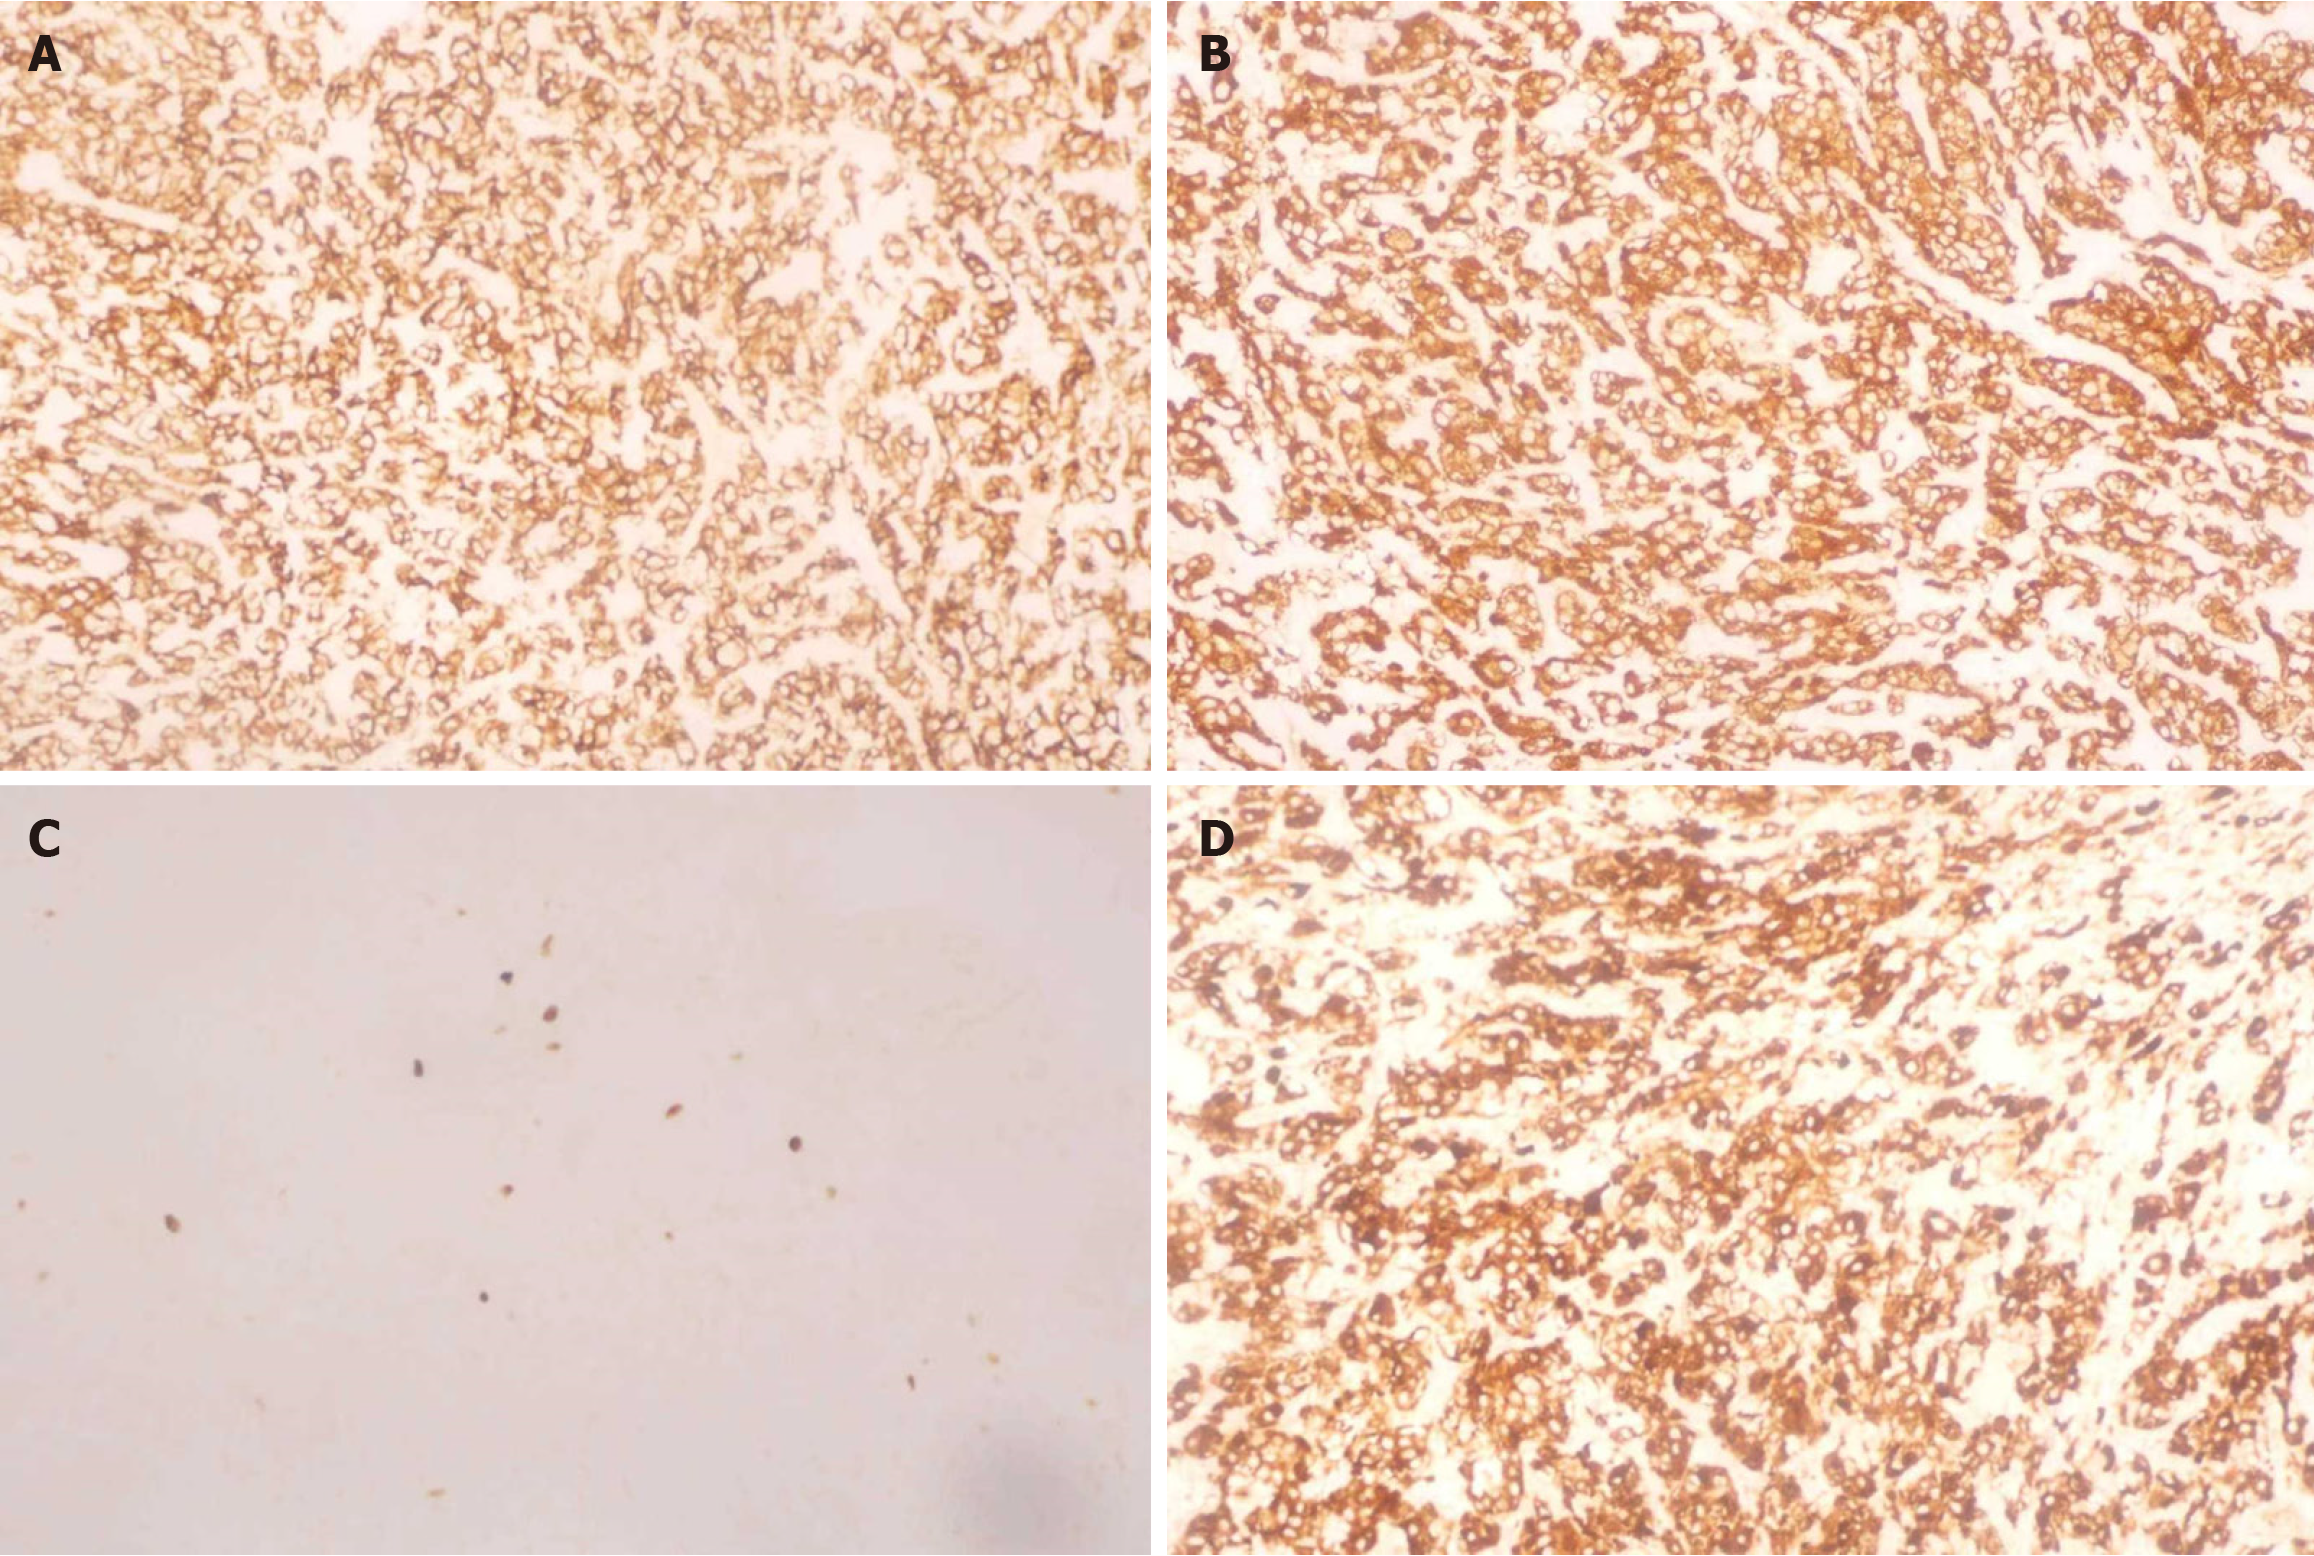
Figure 3 Immunohistochemistry findings.
A: Cluster of differentiation 56 (+); B: Chromogranin A (+); C: Antigen identified by monoclonal antibody Ki-67 (+, 2%-3%); D: Synaptophysin (+) (magnification 200 ×).
- Citation: Luo SZ, Liu JR, Liu TQ, Chen Q. Functional paraganglioma of the pancreatic head: A case report and review of literature. World J Gastrointest Surg 2025; 17(7): 105833
- URL: https://www.wjgnet.com/1948-9366/full/v17/i7/105833.htm
- DOI: https://dx.doi.org/10.4240/wjgs.v17.i7.105833


