Copyright
©The Author(s) 2025.
World J Gastrointest Surg. Jun 27, 2025; 17(6): 106361
Published online Jun 27, 2025. doi: 10.4240/wjgs.v17.i6.106361
Published online Jun 27, 2025. doi: 10.4240/wjgs.v17.i6.106361
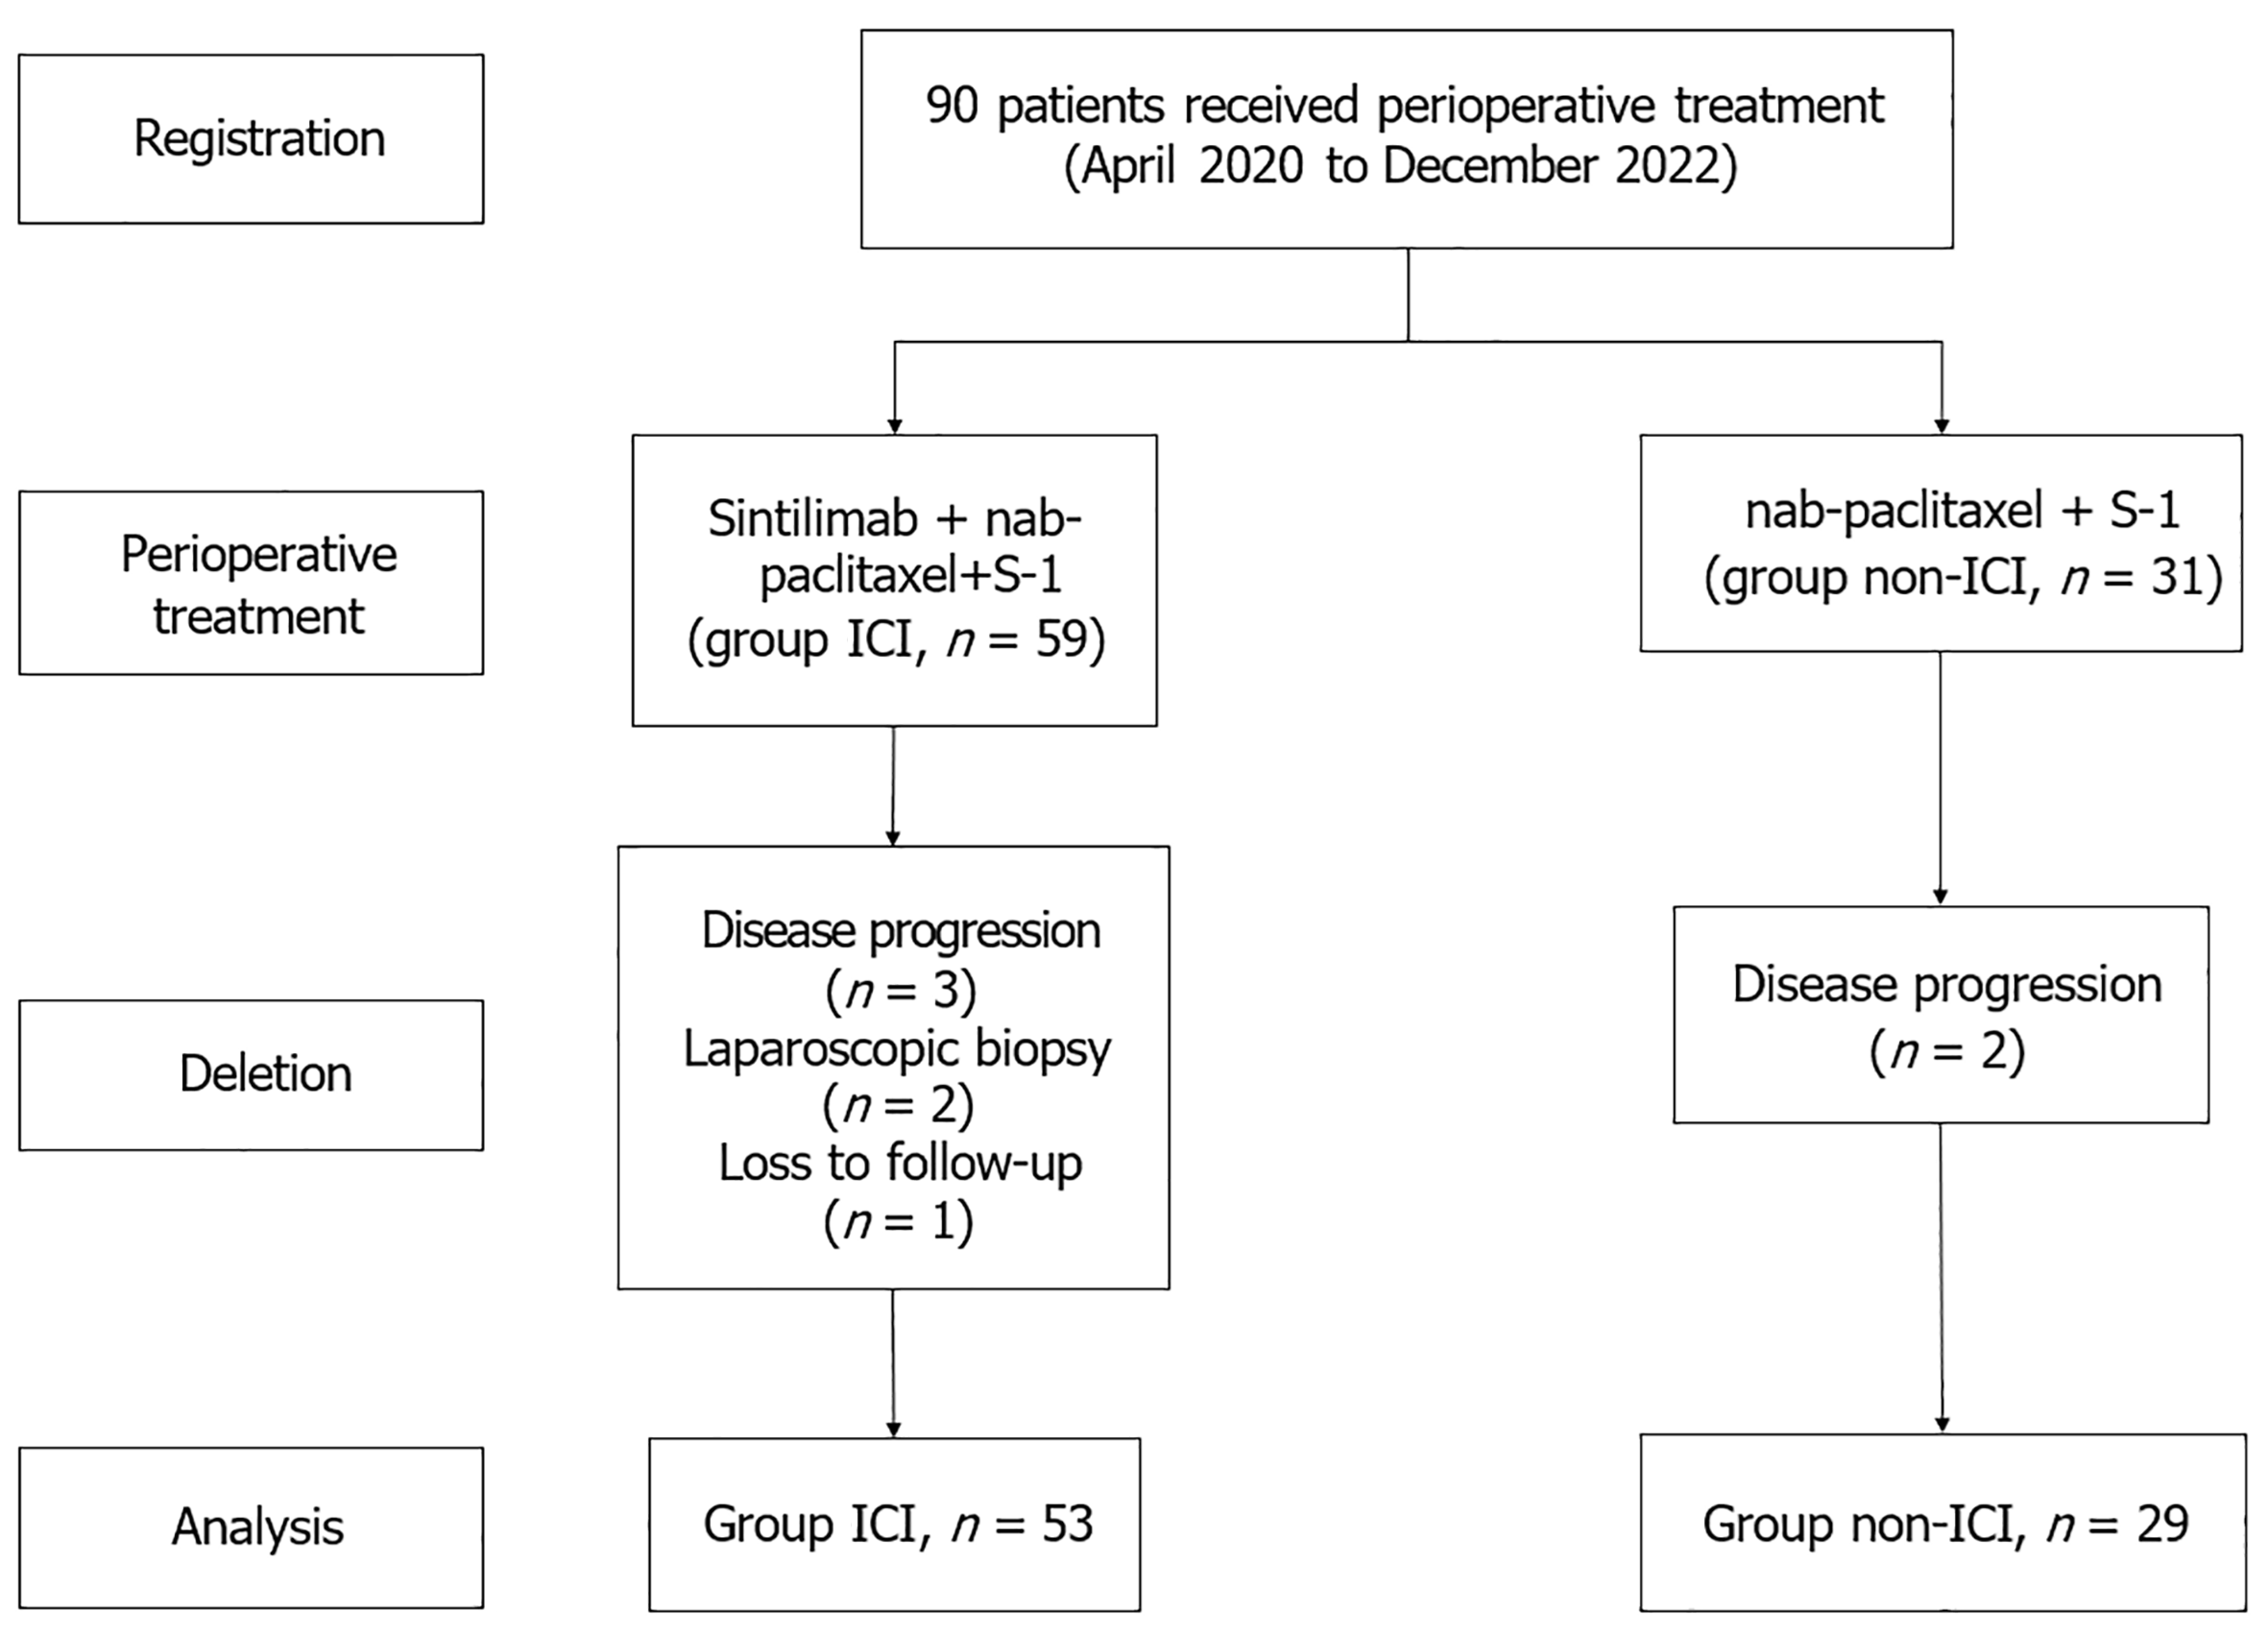
Figure 1 Flow diagram of the patient selection process.
ICI: Immune checkpoint inhibitor.
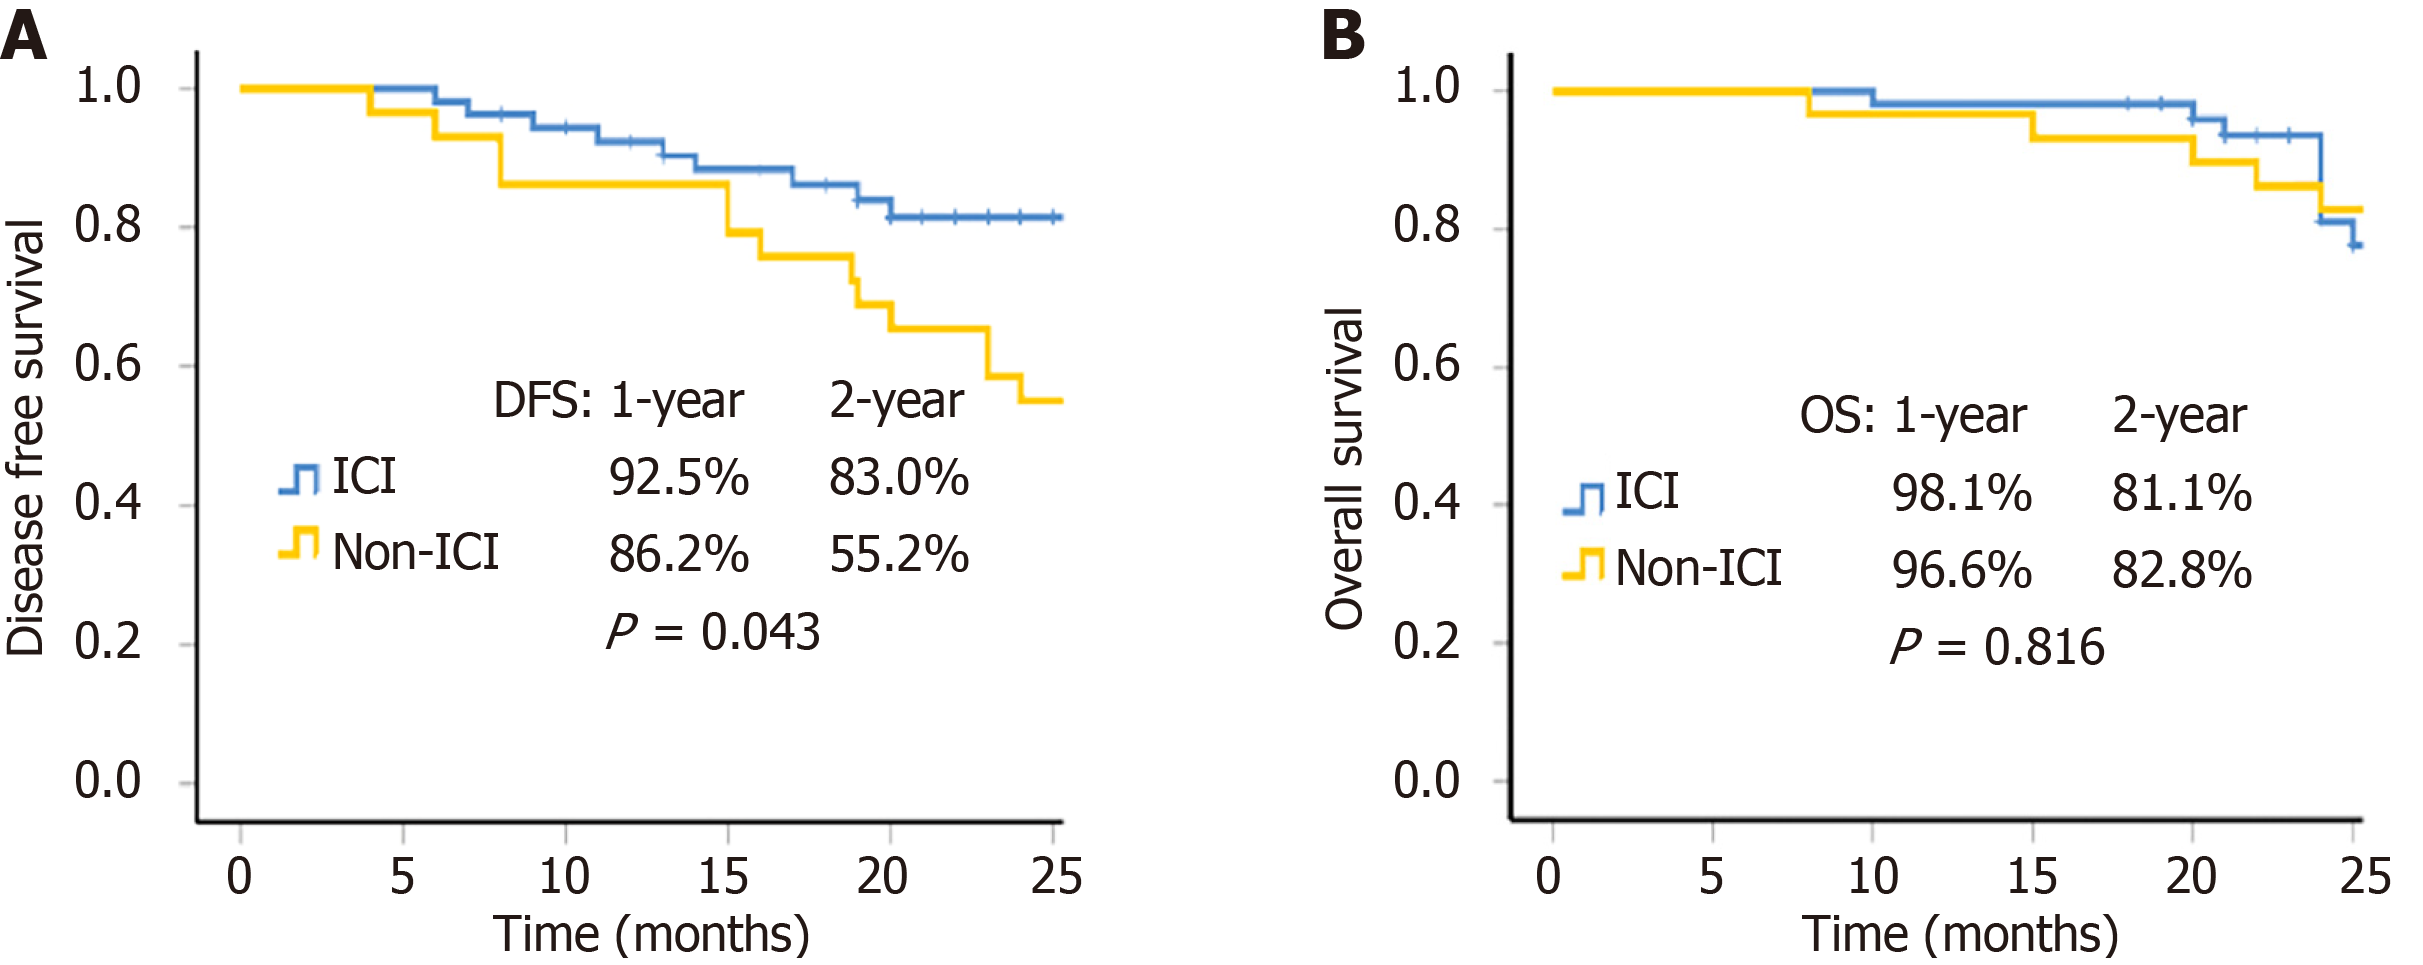
Figure 2 Survival curves.
A: Disease free survival for group immune checkpoint inhibitor (ICI) and group non-ICI (P = 0.043); B: Overall survival for group ICI and group non-ICI (P = 0.816). DFS: Disease-free survival; OS: Overall survival; ICI: Immune checkpoint inhibitor.
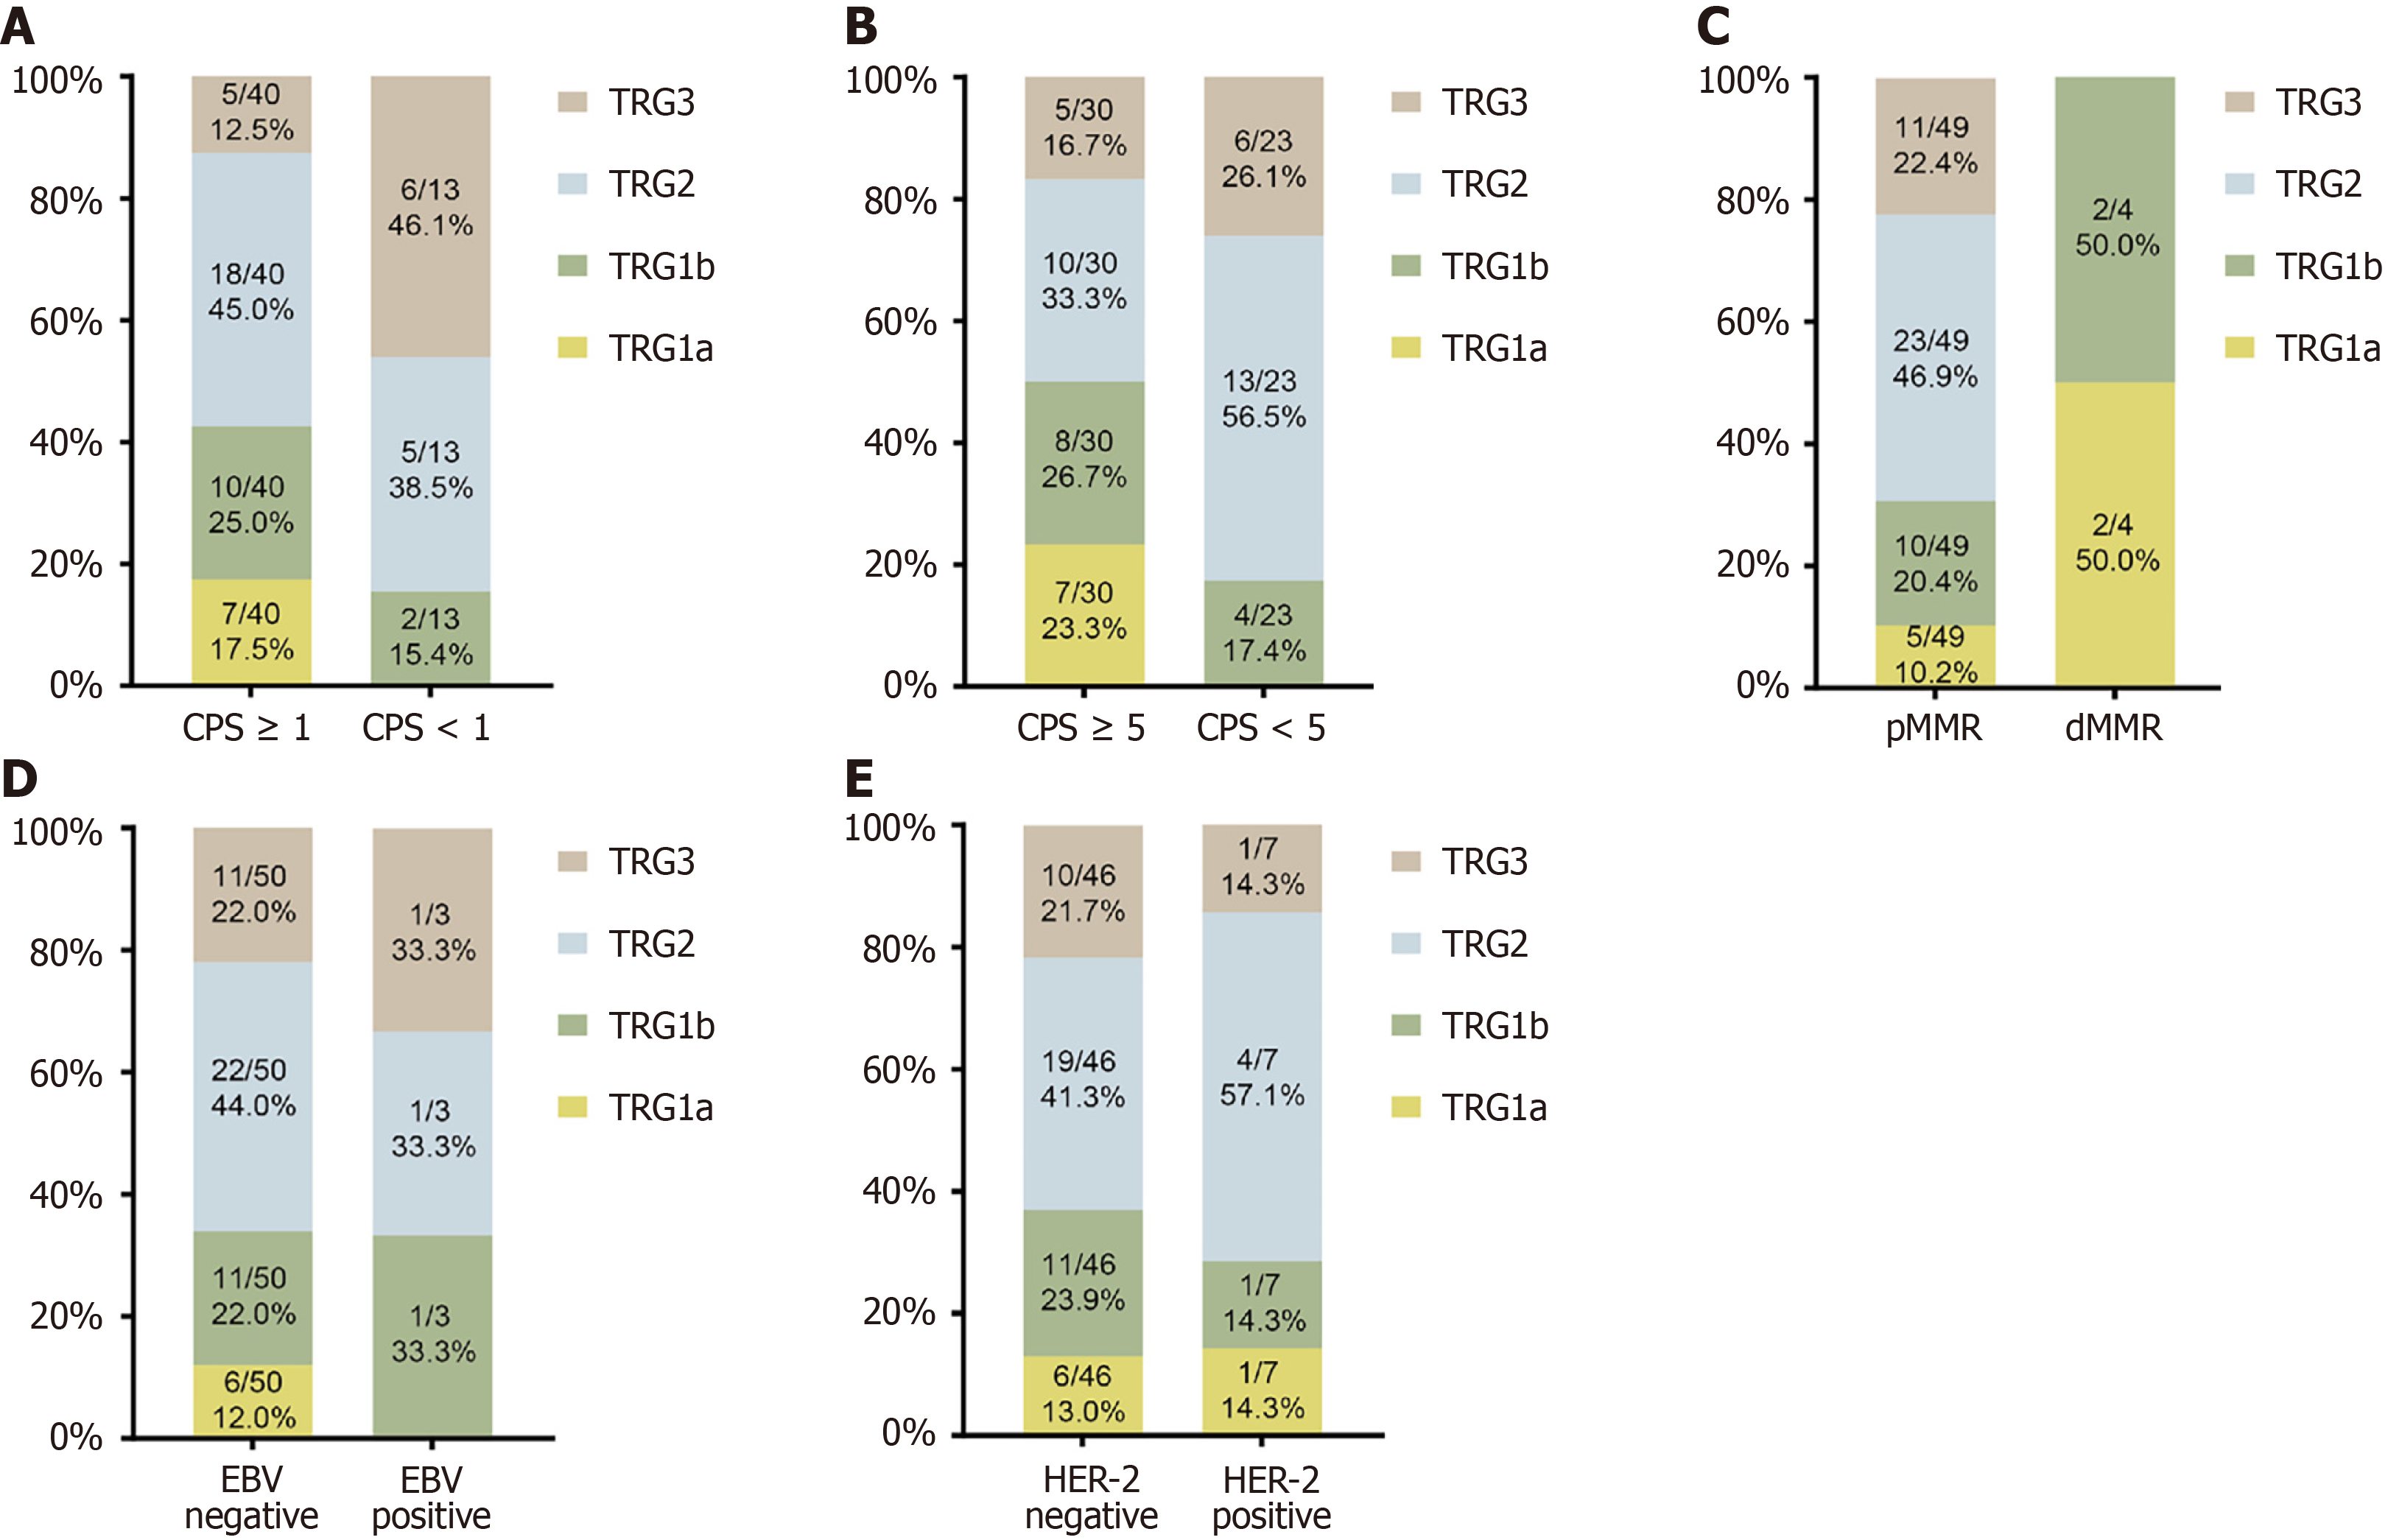
Figure 3 Immunohistochemistry.
A and B: Expression of combined positive score in group immune checkpoint inhibitor (ICI); C: Expression of mismatch repair in group ICI; D: Expression of Epstein-Barr virus in group ICI; E: Expression of human epidermal growth factor receptor 2 in group ICI. CPS: Combined positive score; TRG: Tumor regression grading; pMMR: DNA proficient mismatch repair; dMMR: DNA deficient mismatch repair; EBV: Epstein-Barr virus; HER-2: Human epidermal growth factor receptor 2.
- Citation: Chen QX, Zhang YB, Zeng WM, Cai YC, Lv CB, Lian MQ, Huang RJ, Lian MJ, Lian WL, Xu QH, Sun YQ, Cai LS. Efficacy and safety of sintilimab combined with nab-paclitaxel plus S-1 for neoadjuvant treatment of locally advanced gastric cancer. World J Gastrointest Surg 2025; 17(6): 106361
- URL: https://www.wjgnet.com/1948-9366/full/v17/i6/106361.htm
- DOI: https://dx.doi.org/10.4240/wjgs.v17.i6.106361


