Copyright
©The Author(s) 2025.
World J Gastrointest Surg. May 27, 2025; 17(5): 106000
Published online May 27, 2025. doi: 10.4240/wjgs.v17.i5.106000
Published online May 27, 2025. doi: 10.4240/wjgs.v17.i5.106000
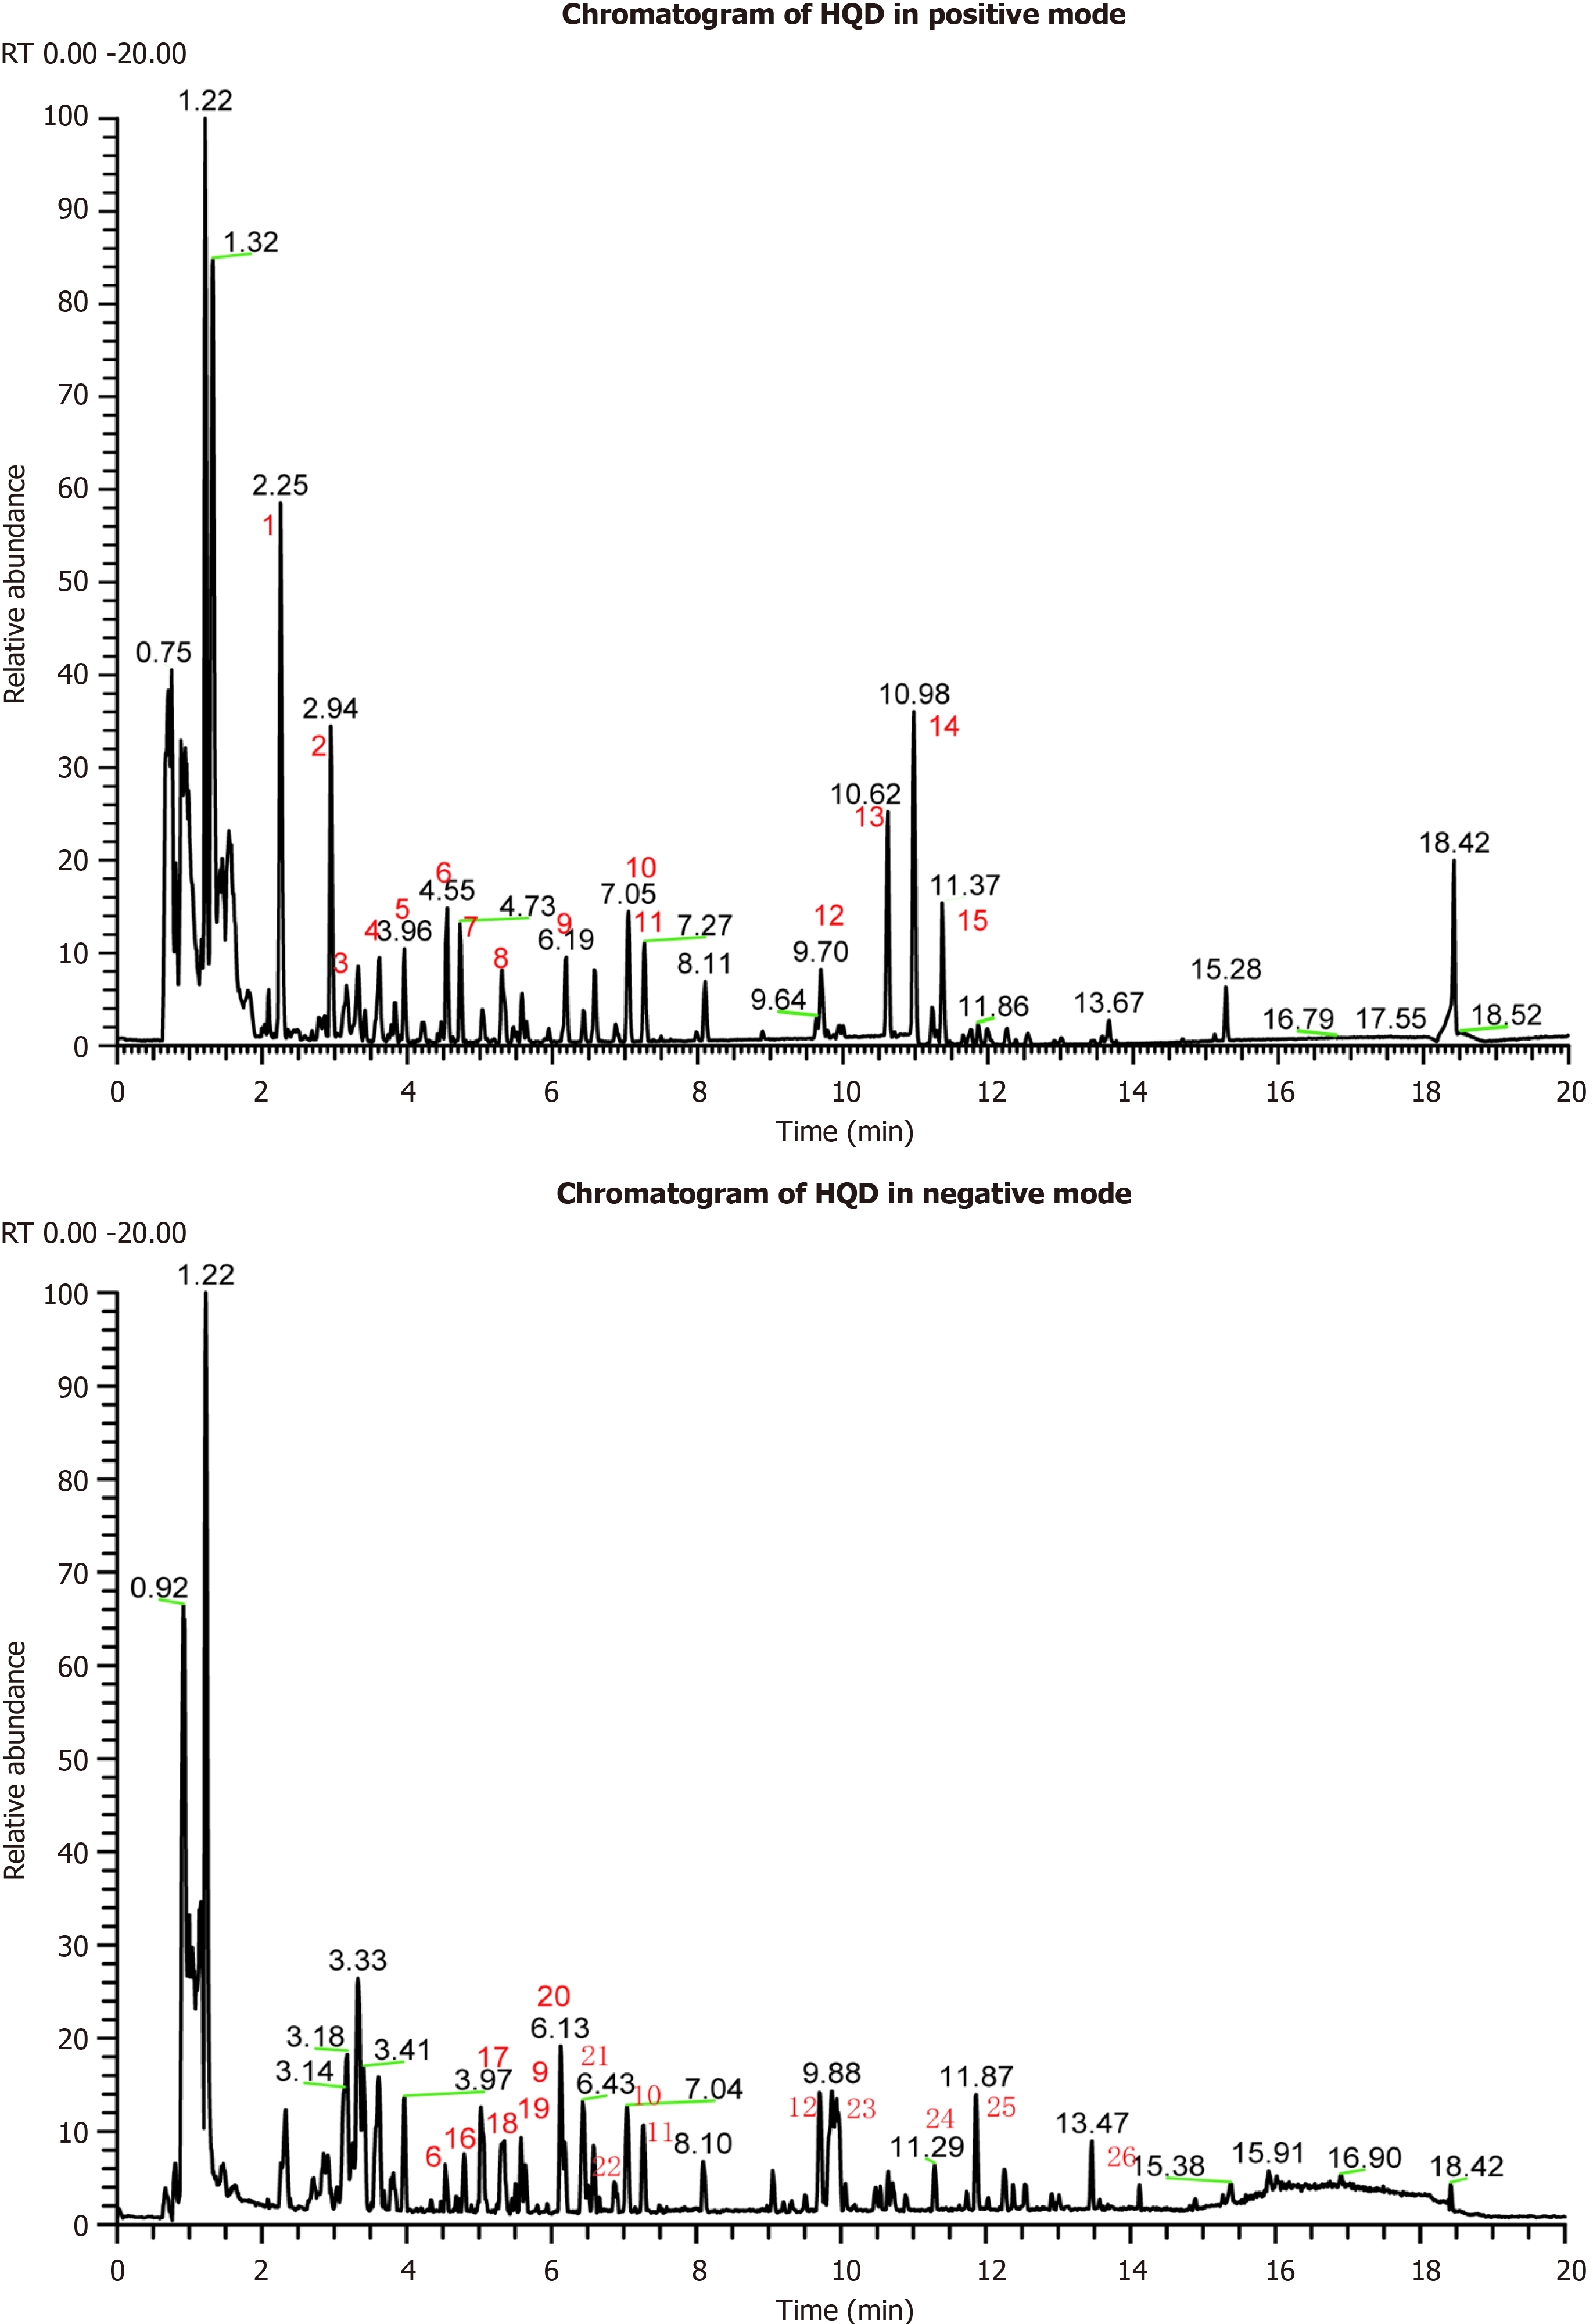
Figure 1 Liquid chromatography-mass spectrometry chromatogram of Huangqi decoction in positive mode and negative mode.
HQD: Huangqi decoction.
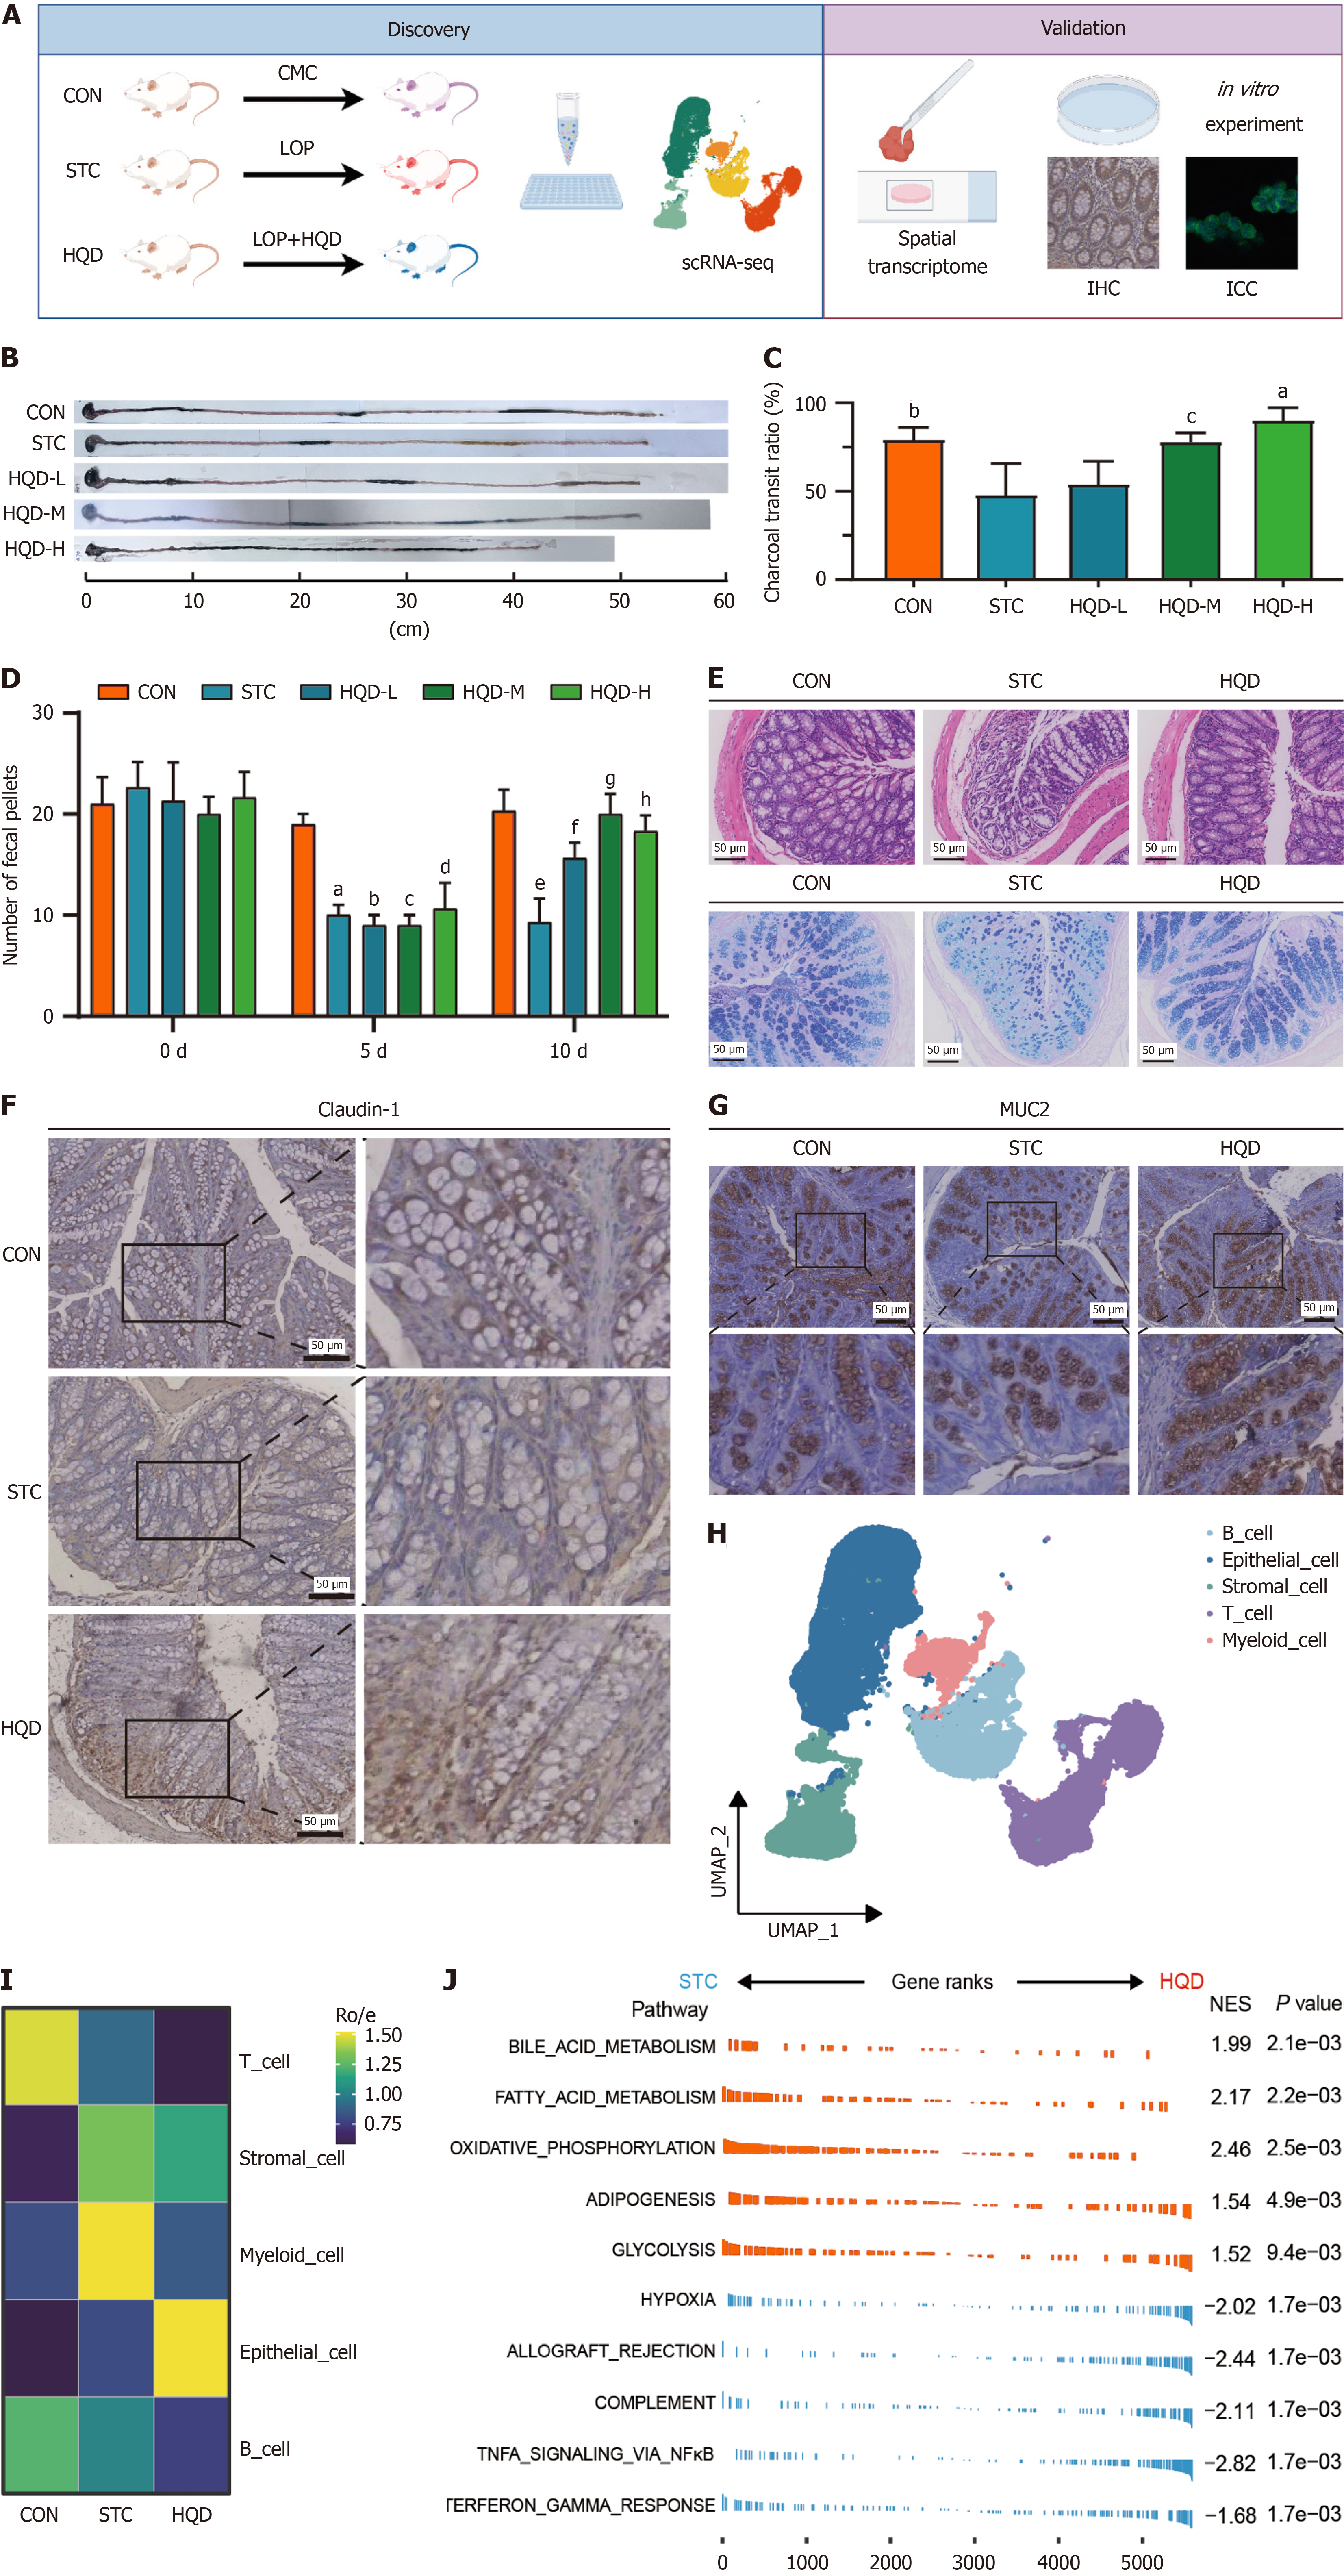
Figure 2 Huangqi decoction ameliorates defecation and intestinal barrier damage in constipation mice induced by loperamide.
A: Schematic overview of experimental design and analytical workflow. Figures generated with Figdraw; B: The effects of Huangqi decoction (HQD) treatment on intestinal charcoal transit in loperamide-induced slow transit constipation (STC) mice, scale bar 10 cm; C: The quantitative comparison of the intestinal transit charcoal ratio between the control group (CON), STC, and low, medium, and high dosage HQD groups. aP < 0.01, STC vs HQD high dose (HQD-H); bP < 0.05, STC vs CON; cP < 0.05, STC vs HQD medium dose (HQD-M); D: The quantitative comparison of the number of fecal pellets between the CON, STC, and low, medium, and high dosage HQD groups. aP < 0.001, STC vs CON (5 days); bP < 0.001, HQD low dose vs CON (5 days); cP < 0.001, HQD-M vs CON (5 days); dP < 0.001, HQD-H vs CON (5 days); eP < 0.001, STC vs CON (10 days); fP < 0.01, HQD low dose vs CON (10 days); gP < 0.001, HQD-M vs CON (10 days); hP < 0.001, HQD-H vs CON (10 days); E: Top: Representative images of hematoxylin and eosin staining colon mucosa of mice in CON, STC, and HQD group were shown. Bottom: Representative images of Alcian blue-periodic acid-Schiff staining colon mucosa of mice in CON, STC, and HQD group were shown. The black scale bar represents 50 μm; F: Representative images of the immunohistochemical expression levels of caudin-1 in the colonic mucosa of mice from the CON, STC, and HQD groups were shown. The black scale bar represents 50 μm; G: Representative images of the immunohistochemical expression levels of mucin 2 in the colonic mucosa of mice from the CON, STC, and HQD groups were shown. The black scale bar represents 50 μm; H: Uniform manifold approximation and projection plot of the major cell types from the mice colon tissue of the CON, STC, and HQD groups; I: Heatmap shows tissue distribution of cell types based on single-cell RNA sequencing data. Ro/e denotes the ratio of observed to expected cell number; J: Gene set enrichment analysis enrichment for gene sets in all cells comparing STC vs HQD group. CON: Control group; STC: Group of slow transit constipation model; HQD: Groups of treatment of Huangqi decoction; LOP: Loperamide; CMC: Carboxymethyl cellulose sodium; IHC: immunohistochemistry; ICC: Immunocytochemistry; HQD-L: HQD low dose; HQD-M: HQD medium dose; HQD-H: HQD high dose; NES: Normalize enrichment score.
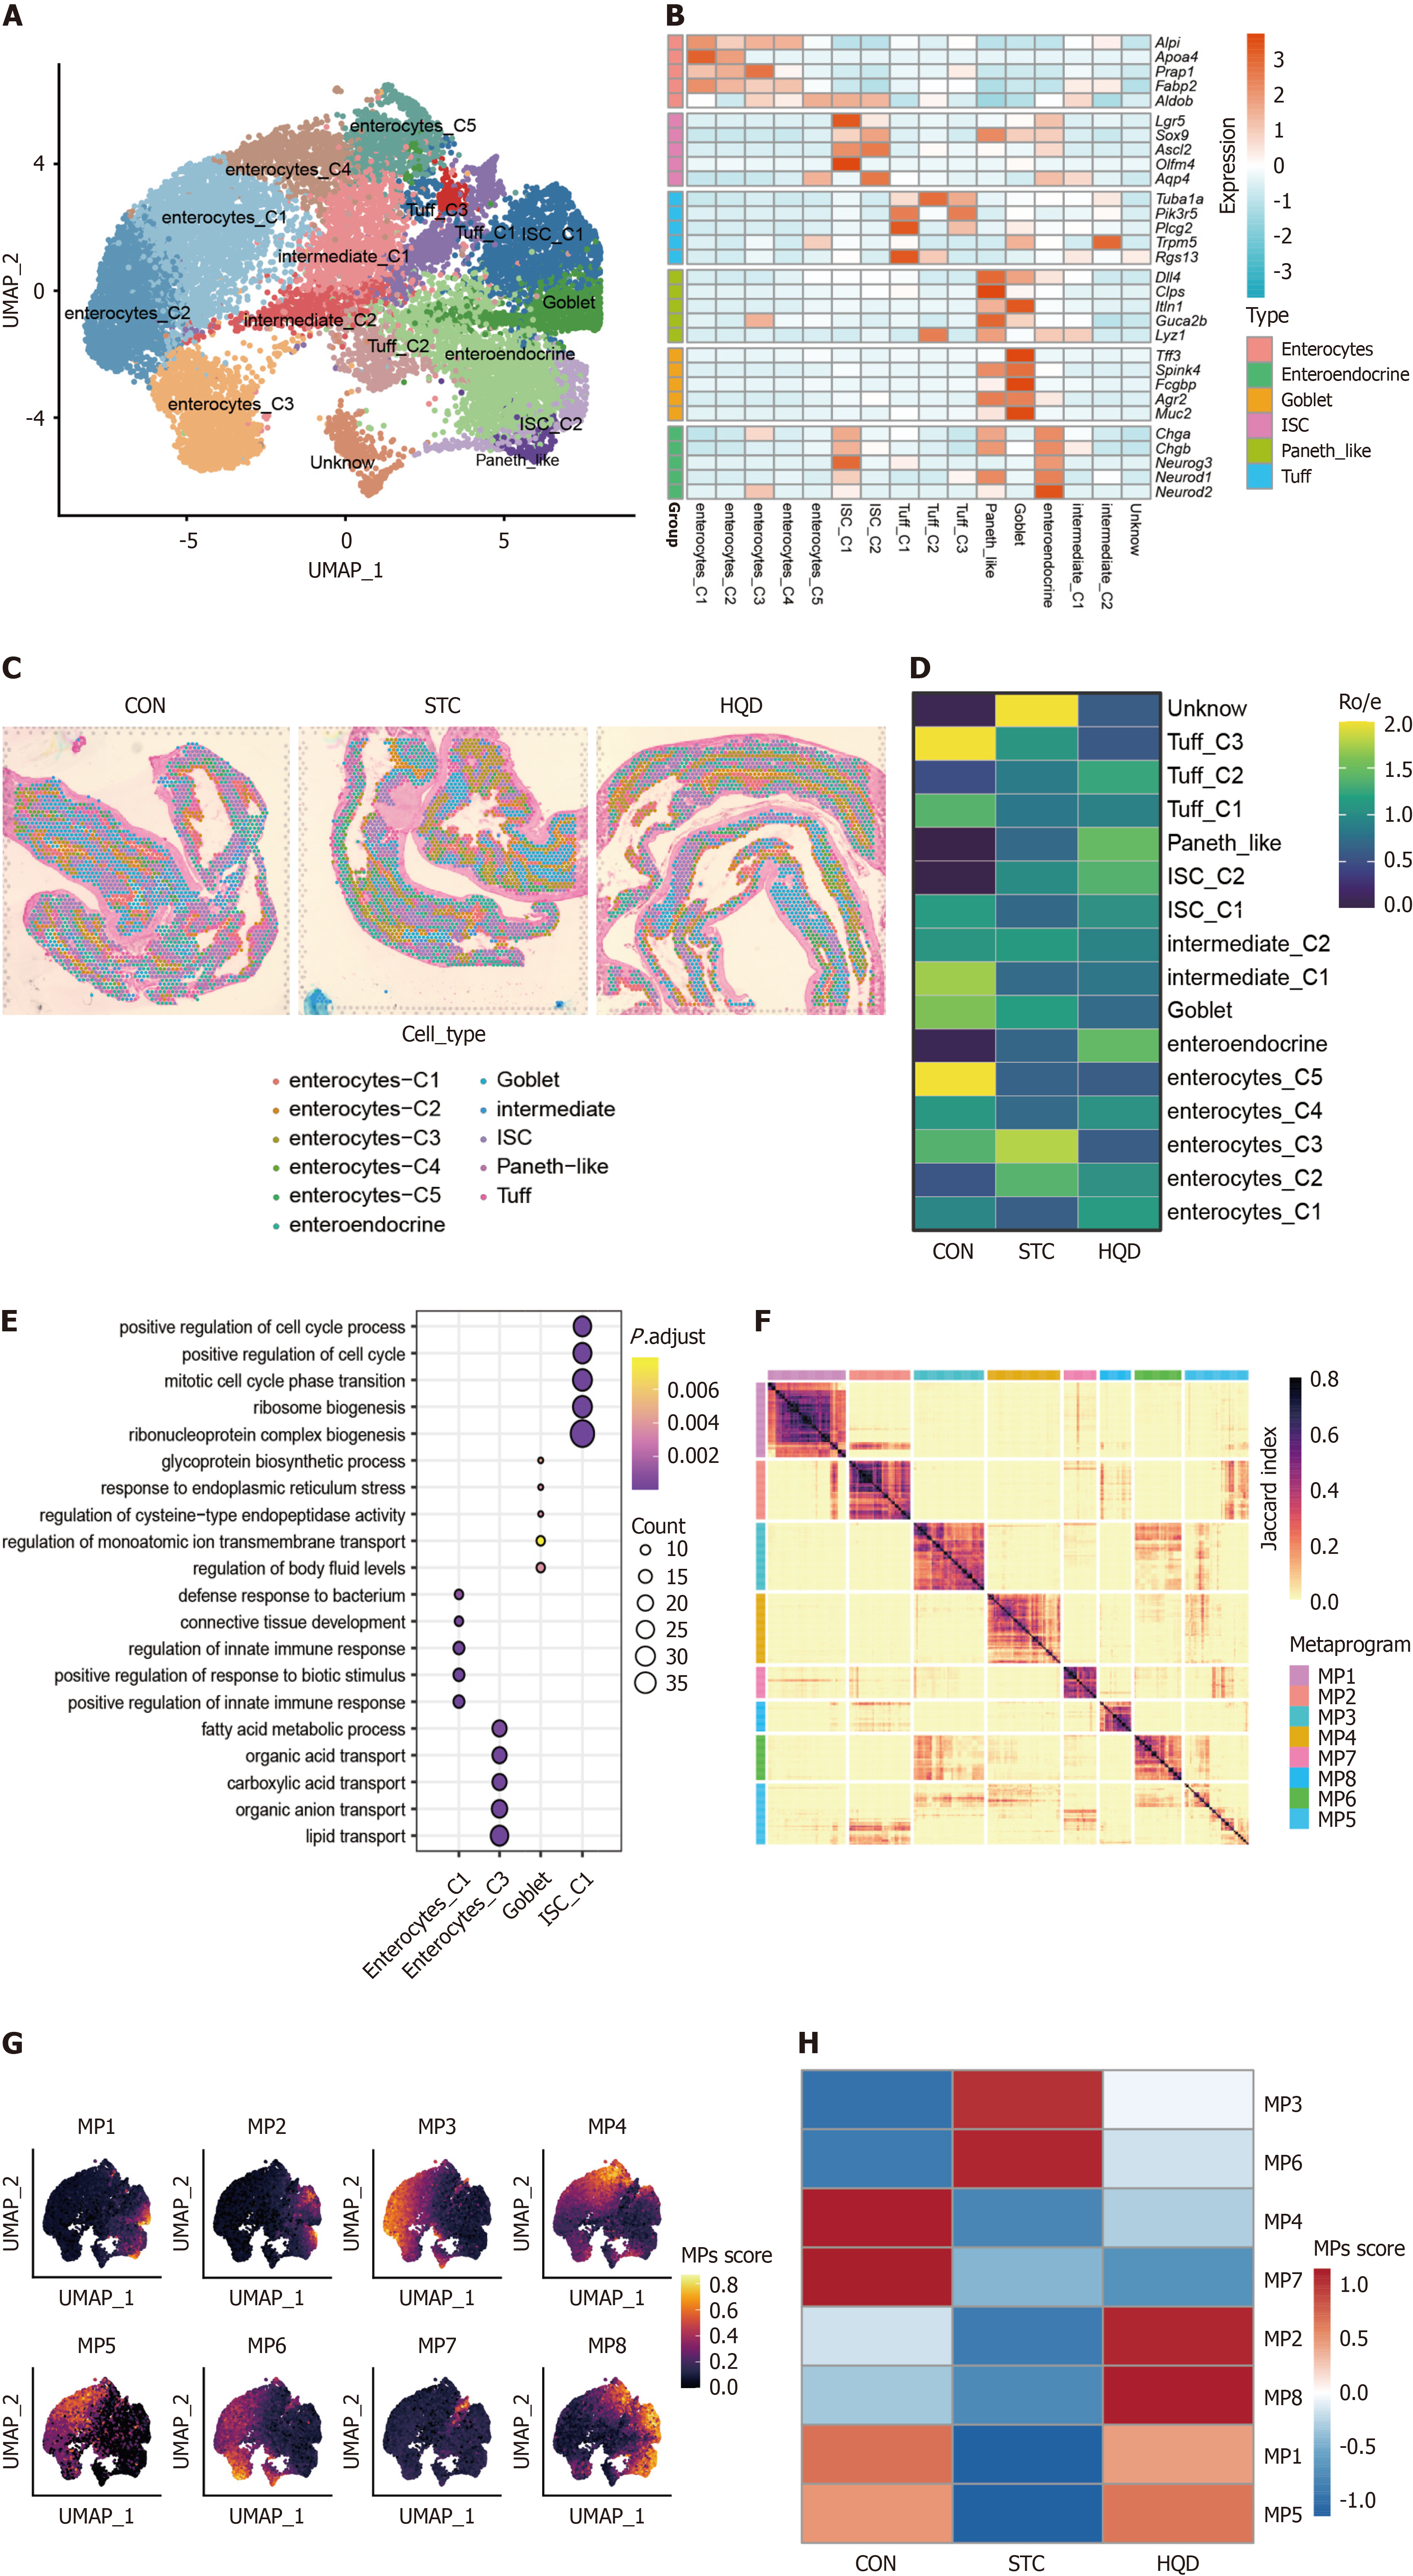
Figure 3 The protective effects of Huangqi decoction on the colon mucosal epithelium in slow transit constipation mice.
A: Uniform manifold approximation and projection plot of the epithelial cell subtypes; B: The expression of the classical marker genes of epithelial cells; C: The cell distribution of the epithelial subtypes in spatial transcriptome sequencing data. There are three spatial transcriptome sequencing samples from control, slow transit constipation, and Huangqi decoction groups; D: Heatmap shows tissue distribution of epithelial cell subtypes based on single-cell RNA sequencing data. Ro/e denotes the ratio of observed to expected cell number; E: Gene ontology enrichment (biological processes) of the epithelial cell subtypes based on differentially expressed genes; F: Hierarchical clustering of pairwise similarities between non-negative matrix factorization programs identified across from all epithelial cells. Similarities between non-negative matrix factorization programs were quantified by Jaccard index over the programs’ signature genes; G: Uniform manifold approximation and projection plots of epithelial cells colored by the signature scores of each metaprogram; H: The heatmap displays the metaprogram scores of epithelial cells among the control, slow transit constipation, and Huangqi decoction groups. CON: Control group; STC: Group of slow transit constipation model; HQD: Groups of treatment of Huangqi decoction; UMAP: Uniform manifold approximation and projection; ISC: Intestinal stem cells; MP: Metaprogram.
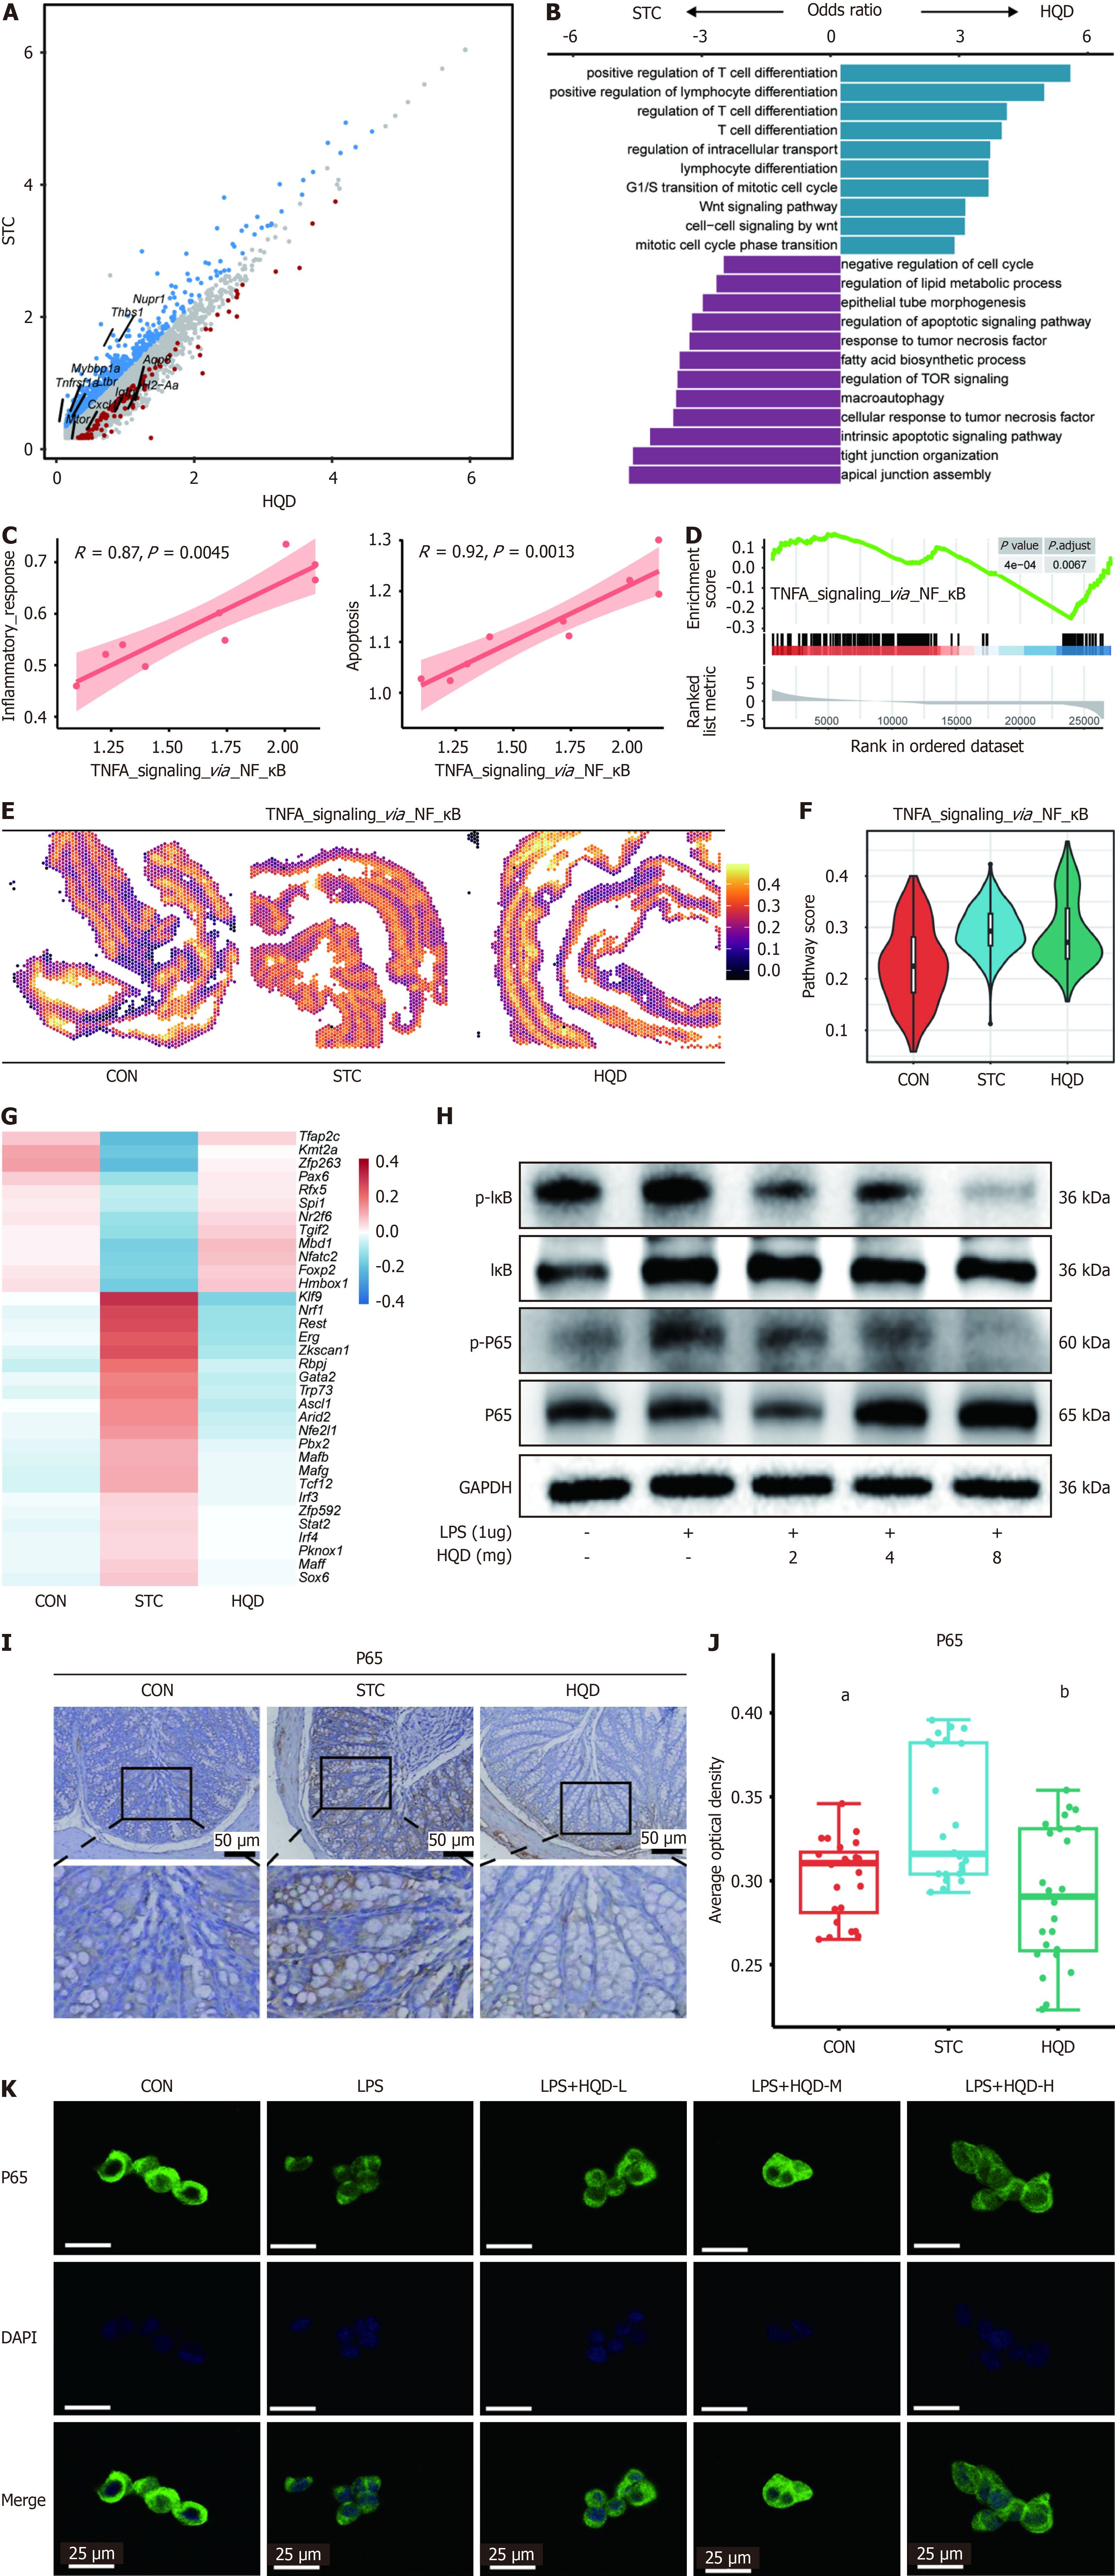
Figure 4 Huangqi decoction treatment inhibited inflammation-related nuclear factor κB pathway and apoptosis in goblet cells.
A: Differentially expressed genes (DEGs) of goblet cells between slow transit constipation (STC) and Huangqi decoction (HQD) group. Blue dot: DEGs in STC group; Red dot: DEGs in HQD group. DEGs were defined as those with a P value < 0.05 from the Wilcoxon rank sum test and a log2 fold change > 0.25; B: Gene ontology enrichment in goblet cells in STC and HQD groups. Odds ratio = gene ratio/background ratio; C: Scatterplot shows the correlation between inflammatory response and apoptosis pathway and nuclear factor κB (NF-κB) pathways in the goblet cells; D: Gene set enrichment analysis comparing transcriptomic profiles of goblet cells in STC and HQD group, with positive scores indicating enrichment in the HQD group, and negative scores indicating enrichment in the STC group; E: Spatial expression of the tumor necrosis factor alpha signaling via NF-κB pathway in epithelial cell regions of a control (CON) sample (left), an STC sample (middle), and an HQD sample (right); F: Violin plots showing the tumor necrosis factor alpha signaling via NF-κB pathway score in goblet cells regions from three spatial transcriptome sequencing samples; G: The heatmap shows the top transcription factors with the highest variability in scores for each group; H: Western blot analysis of p-IκB alpha, total IκB alpha, p-NF-κB P65, total NF-κB P65 in the LS174T cells with the treatment of HQD; I: Representative images of the immunohistochemical expression levels of NF-κB P65 in the colonic mucosa of mice from the CON, STC, and HQD groups were shown. The black scale bar represents 50 μm; J: Comparison of the average optical density of NF-κB P65 between the CON, STC, and HQD groups. aP < 0.05, STC vs CON; bP < 0.01, STC vs HQD; K: Immunocytochemistry imaging showed the nuclear translocation of NF-κB P65 subunit of NF-κB in LS174T cell. White scale bar represents 25 μm. CON: Control group; STC: Group of slow transit constipation model; HQD: Groups of treatment of Huangqi decoction; LPS: Lipopolysaccharide; TNFA: Tumor necrosis factor alpha; GAPDH: Glyceraldehyde-3-phosphate dehydrogenase; HQD-L: HQD low dose; HQD-M: HQD medium dose; HQD-H: HQD high dose.
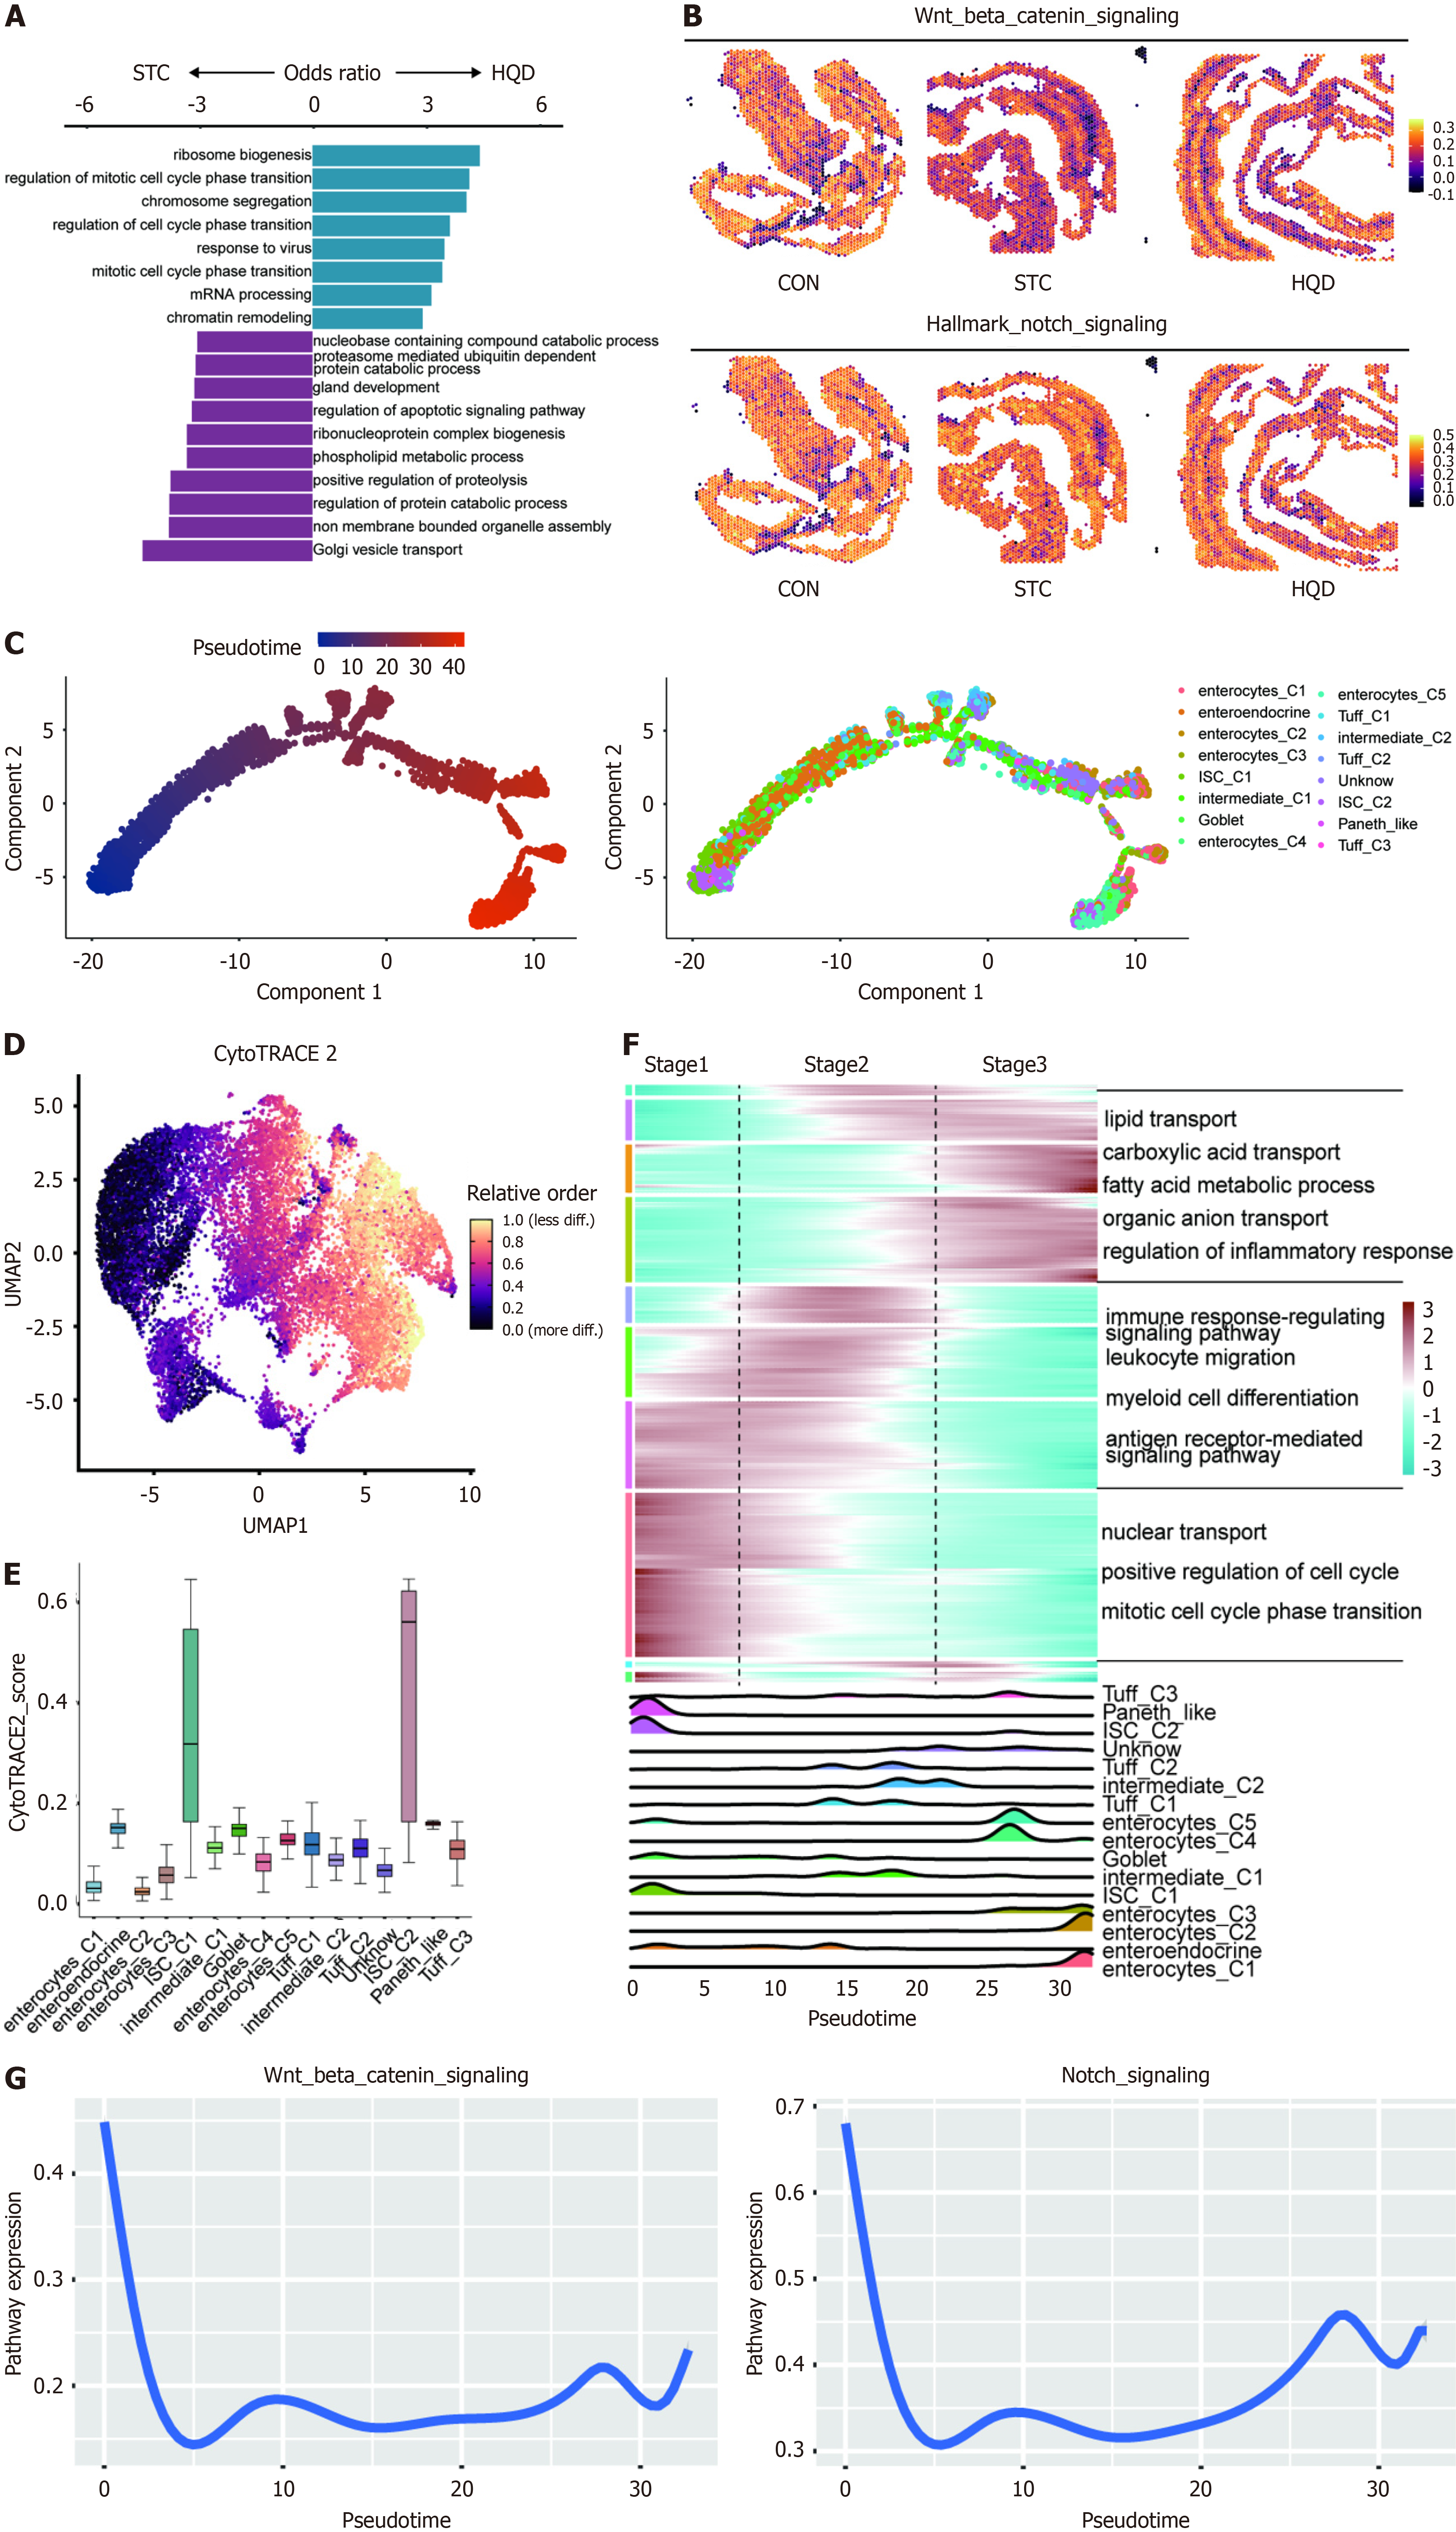
Figure 5 Huangqi decoction treatment regulates the proliferation and differentiation of intestinal stem cells.
A: Gene ontology enrichment in ISC_C1 cells between slow transit constipation and Huangqi decoction groups. Odds ratio = gene ratio/background ratio; B: Spatial expression of the Wnt beta catenin signaling and hallmark Notch signaling pathway in epithelial cell regions of a control sample (left), a slow transit constipation sample (middle), and an Huangqi decoction sample (right); C: Pseudotime trajectory analysis of epithelial cells. Left: Trajectory is colored by pseudotime; Right: Trajectory is colored by epithelial cell subtypes; D: The uniform manifold approximation and projection visualization demonstrates CytoTRACE scores across epithelial cell subtypes, with their clustering patterns detailed in Figure 3A; E: Distribution of CytoTRACE scores among epithelial cell subtypes; F: Heatmap showing the dynamic changes in variable gene expression along the pseudotime (top). The distribution of epithelial subtypes during the transition, along with the pseudo-time (bottom). Subtypes are labeled by colors. Gene ontology enrichment was performed by variable genes; G: Smooth curves show changes of the Wnt beta catenin signaling and Notch signaling pathways expression in epithelial cell. CON: Control group; STC: Group of slow transit constipation model; HQD: Groups of treatment of Huangqi decoction; UMAP: Uniform manifold approximation and projection; ISC: Intestinal stem cell.
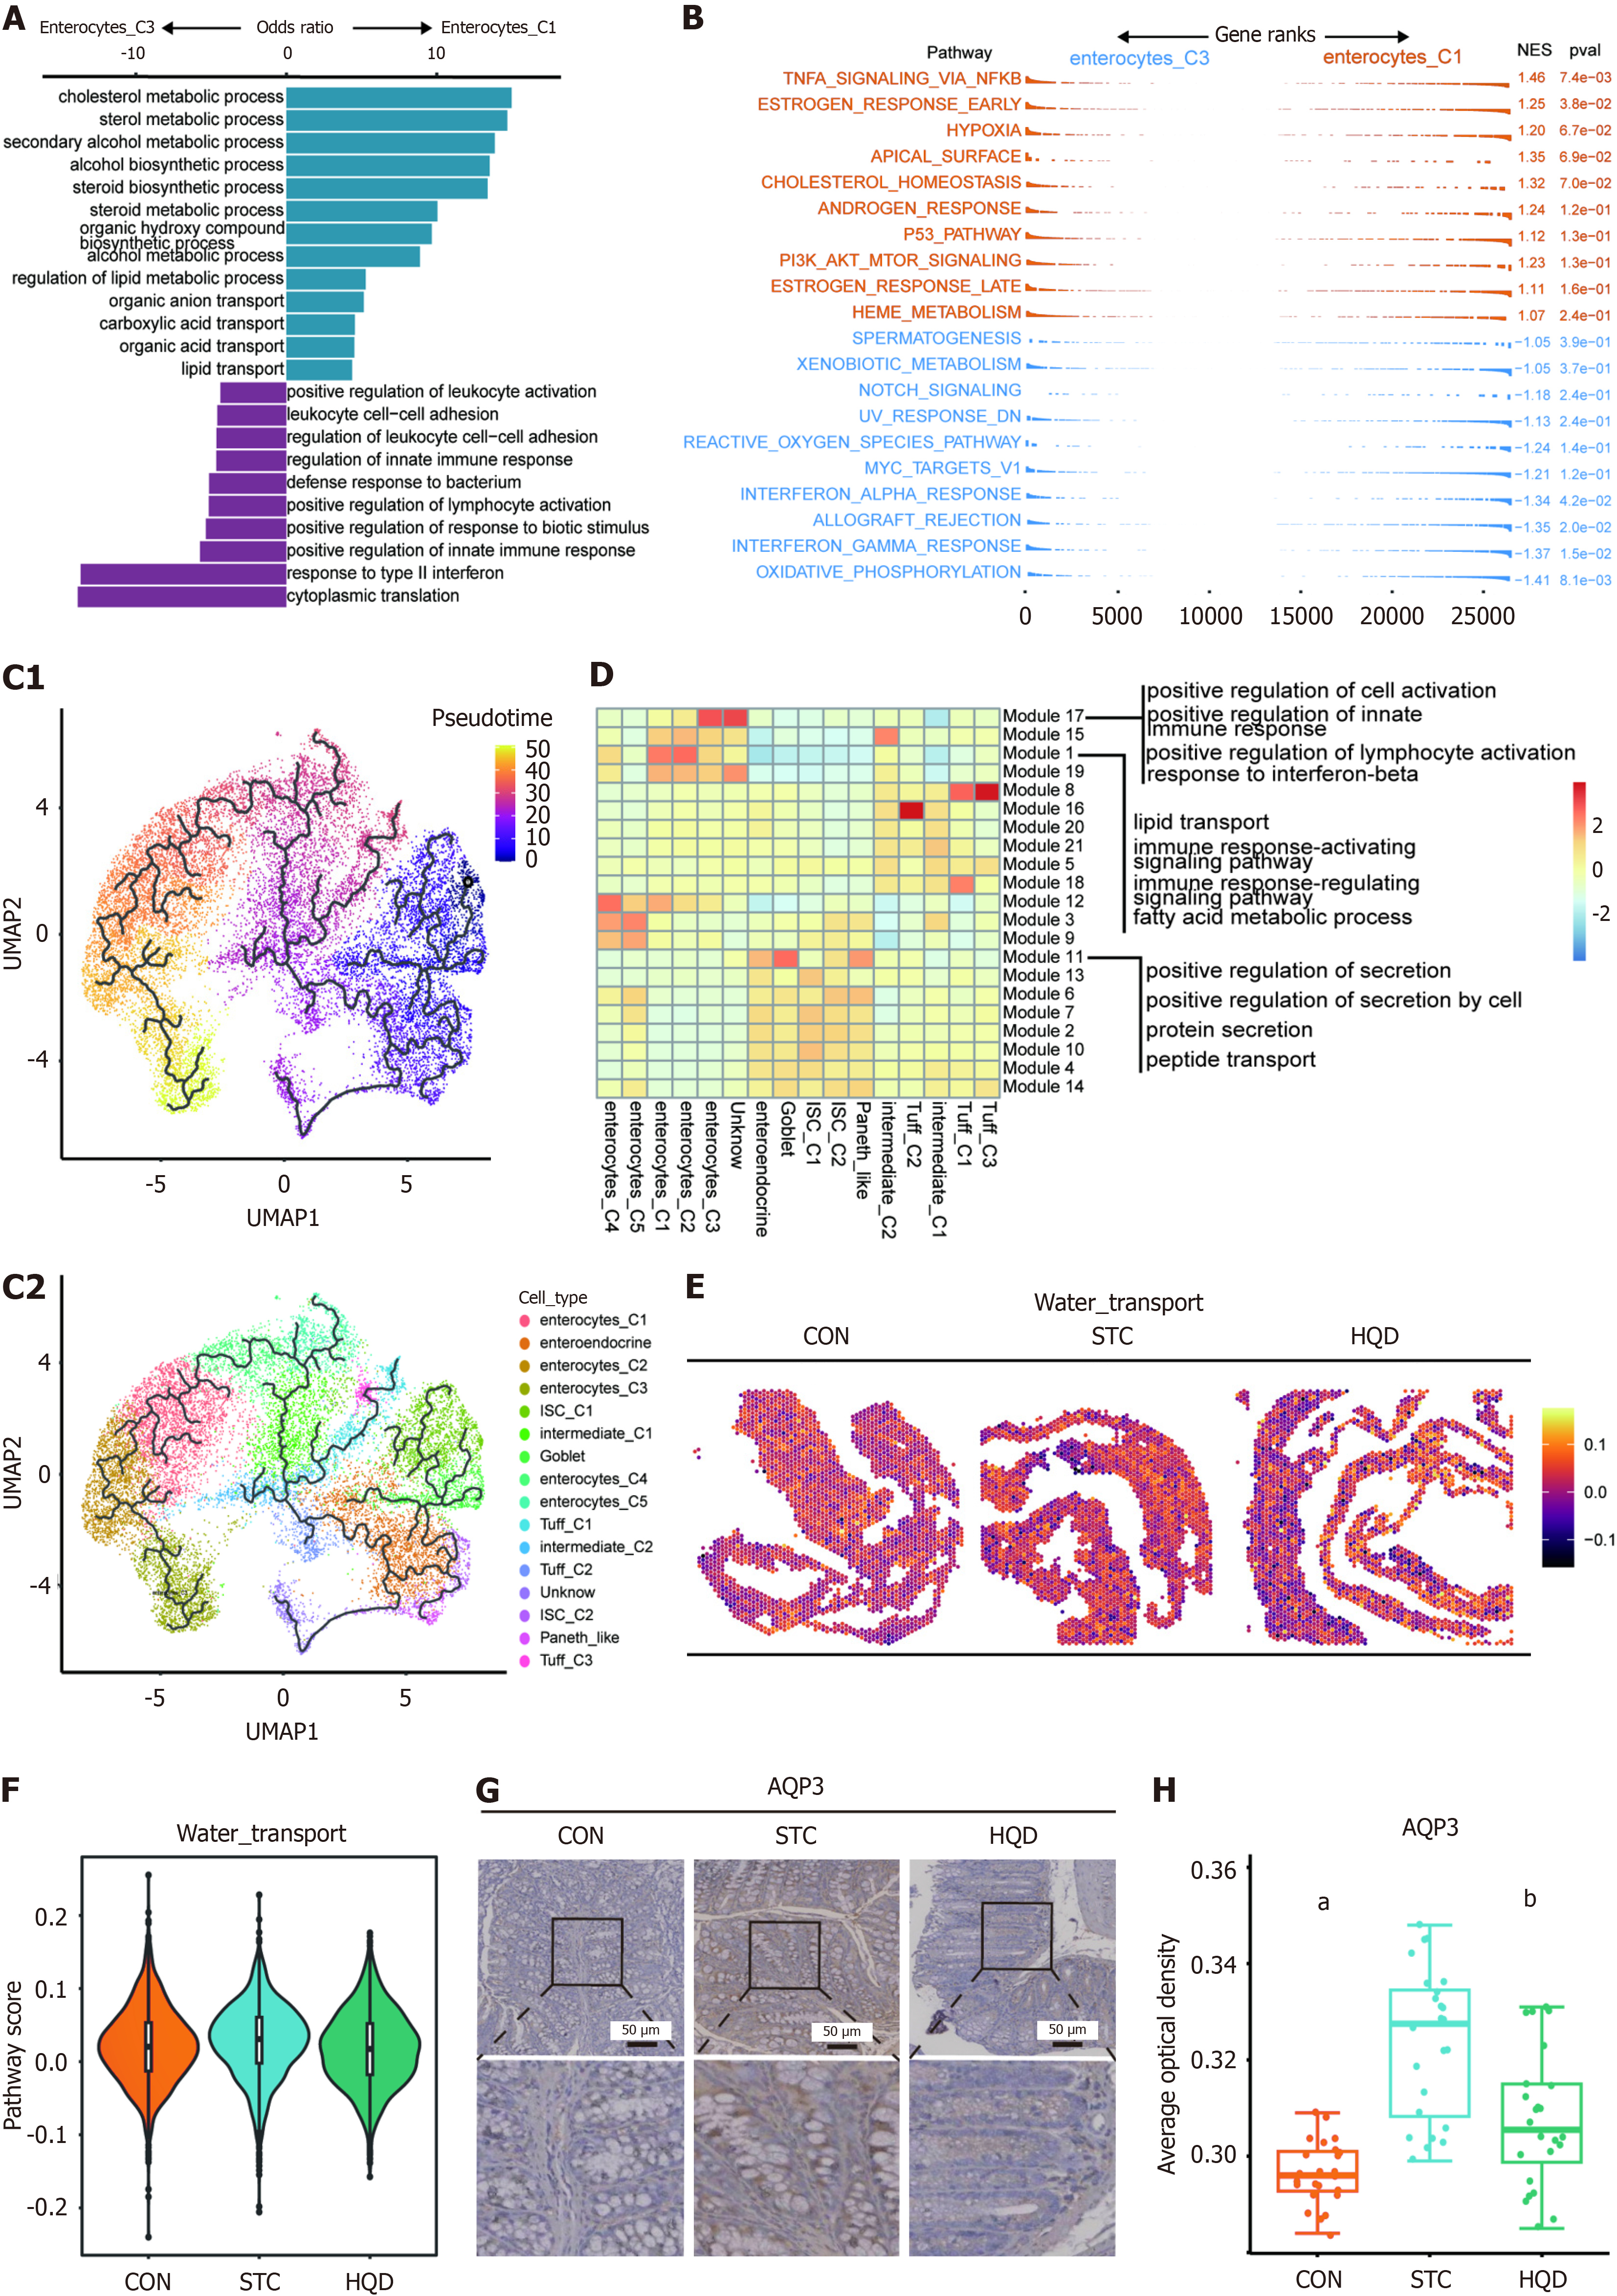
Figure 6 Functional Heterogeneity of Enterocyte_C1 and Enterocyte_C3.
A: Gene ontology enrichment in Enterocyte_C1 cells and Enterocyte_C3 cells. Odds ratio = gene ratio/background ratio; B: Gene set enrichment analysis enrichment for gene sets comparing Enterocyte_C1 vs Enterocyte_C3; C: Pseudotime reconstruction and developmental trajectory of epithelial cells inferred by Monocle 3 cells are colored by pseudotime (top). Cells are colored by epithelial subtype (bottom); D: Heatmap shows the expression of gene modules from Monocle 3; E: Spatial expression of the water transport pathway in epithelial cell regions of a control (CON) sample (left), an slow transit constipation (STC) sample (middle), and an Huangqi decoction (HQD) sample (right); F: Violin plots showing the water transport pathway score in all epithelial cells’ regions from three spatial transcriptome sequencing samples; G: Representative images of the immunohistochemical expression levels of aquaporin 3 in the colonic mucosa of mice from the CON, STC, and HQD groups were shown. The black scale bar represents 50 μm; H: Comparison of the average optical density of aquaporin 3 in mice between the CON, STC, and HQD groups. aP < 0.001, STC vs CON; bP < 0.05, STC vs HQD. NES: Normalize enrichment score; UMAP: Uniform manifold approximation and projection; ISC: Intestinal stem cell; CON: Control group; STC: Group of slow transit constipation model; HQD: Groups of treatment of Huangqi decoction; AQP3: Aquaporin 3.
- Citation: Chen HX, Xiao GZ, Yang CX, Zheng YH, Lei MY, Xu H, Ren DL, Huang L, He QL, Lin HC. Huangqi decoction ameliorated intestinal barrier dysfunction via regulating NF-κB signaling pathway in slow transit constipation model mice. World J Gastrointest Surg 2025; 17(5): 106000
- URL: https://www.wjgnet.com/1948-9366/full/v17/i5/106000.htm
- DOI: https://dx.doi.org/10.4240/wjgs.v17.i5.106000


