Copyright
©The Author(s) 2025.
World J Gastrointest Surg. May 27, 2025; 17(5): 104728
Published online May 27, 2025. doi: 10.4240/wjgs.v17.i5.104728
Published online May 27, 2025. doi: 10.4240/wjgs.v17.i5.104728
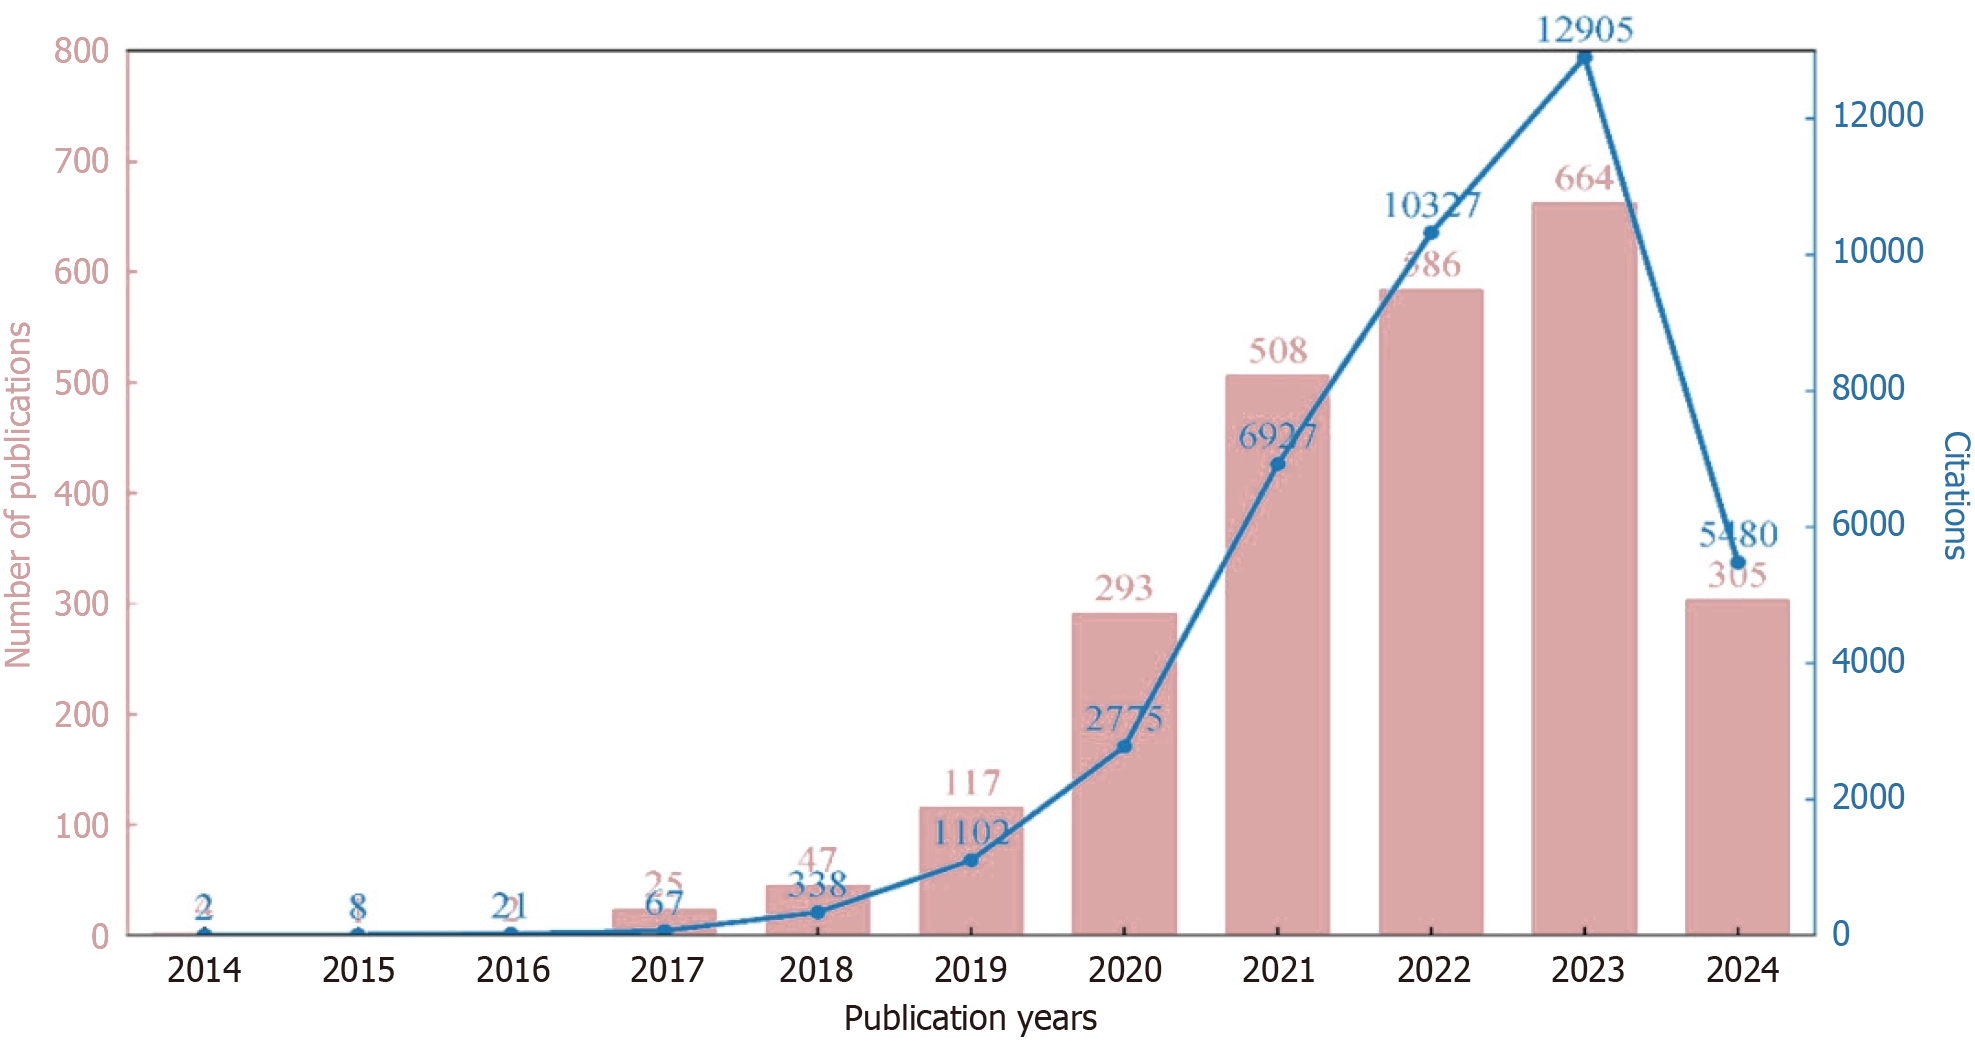
Figure 1
Number of publications from 2014 to 2024.
Figure 2 Collaboration network maps of countries/regions.
A: Hot spot distribution; B: Time distribution.
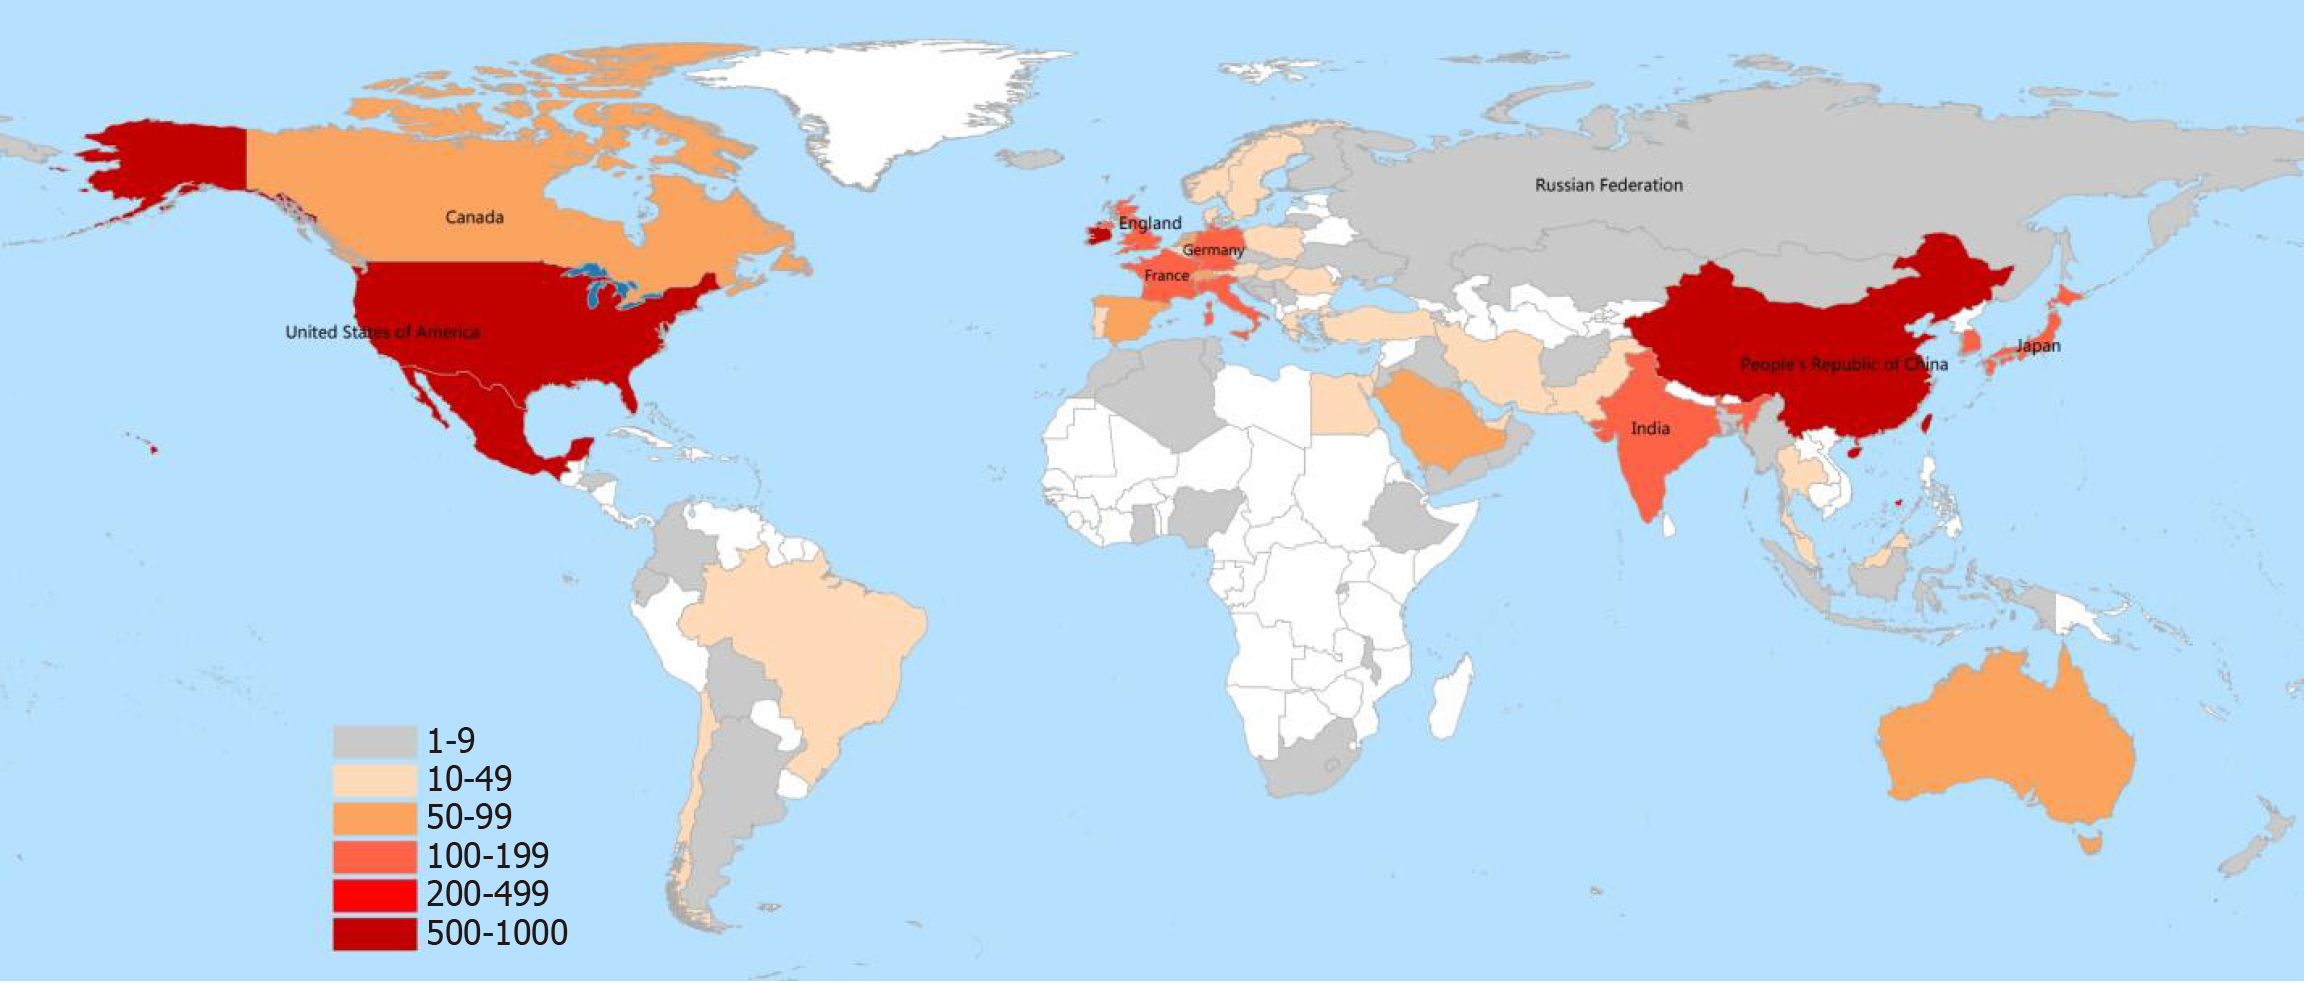
Figure 3
World distribution of published papers in this field.
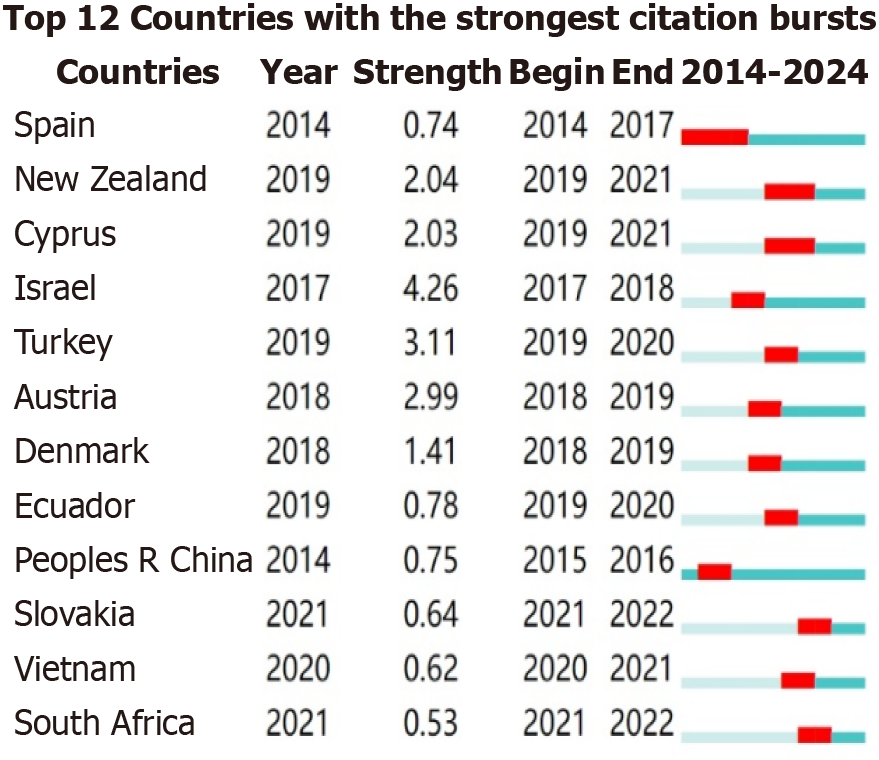
Figure 4
Burst figure of countries/regions.
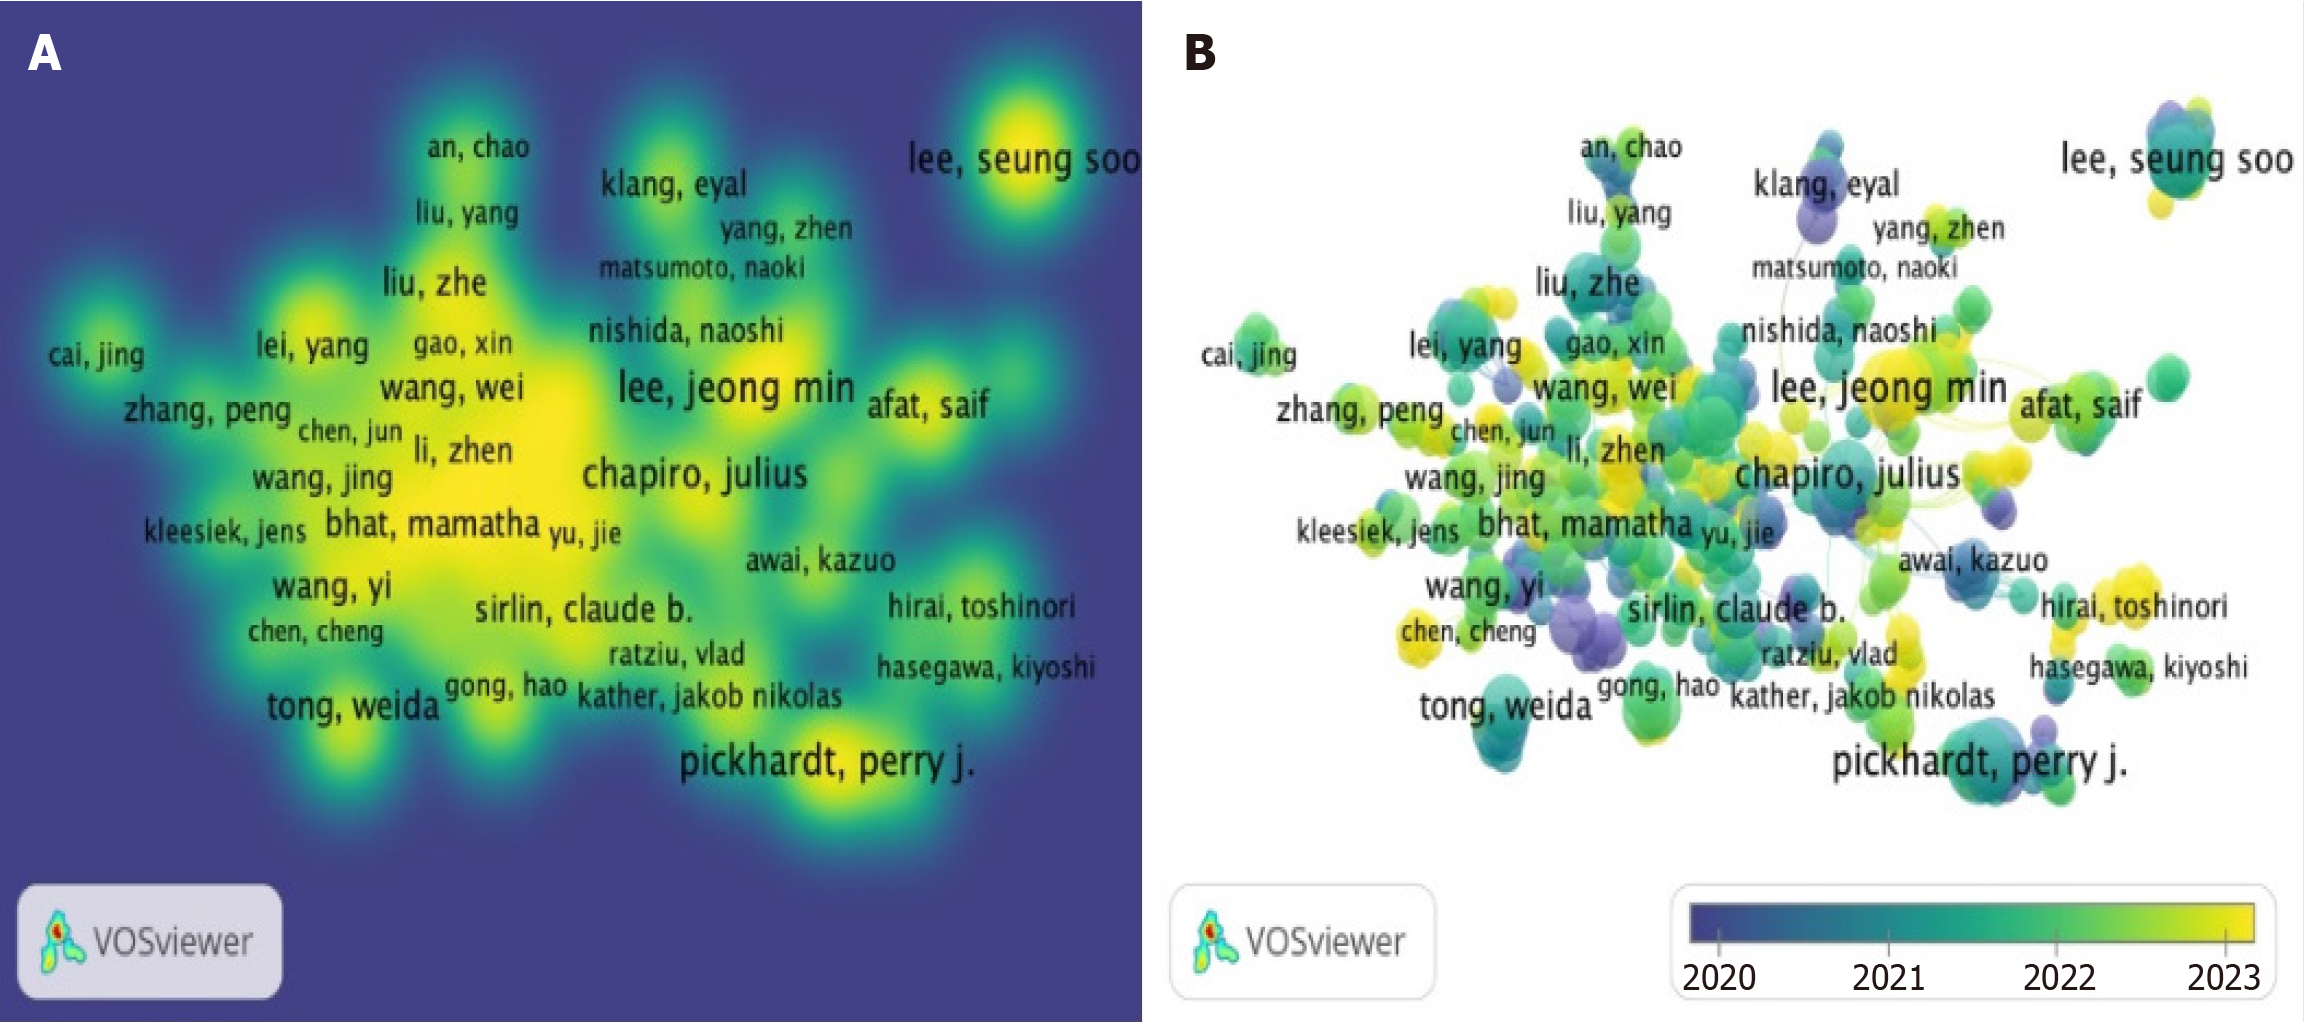
Figure 5 Collaboration network figures of authors.
A: Hot spot distribution; B: Time distribution.
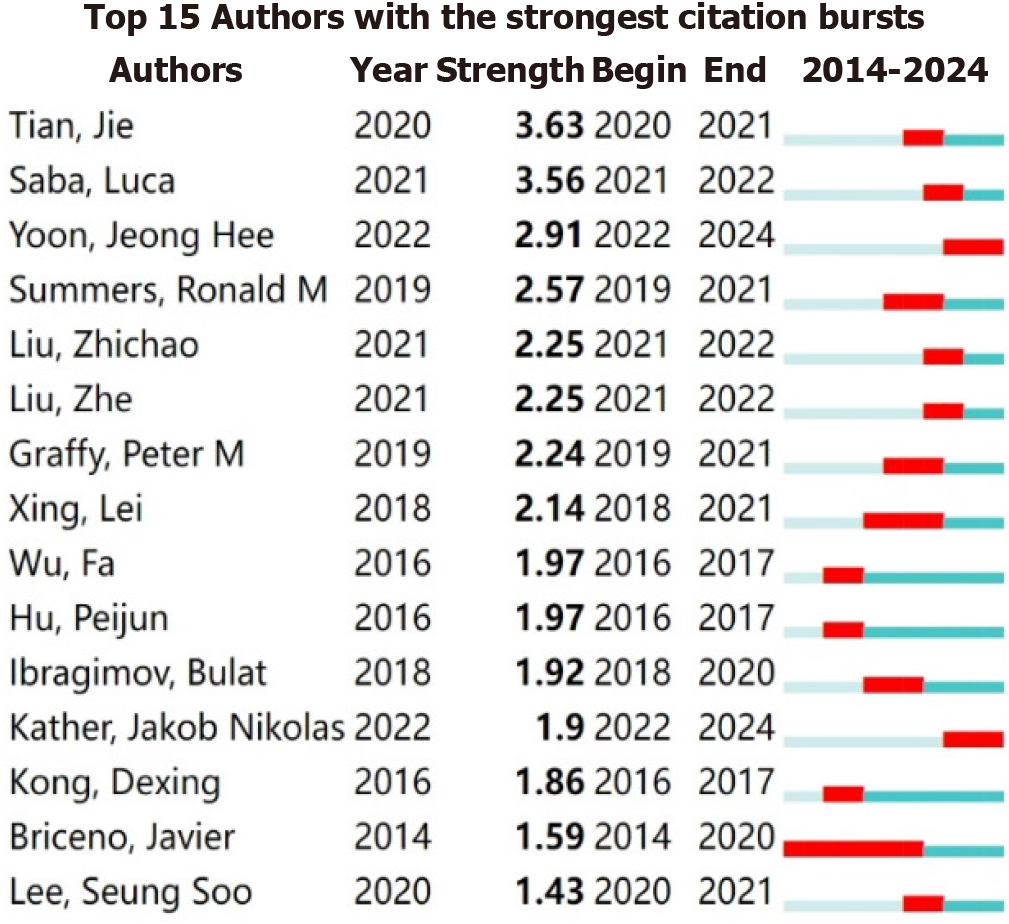
Figure 6
Burst figure of authors.
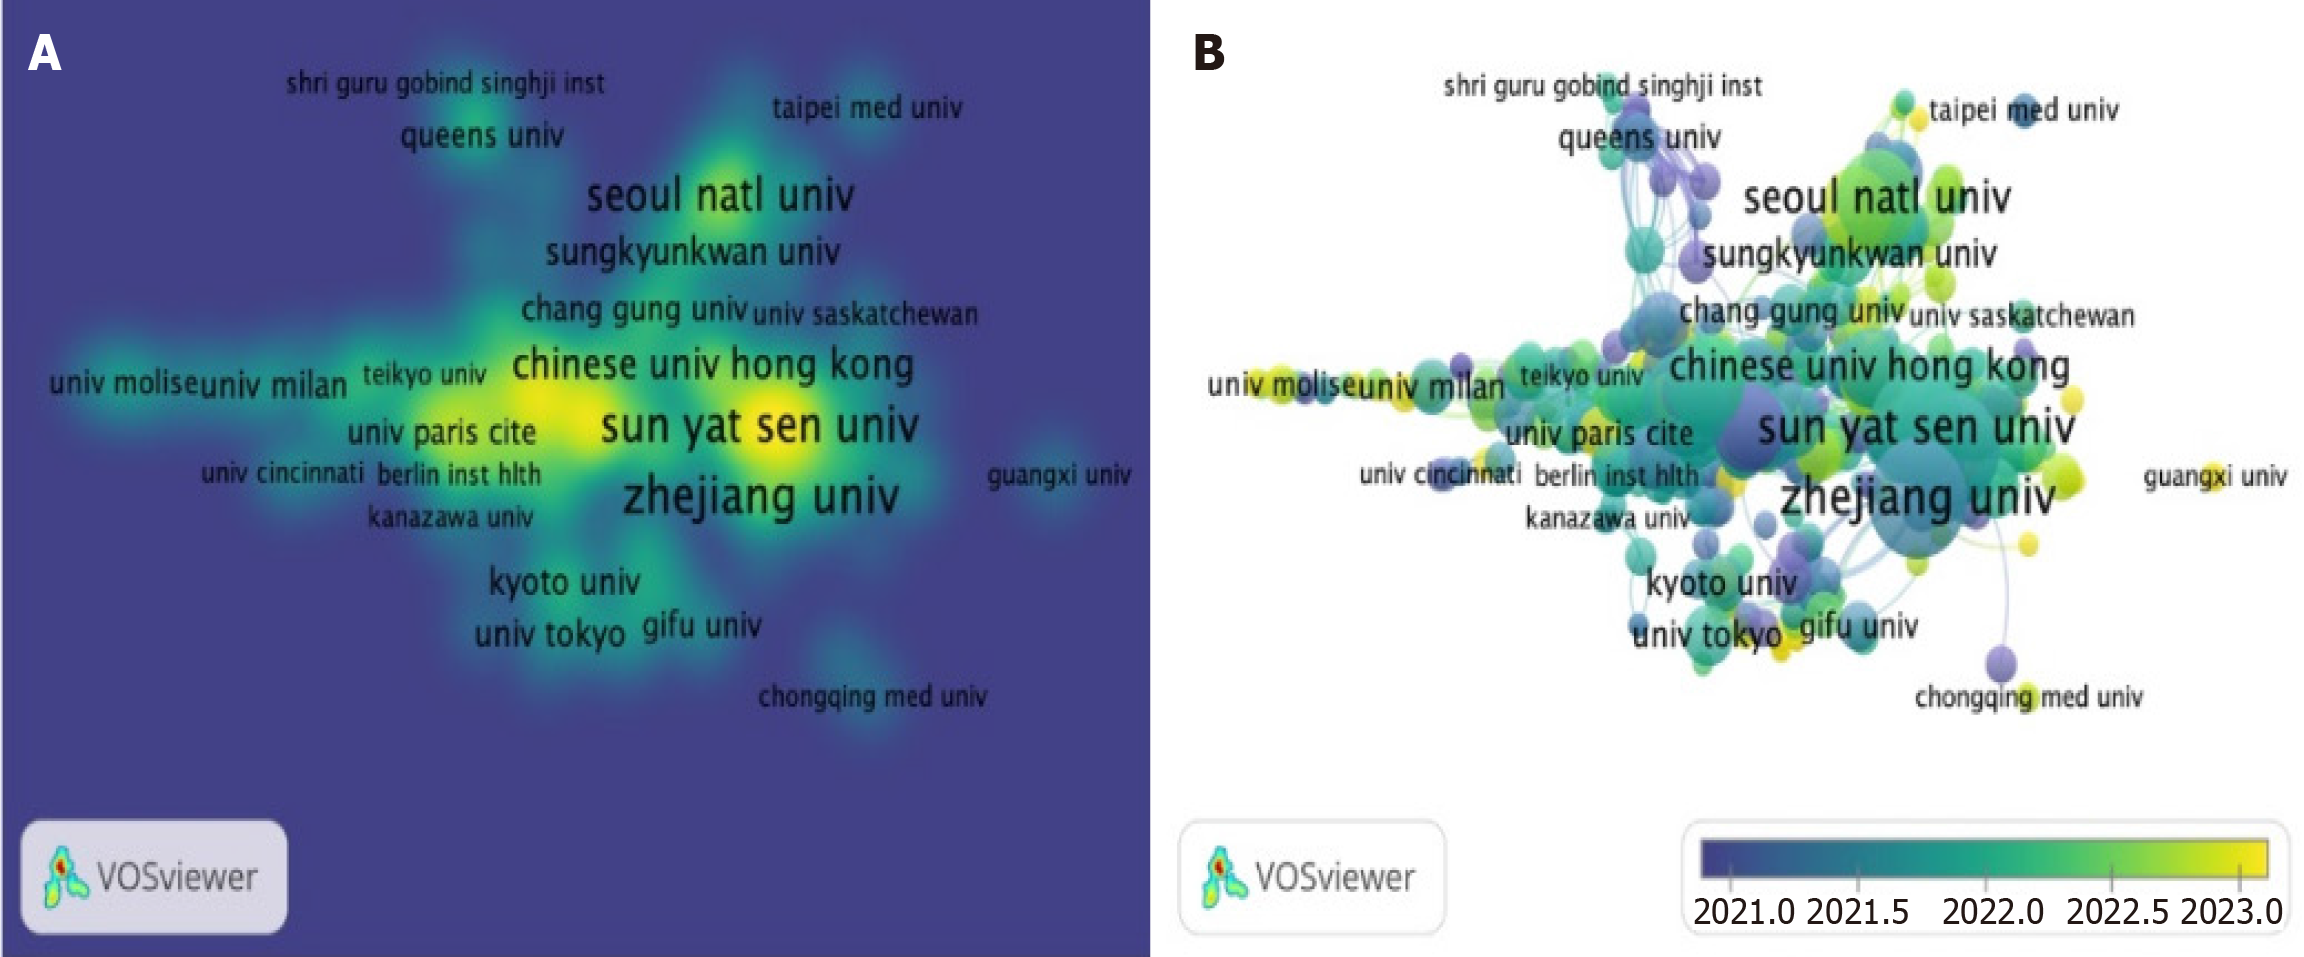
Figure 7 Collaboration network maps of institutions.
A: Hot spot distribution; B: Time distribution.
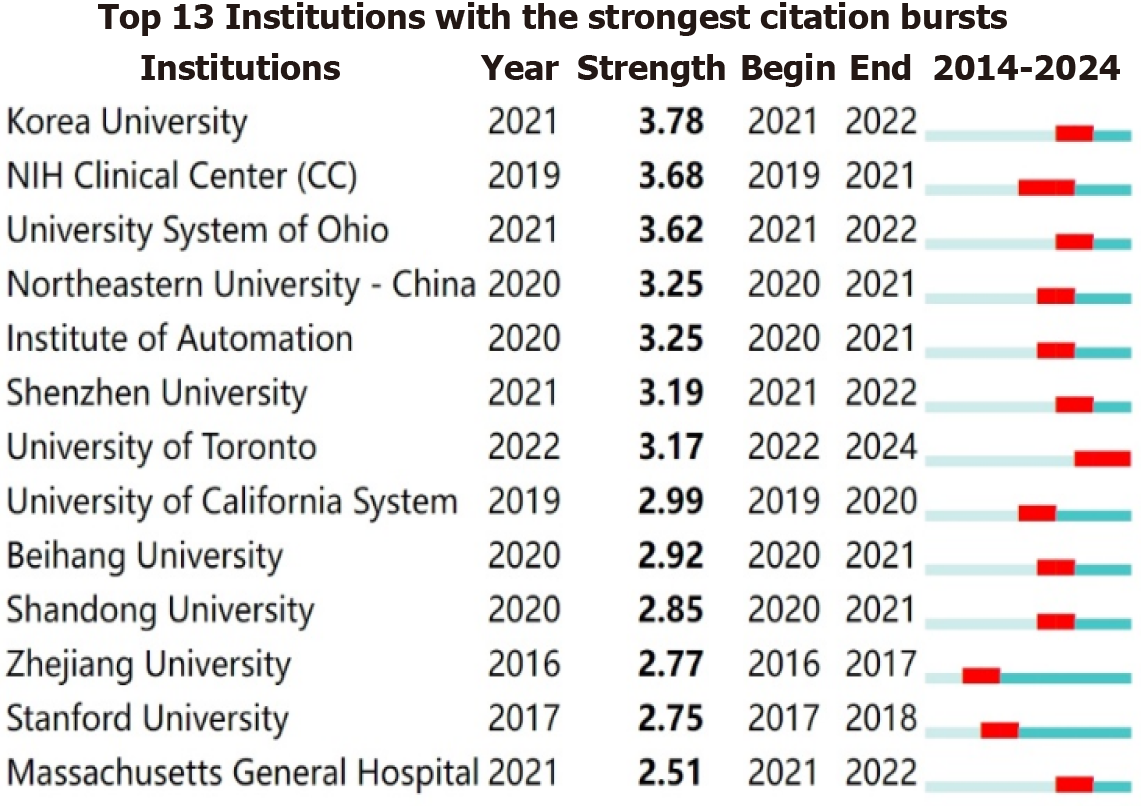
Figure 8
Burst figure of institutions.
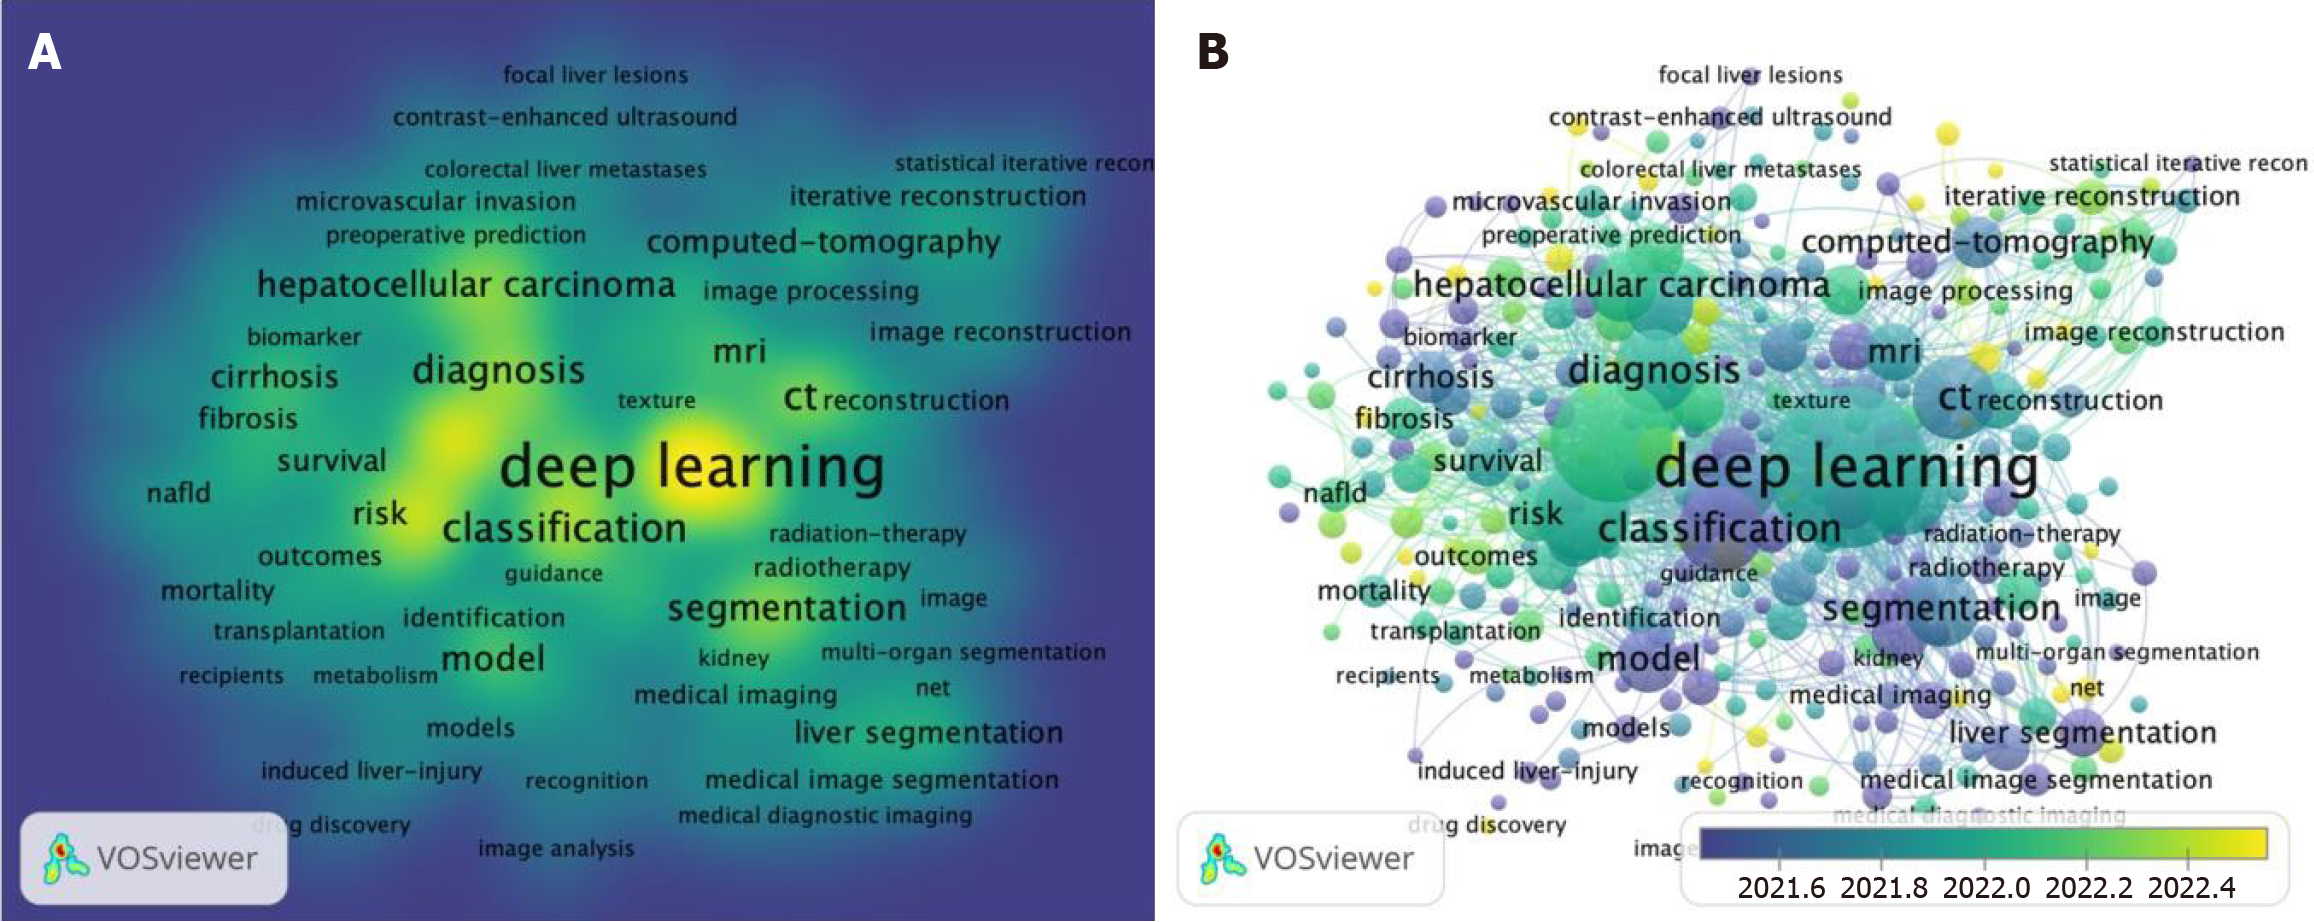
Figure 9 Keyword frequency and correlation graph.
A: Hot spot distribution; B: Time distribution.
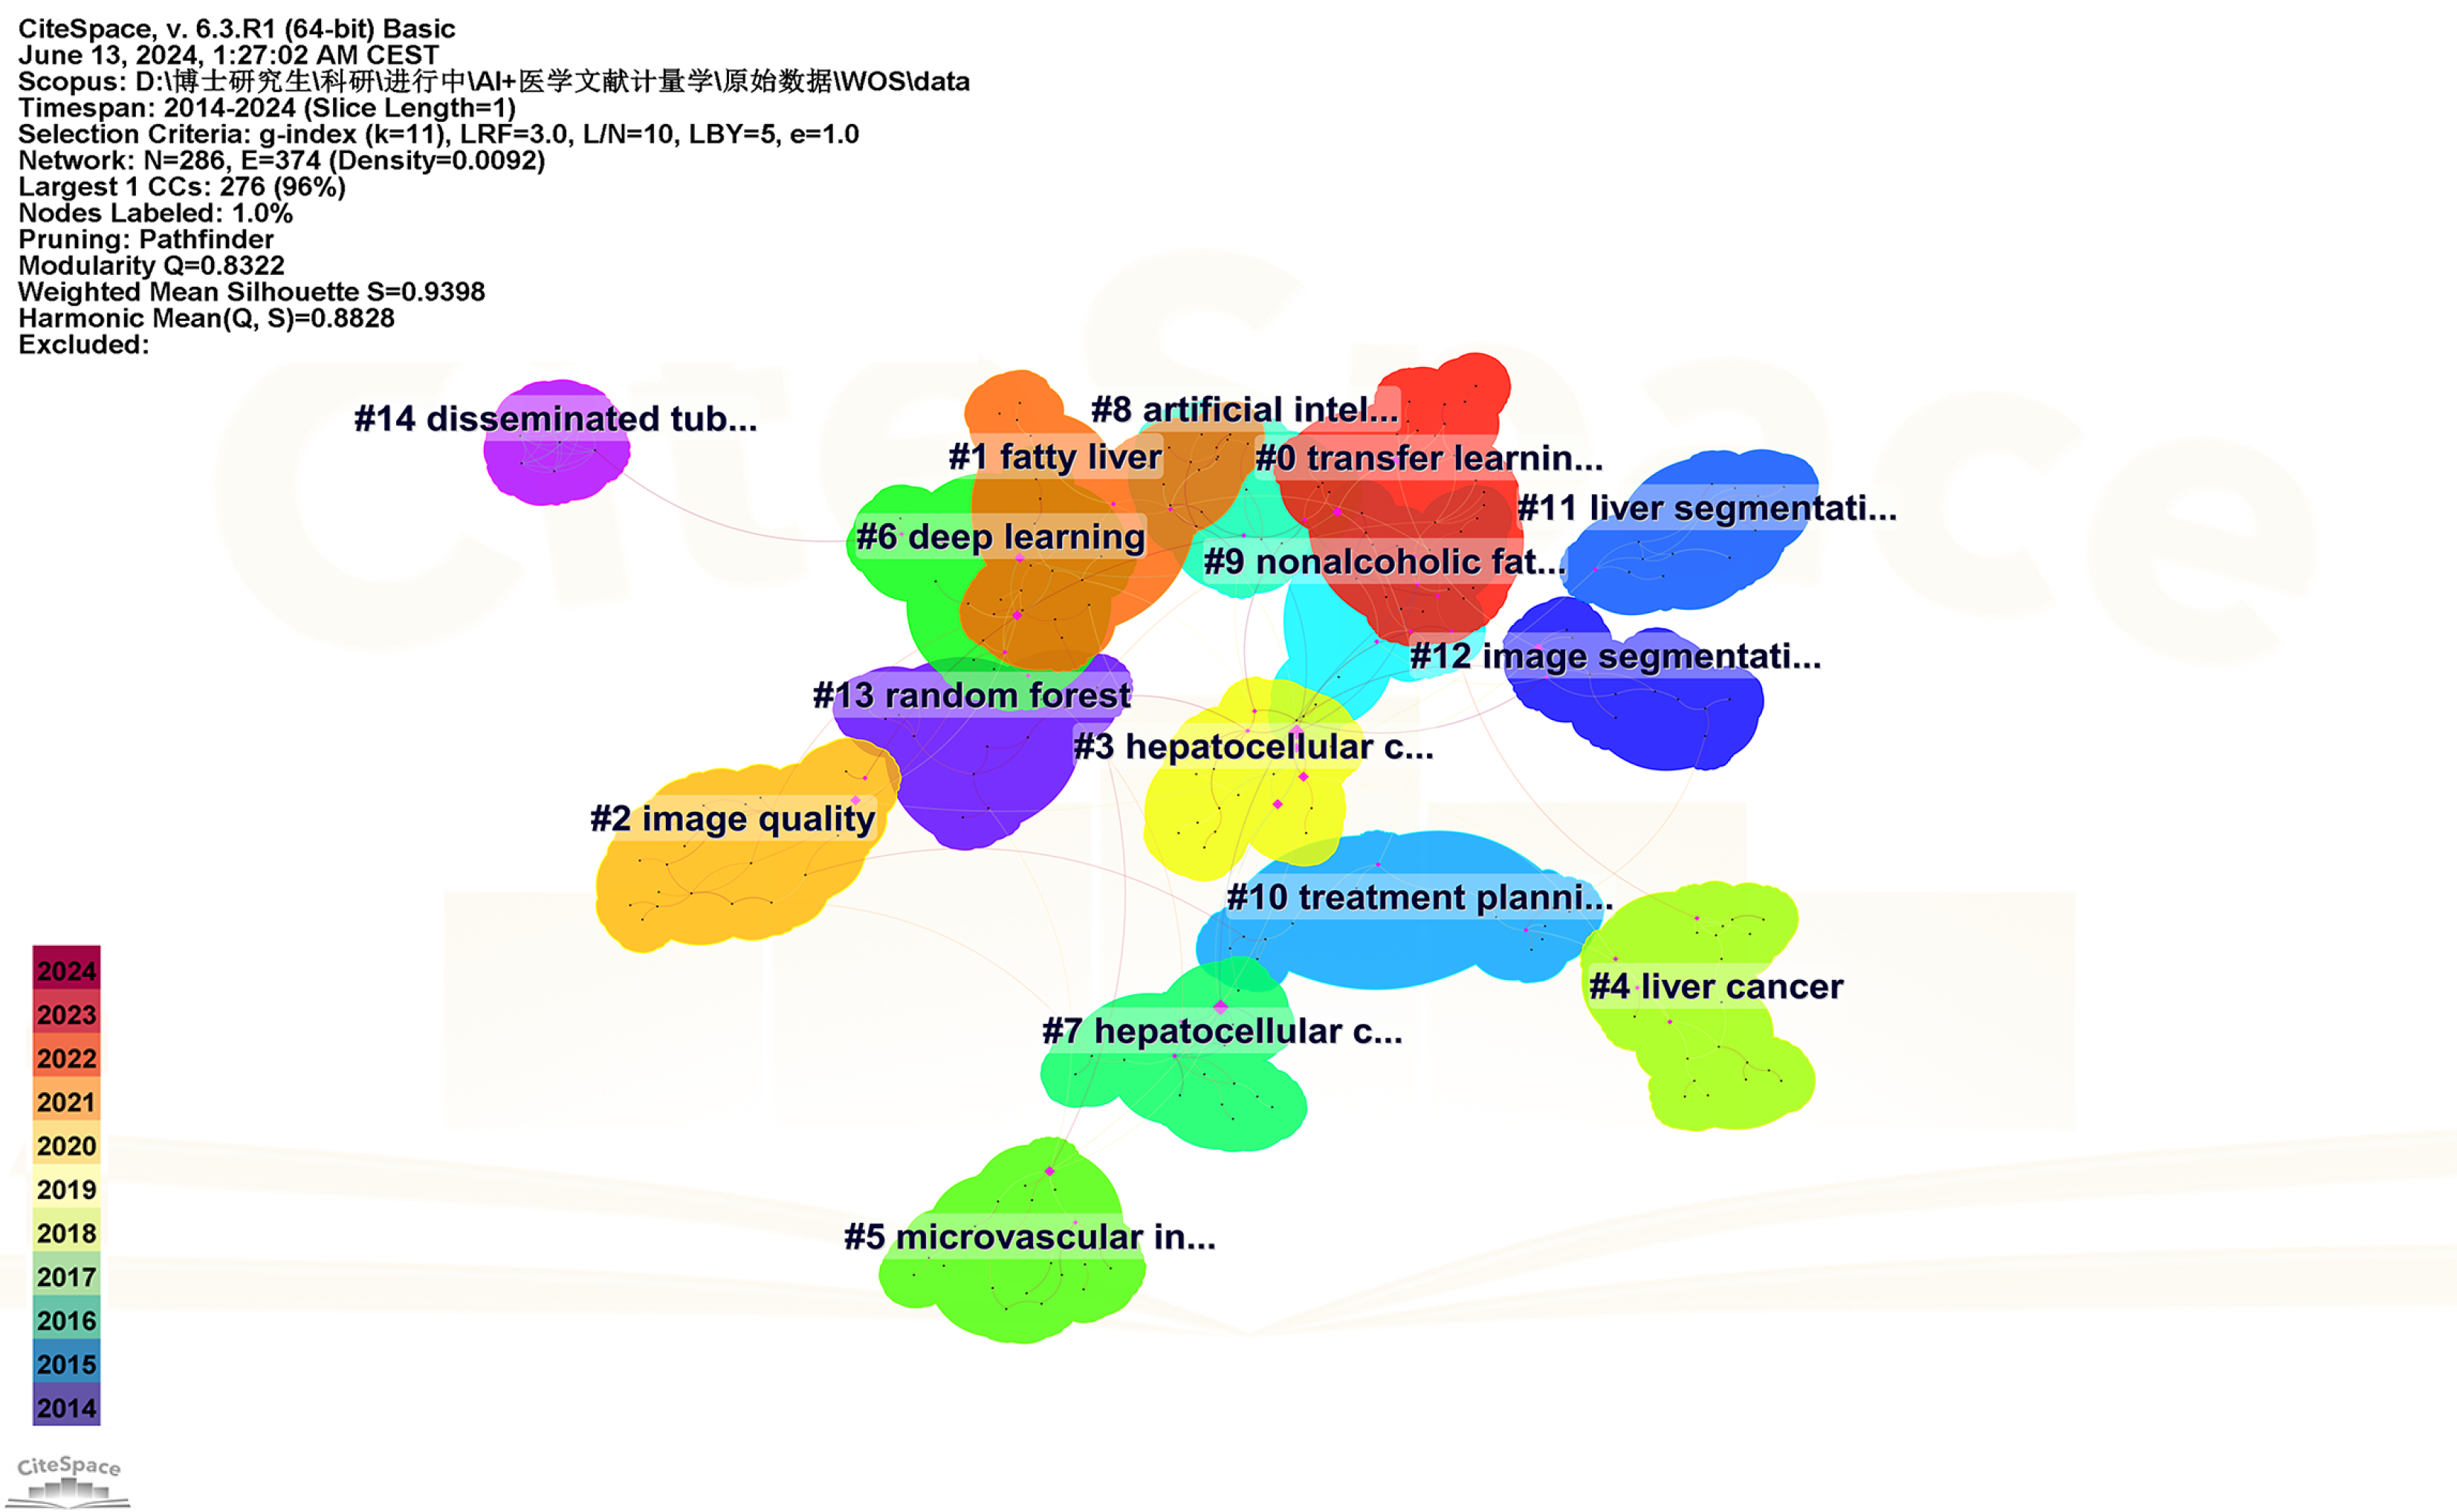
Figure 10
Keyword clustering diagram.
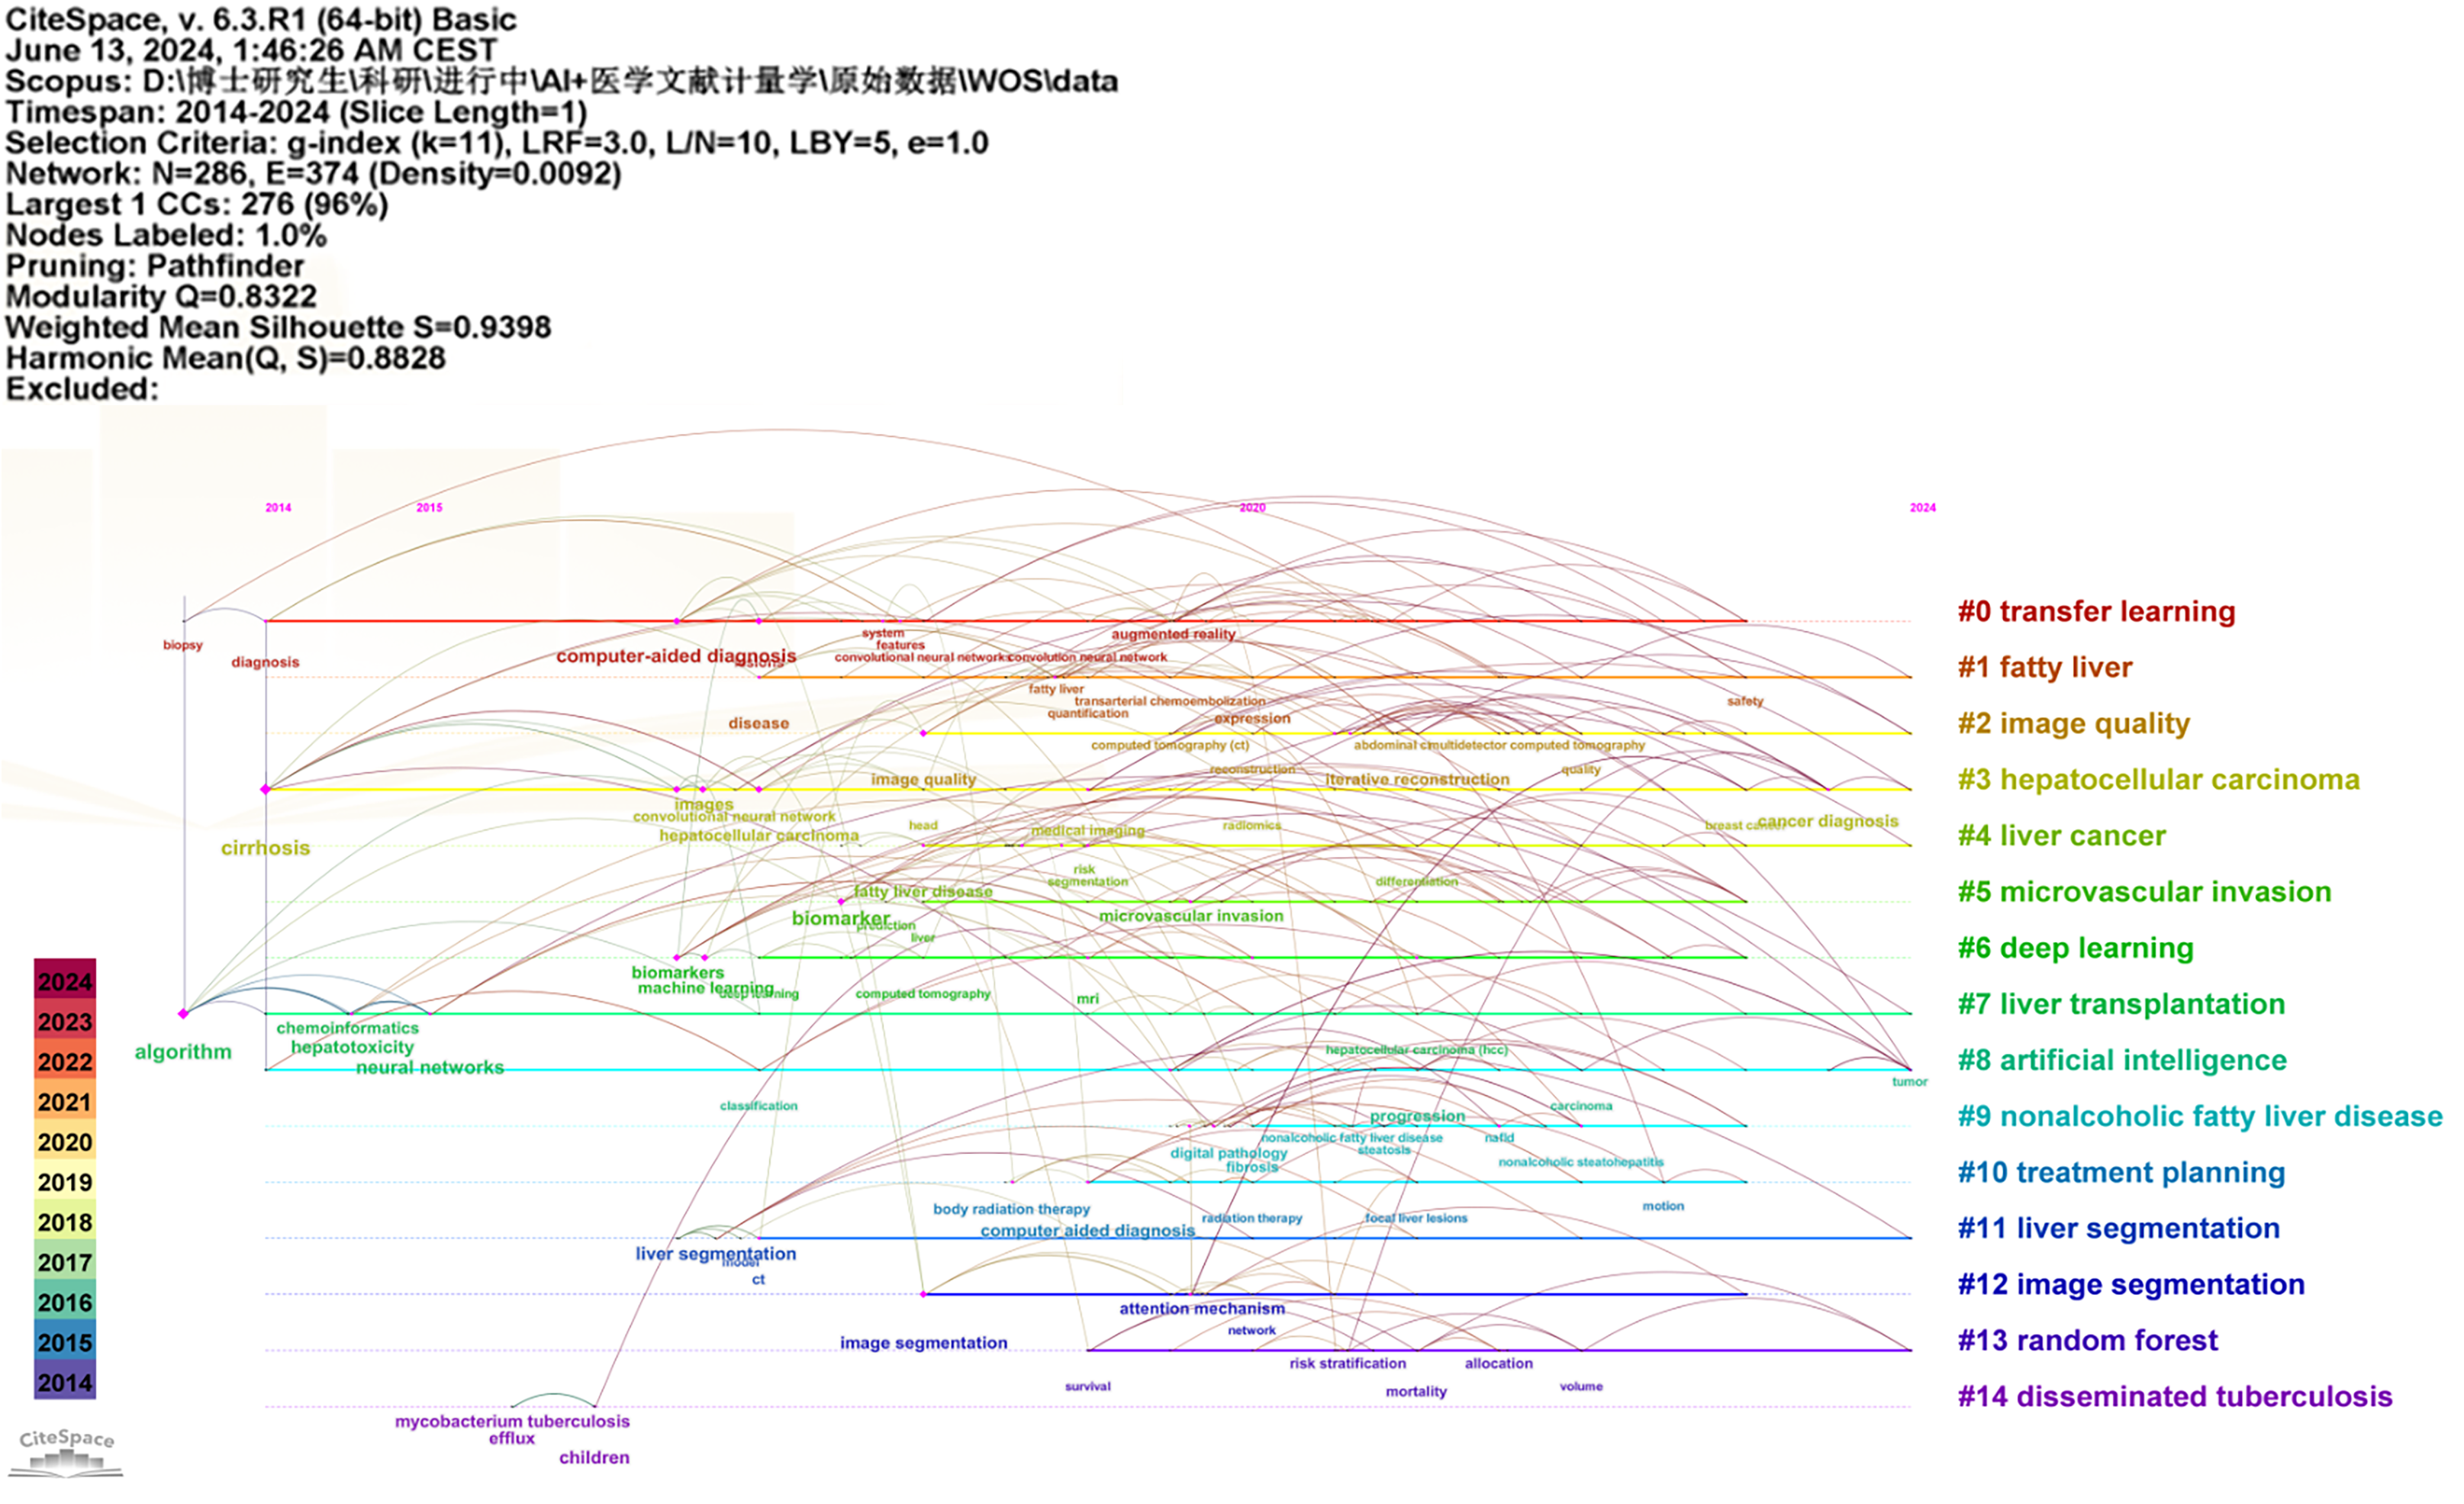
Figure 11
Keyword timeline figure.
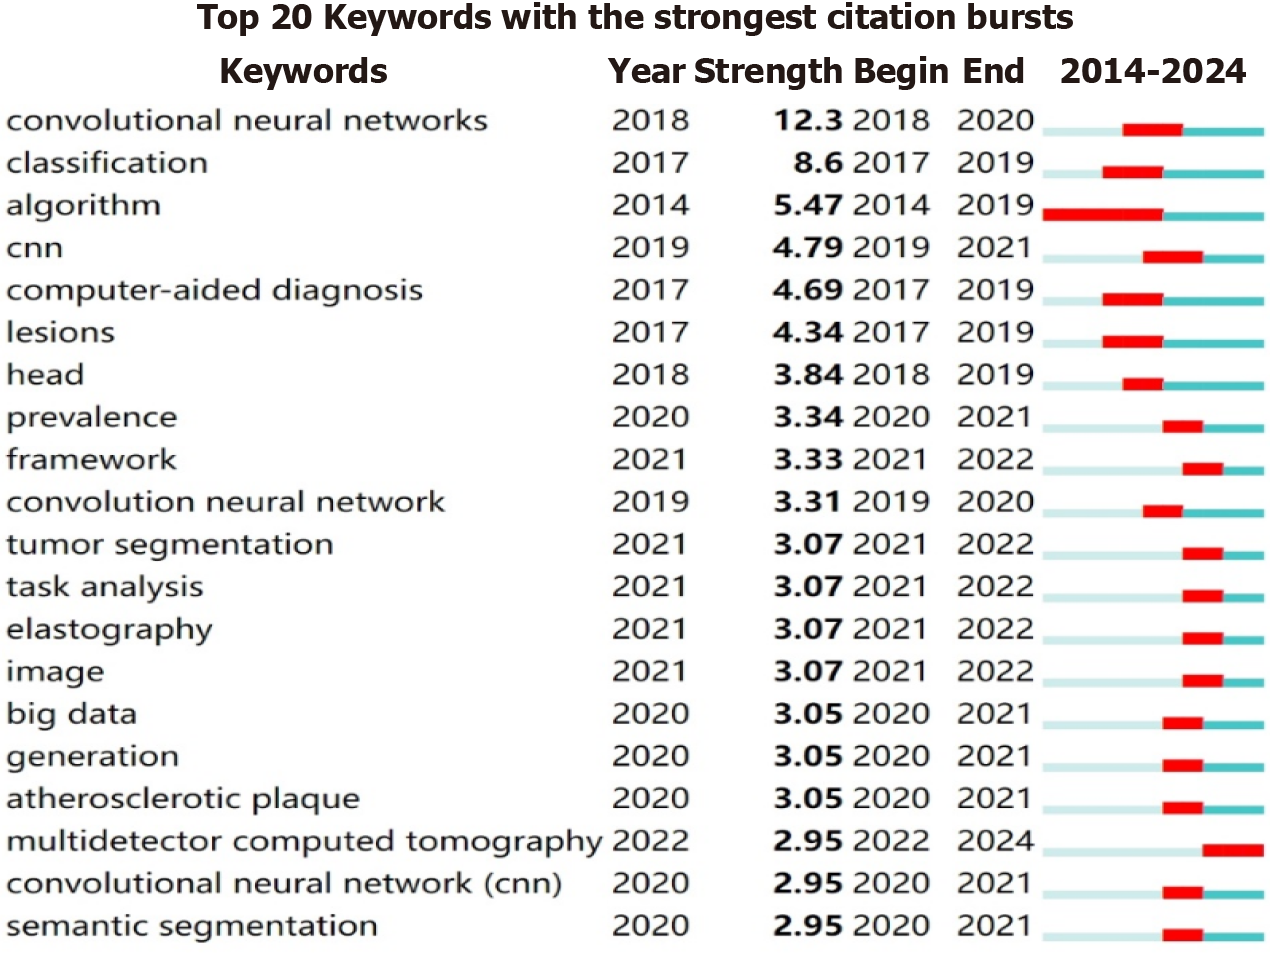
Figure 12
Keyword burst figure.
- Citation: Zheng RJ, Li DL, Lin HM, Wang JF, Luo YM, Tang Y, Li F, Hu Y, Su S. Bibliometrics of artificial intelligence applications in hepatobiliary surgery from 2014 to 2024. World J Gastrointest Surg 2025; 17(5): 104728
- URL: https://www.wjgnet.com/1948-9366/full/v17/i5/104728.htm
- DOI: https://dx.doi.org/10.4240/wjgs.v17.i5.104728


