Copyright
©The Author(s) 2025.
World J Gastrointest Surg. May 27, 2025; 17(5): 103340
Published online May 27, 2025. doi: 10.4240/wjgs.v17.i5.103340
Published online May 27, 2025. doi: 10.4240/wjgs.v17.i5.103340
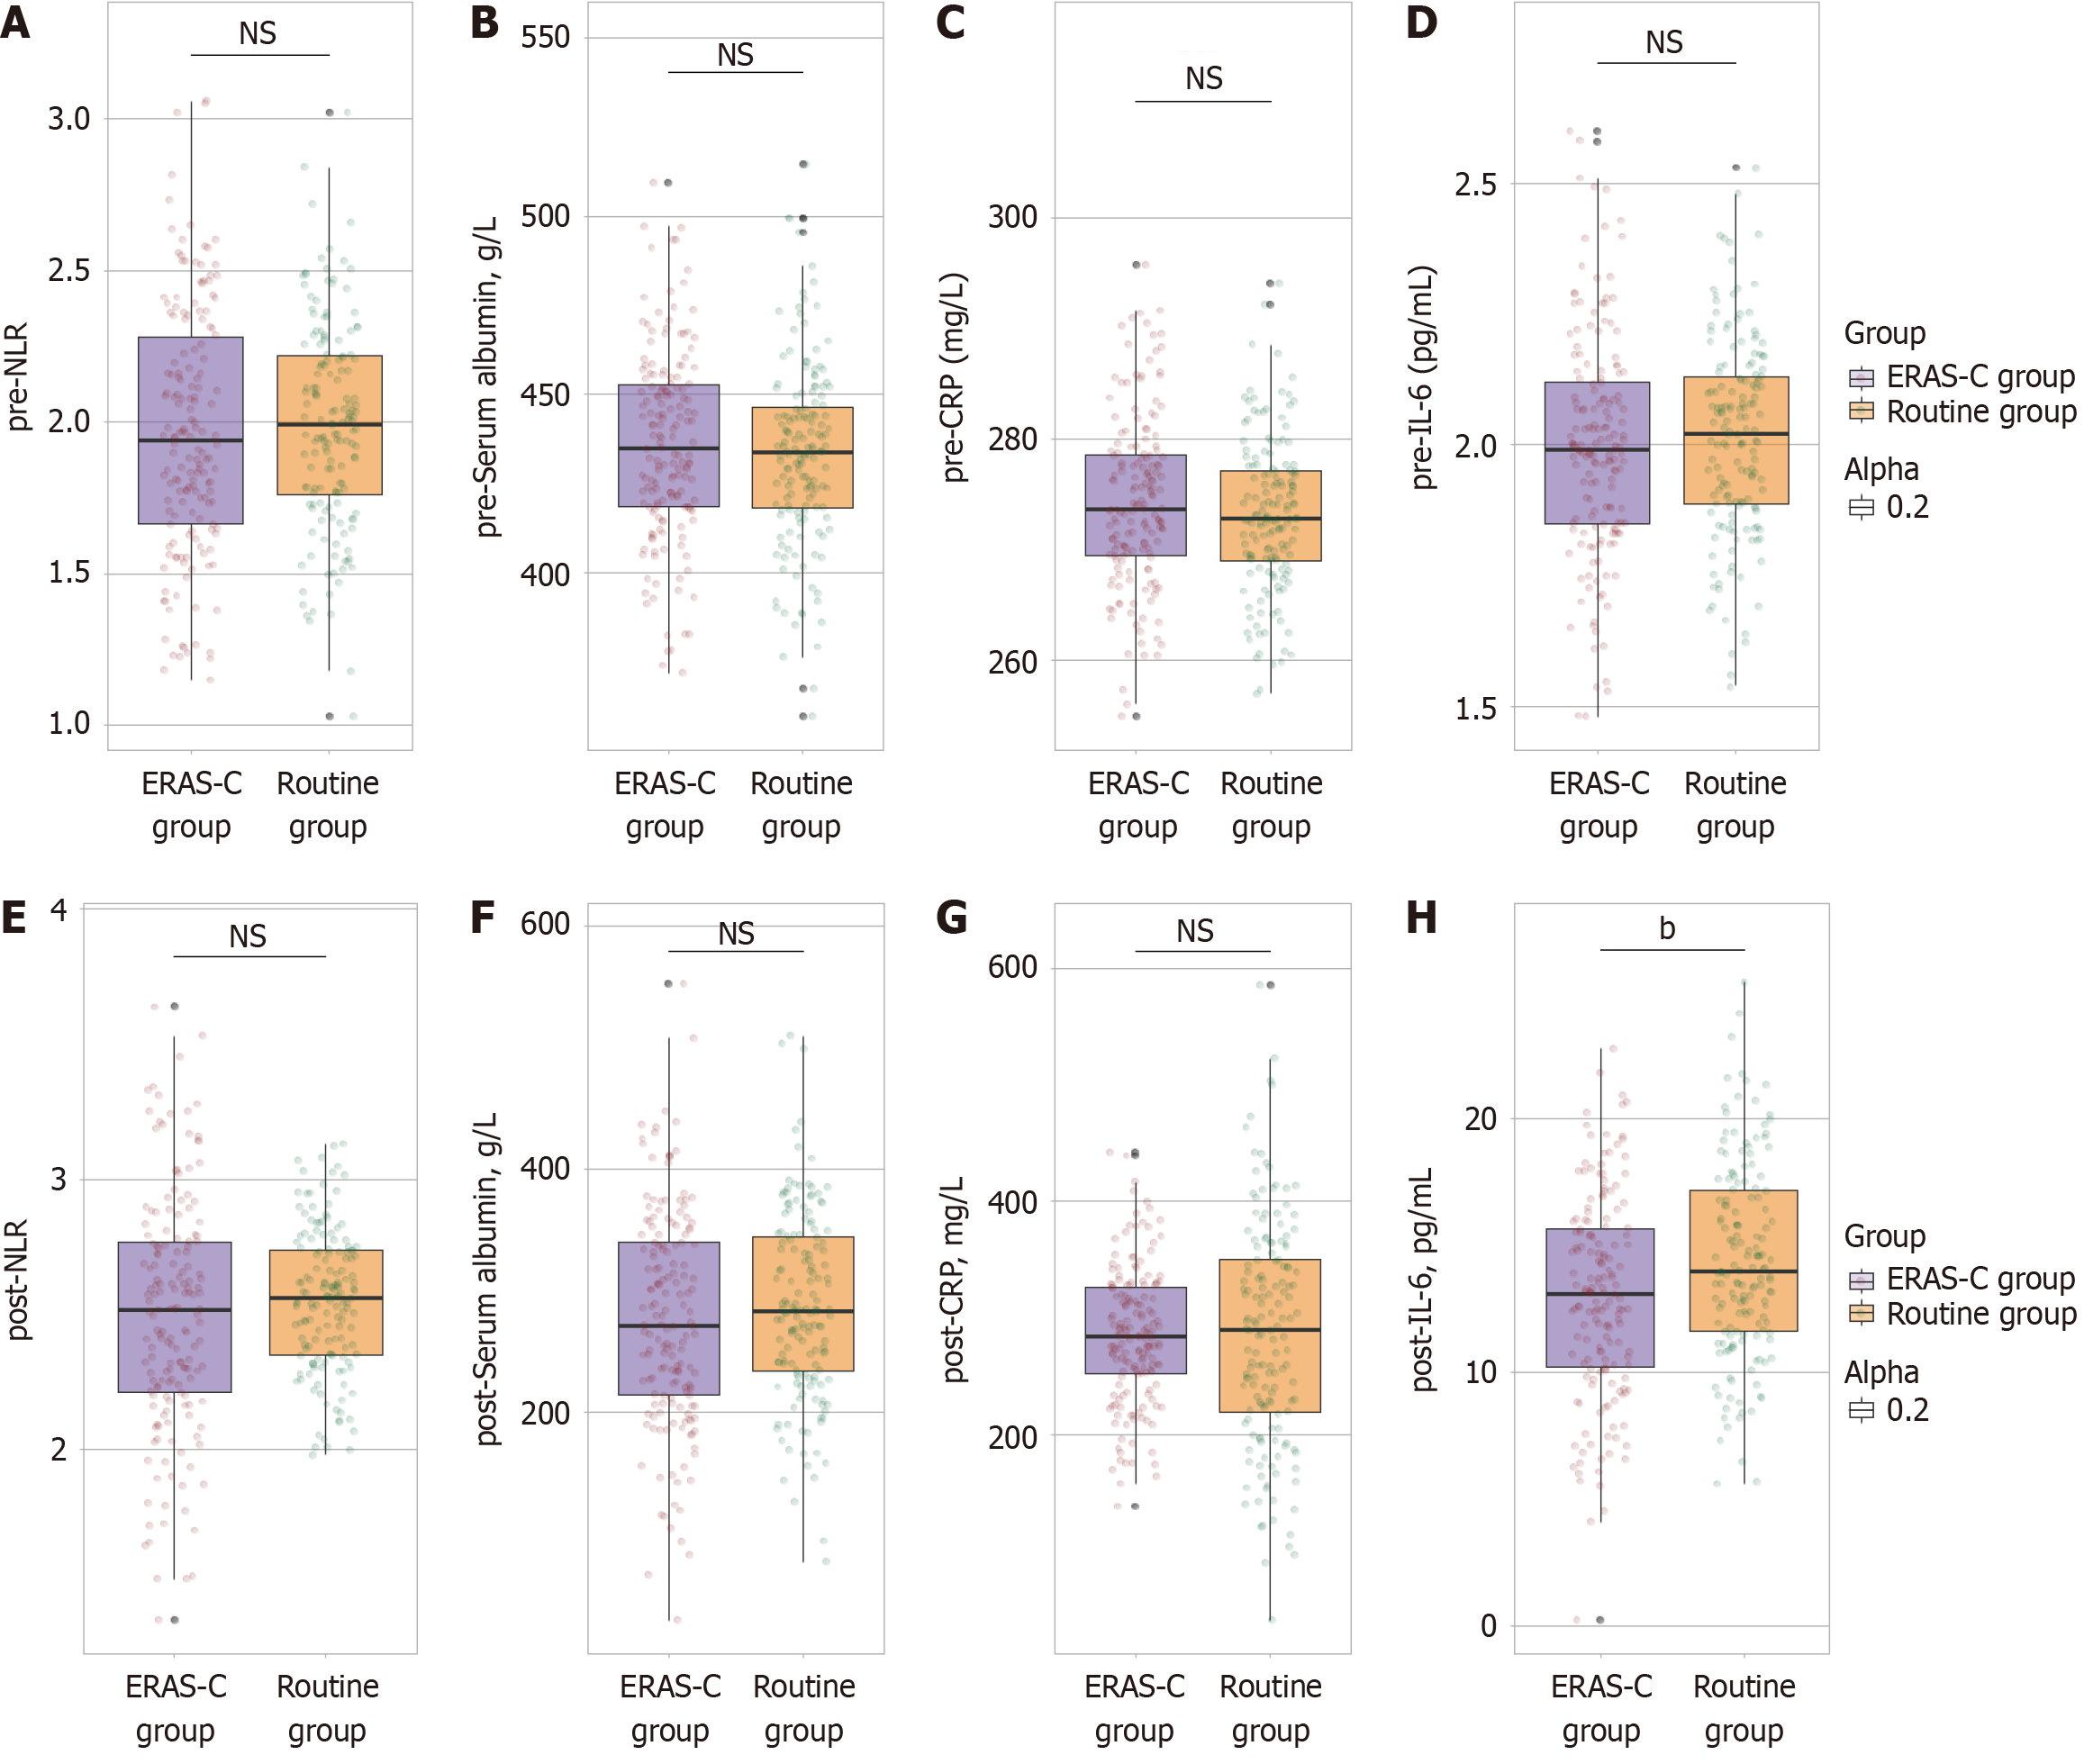
Figure 1 Comparison of inflammatory markers between the routine and enhanced recovery after surgery-control groups.
A-D: Preoperative results: Neutrophil-to-lymphocyte ratio (A); Serum albumin (B); C-reactive protein (C); Interleukin-6 (D); E-H: One month postoperatively results: Neutrophil-to-lymphocyte ratio (E); Serum albumin (F); C-reactive protein (G); Interleukin-6 (H). bP < 0.01. ns: No statistically significant difference; NLR: Neutrophil-to-lymphocyte ratio; CRP: C-reactive protein; IL: Interleukin; ERAD-C: Enhanced recovery after surgery-control.
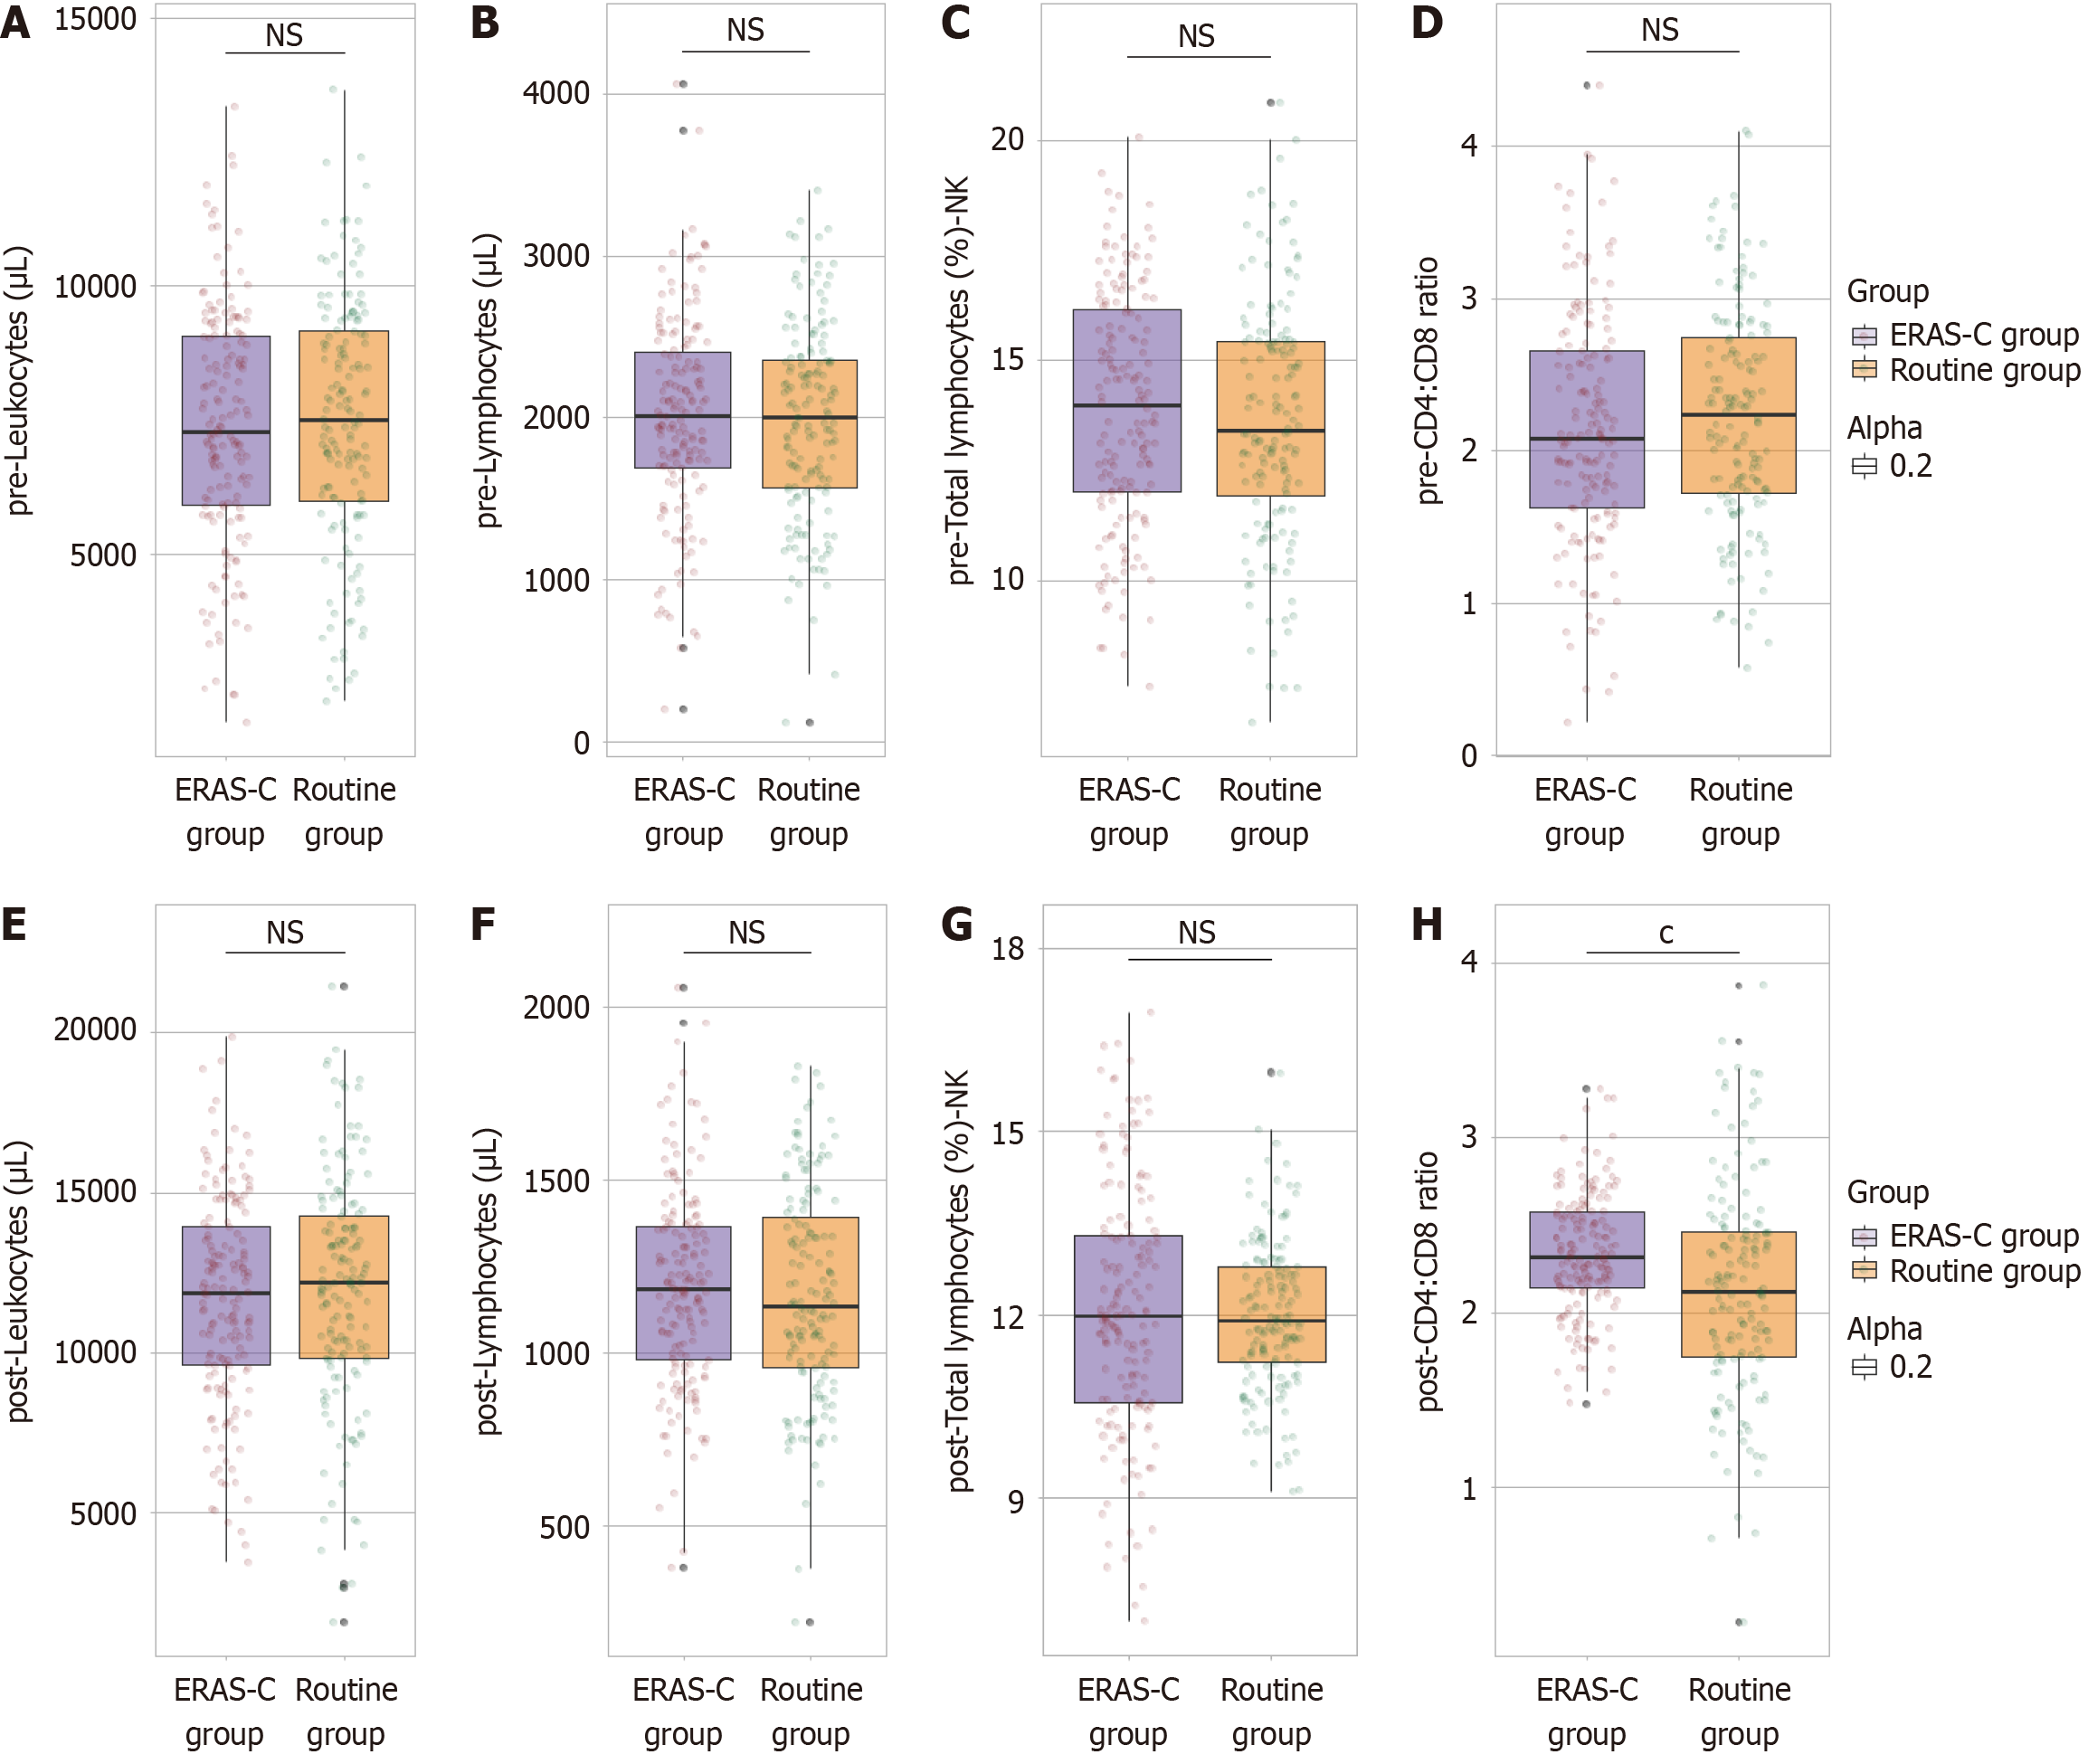
Figure 2 Comparison of immune parameters between the routine and enhanced recovery after surgery-control groups.
A-D: Preoperative results: Leukocytes (A); Lymphocytes (B); Total lymphocytes classified as natural killer cells (C); Cluster of differentiation (CD) 4:CD8 ratio (D); E-H: One month postoperatively results: Leukocytes (E); Lymphocytes (F); Total lymphocytes classified as natural killer cells (G); CD4:CD8 ratio (H). cP < 0.001. ns: No statistically significant difference; NK: Natural killer; CD: Cluster of differentiation; ERAD-C: Enhanced recovery after surgery-control.
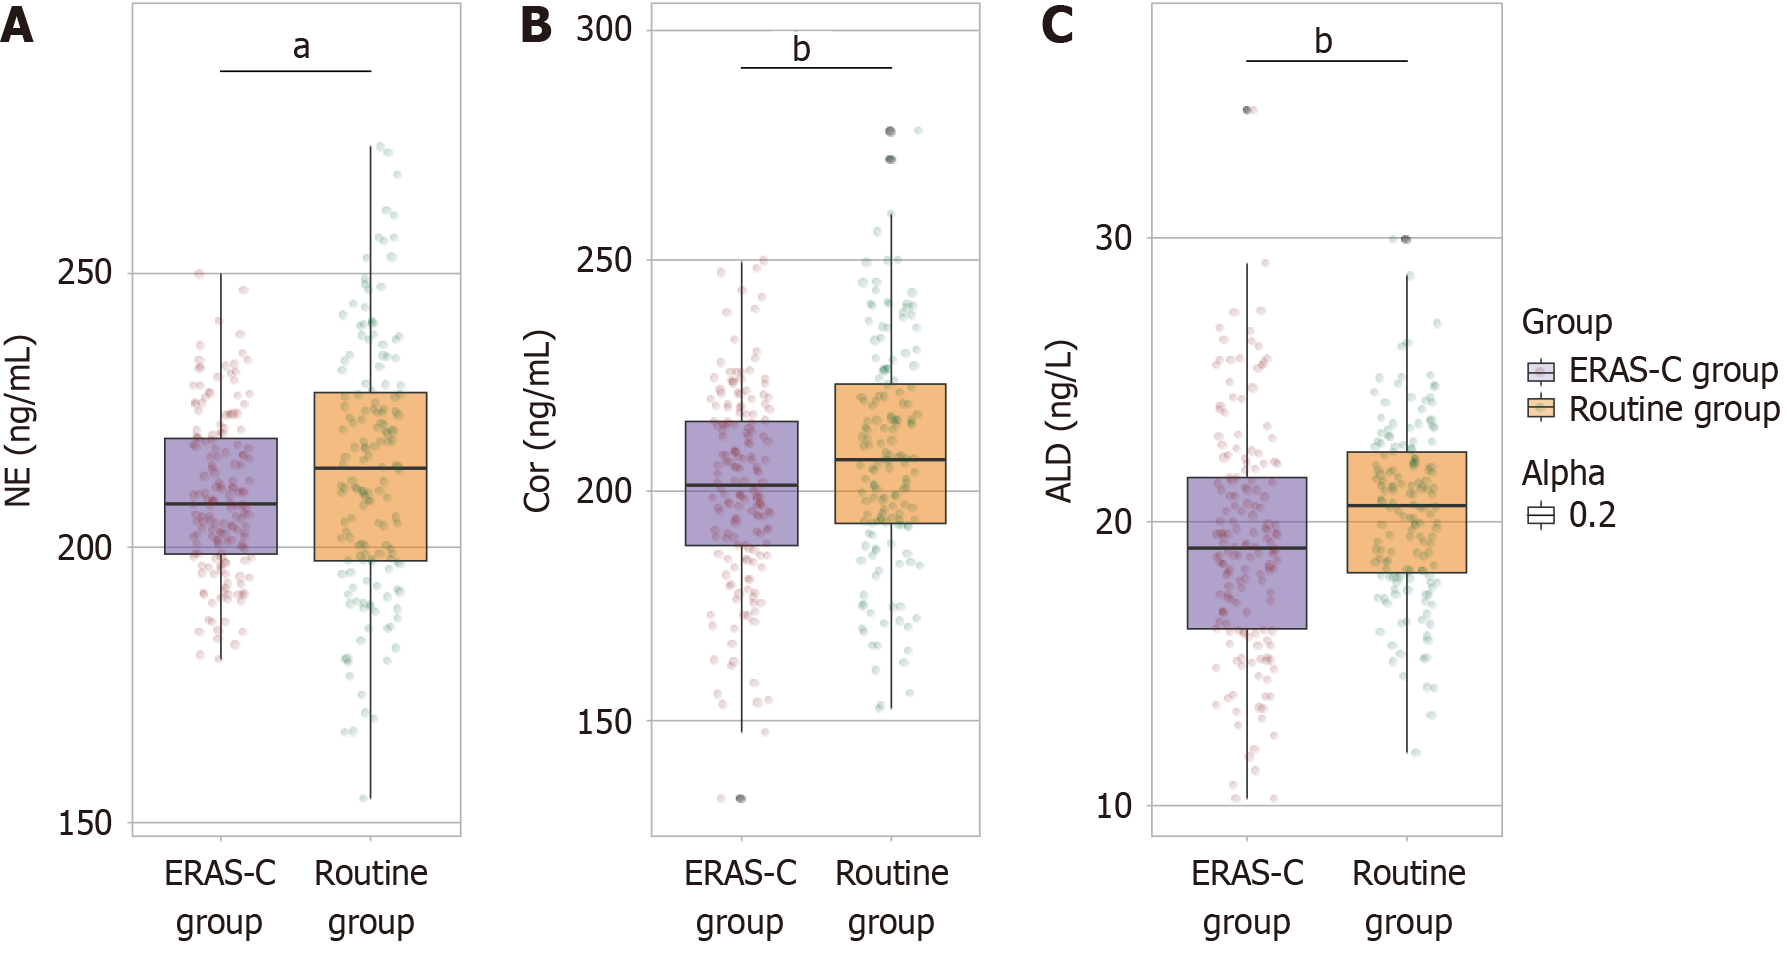
Figure 3 Comparison of stress response indicators one month postoperatively between the routine and enhanced recovery after surgery-control groups.
A: Norepinephrine; B: Cortisol; C: Aldosterone. aP < 0.05. bP < 0.01. NE: Norepinephrine; Cor: Cortisol; ALD: Aldosterone; ERAD-C: Enhanced recovery after surgery-control.
- Citation: Lu CP, Gao Y, Zhang ZH. Enhanced recovery after surgery continuity nursing in elderly gastric cancer patients. World J Gastrointest Surg 2025; 17(5): 103340
- URL: https://www.wjgnet.com/1948-9366/full/v17/i5/103340.htm
- DOI: https://dx.doi.org/10.4240/wjgs.v17.i5.103340


