Copyright
©The Author(s) 2025.
World J Gastrointest Surg. Apr 27, 2025; 17(4): 104884
Published online Apr 27, 2025. doi: 10.4240/wjgs.v17.i4.104884
Published online Apr 27, 2025. doi: 10.4240/wjgs.v17.i4.104884
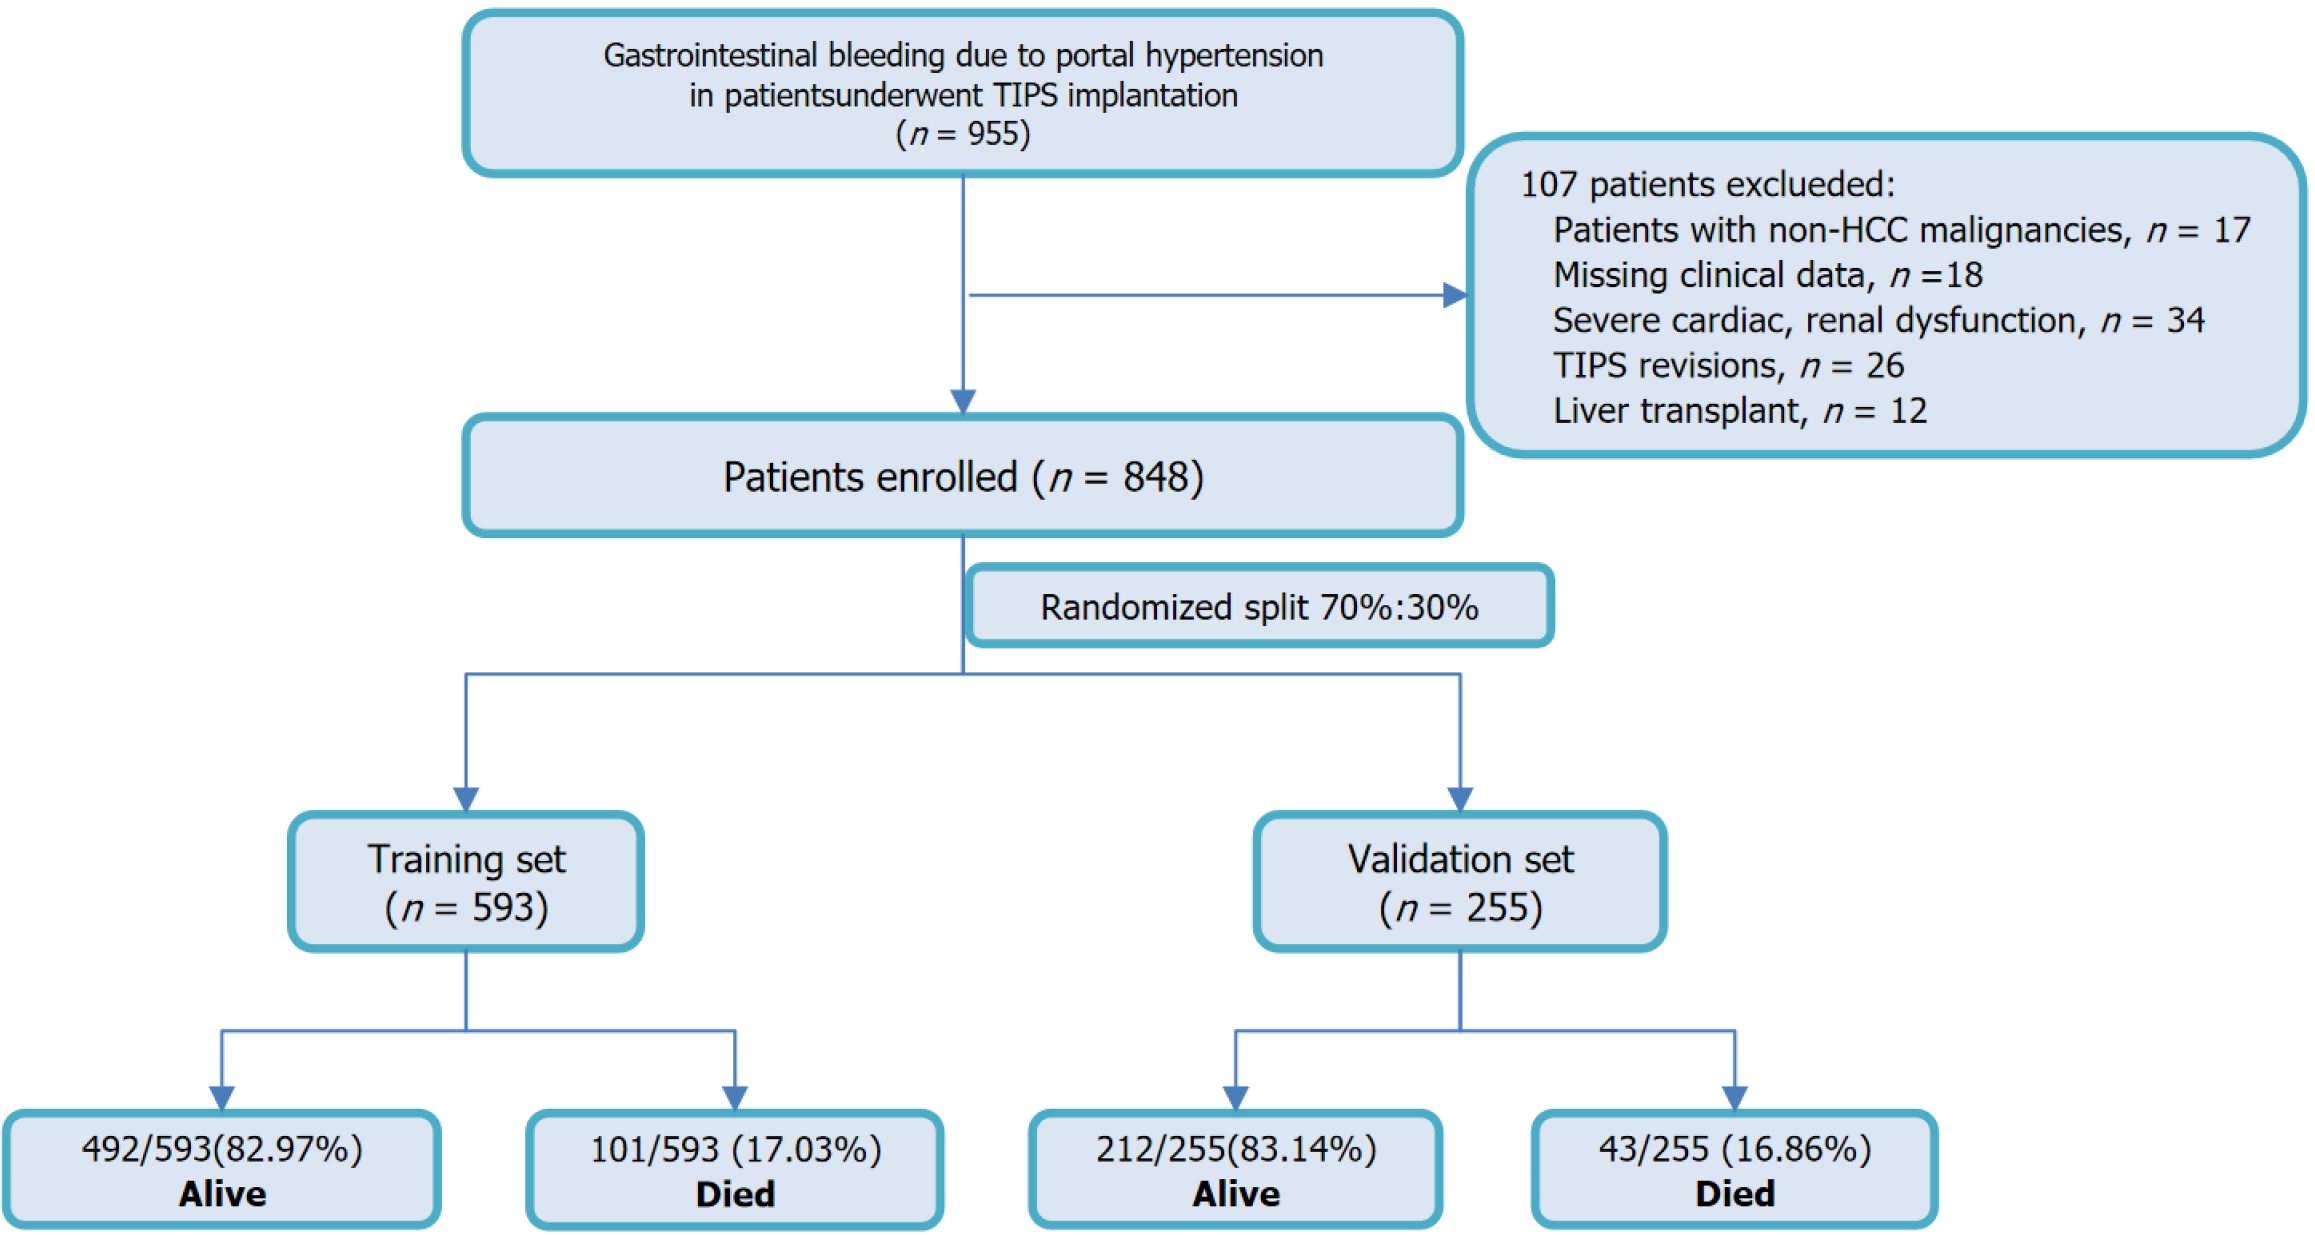
Figure 1 Flowchart of this study.
TIPS: Transjugular intrahepatic portosystemic shunt; HCC: Hepatocellular carcinoma.
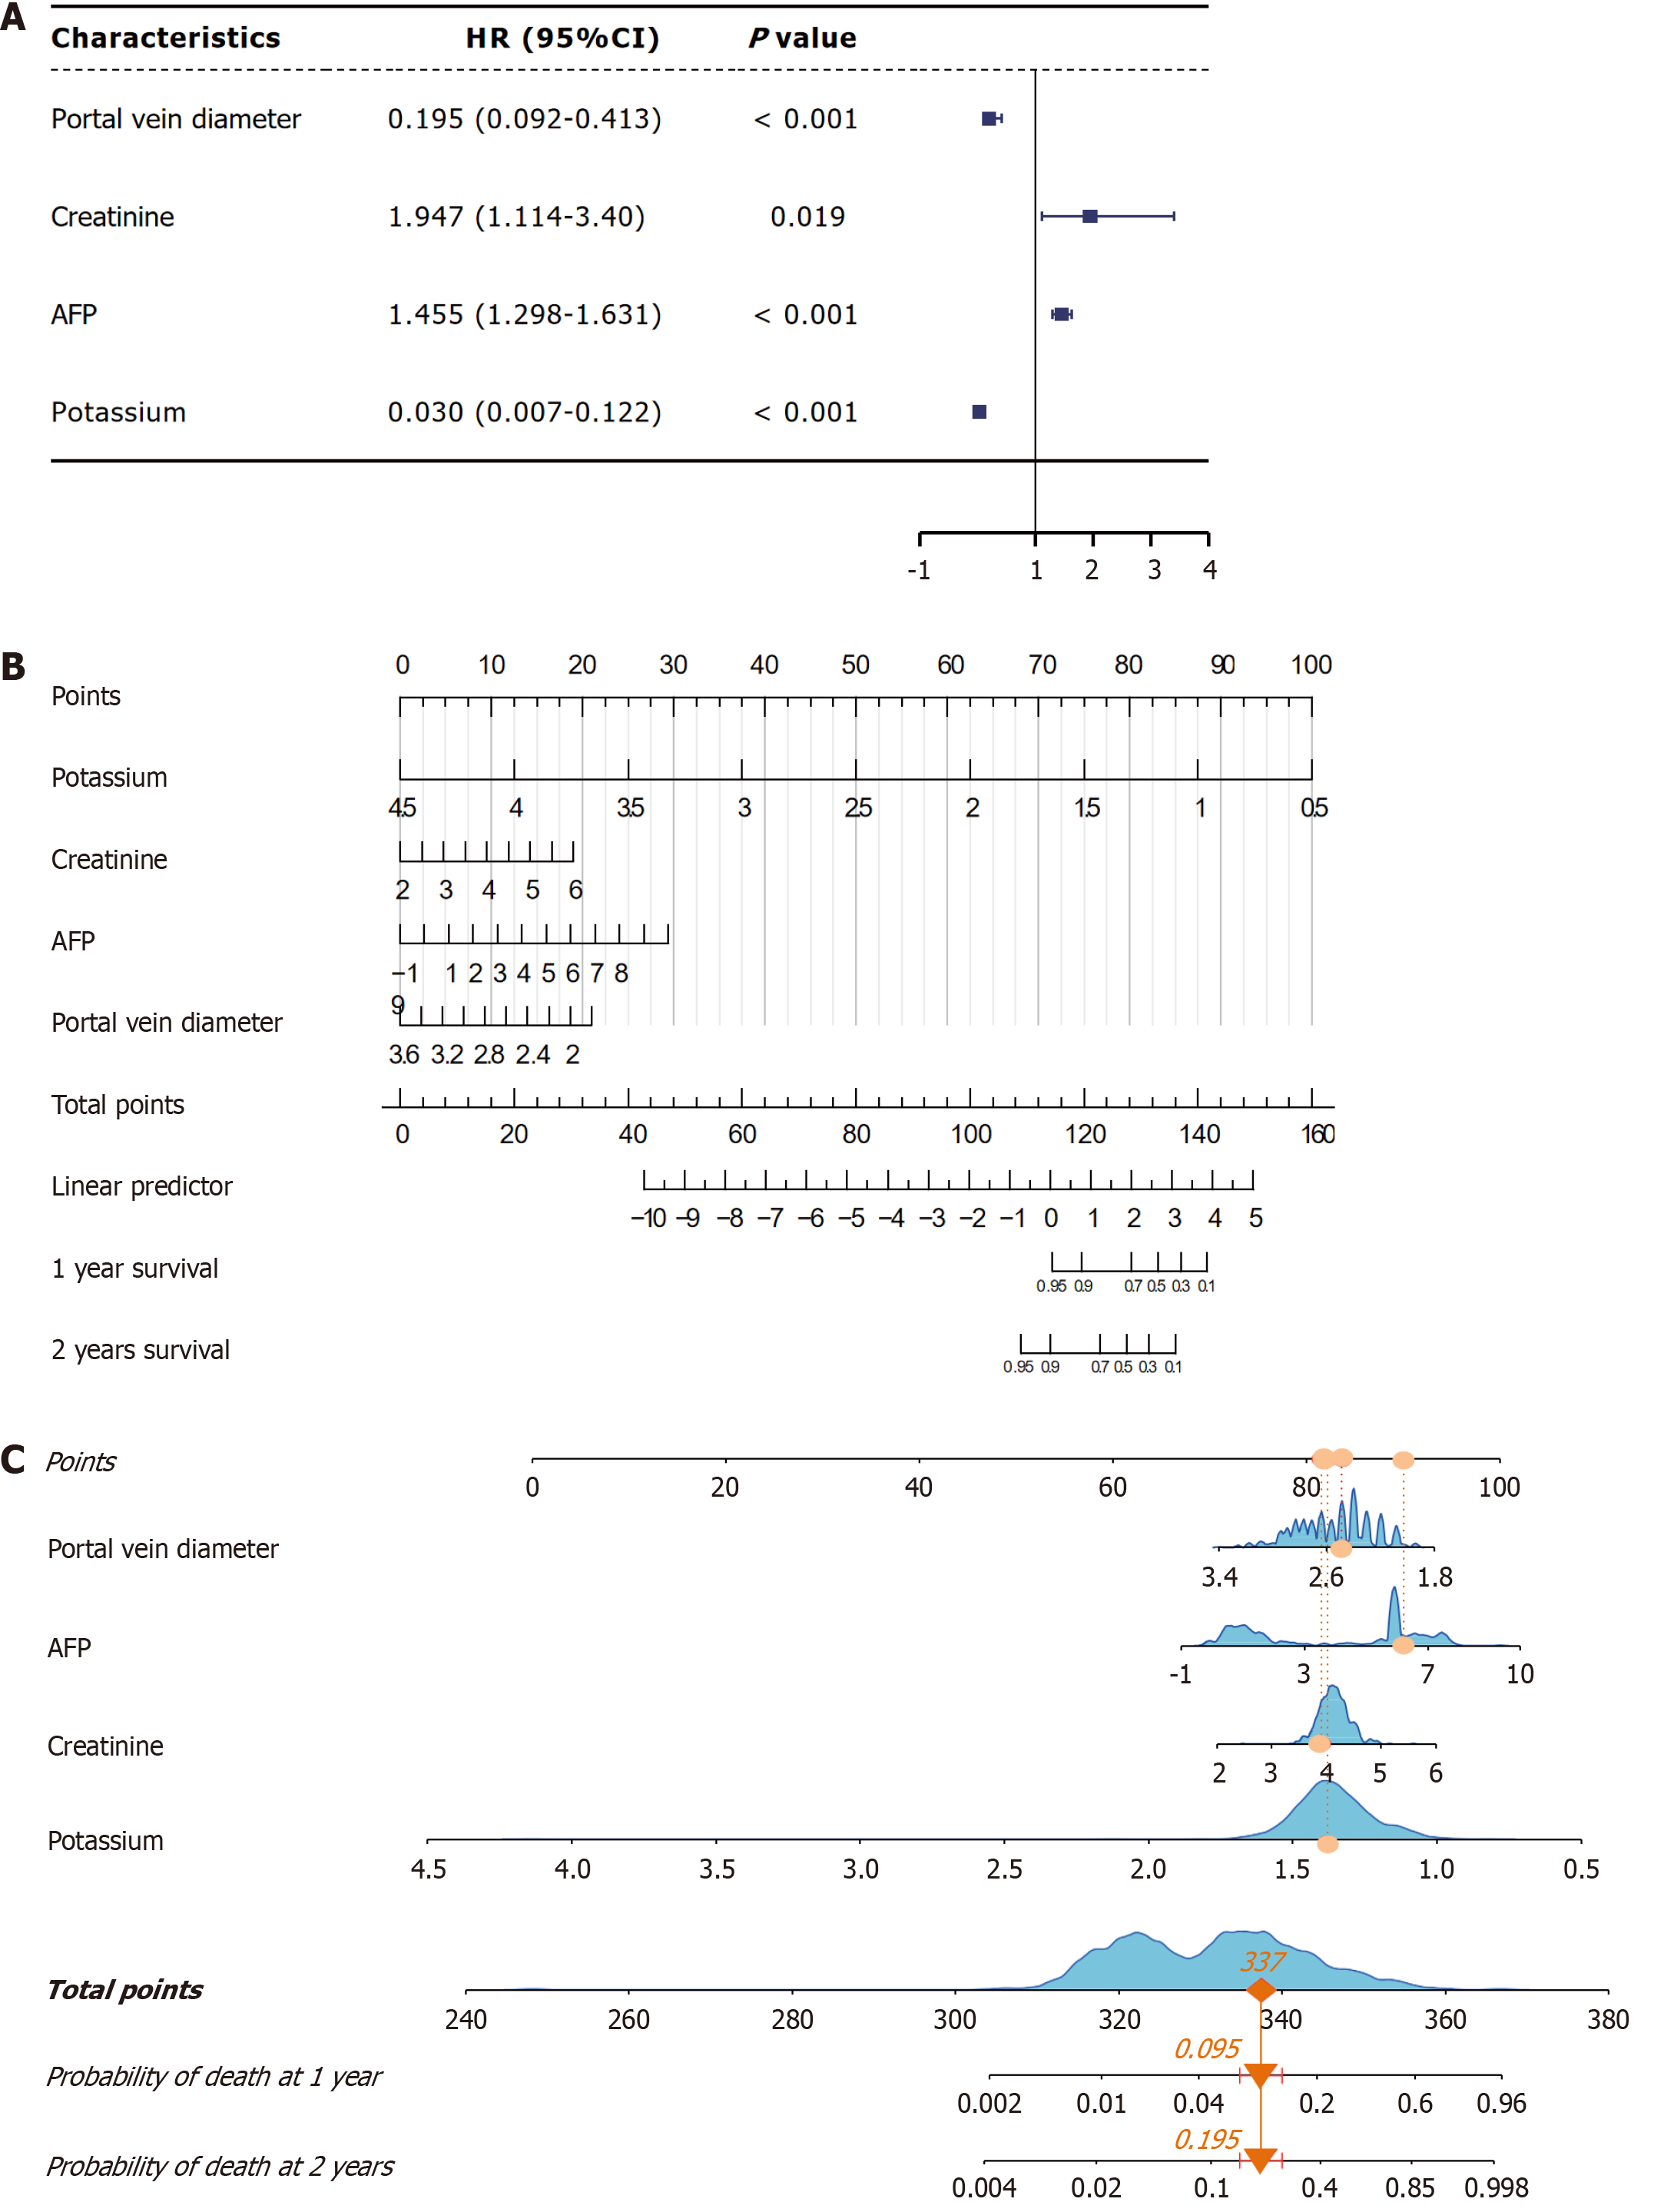
Figure 2 Prognostic model predicting the 1-year and 2-year survival following transjugular intrahepatic portosystemic shunt.
A: Forest plot of multivariable Cox regression analysis showing hazard ratios with 95% confidence interval; B: Nomogram predicting the 1-year and 2-year survival probabilities; C: Nomogram with a patient case example, illustrating predicted mortality probabilities at 1 year and 2 years. HR: Hazard ratio; CI: Confidence interval; AFP: Alpha-fetoprotein.
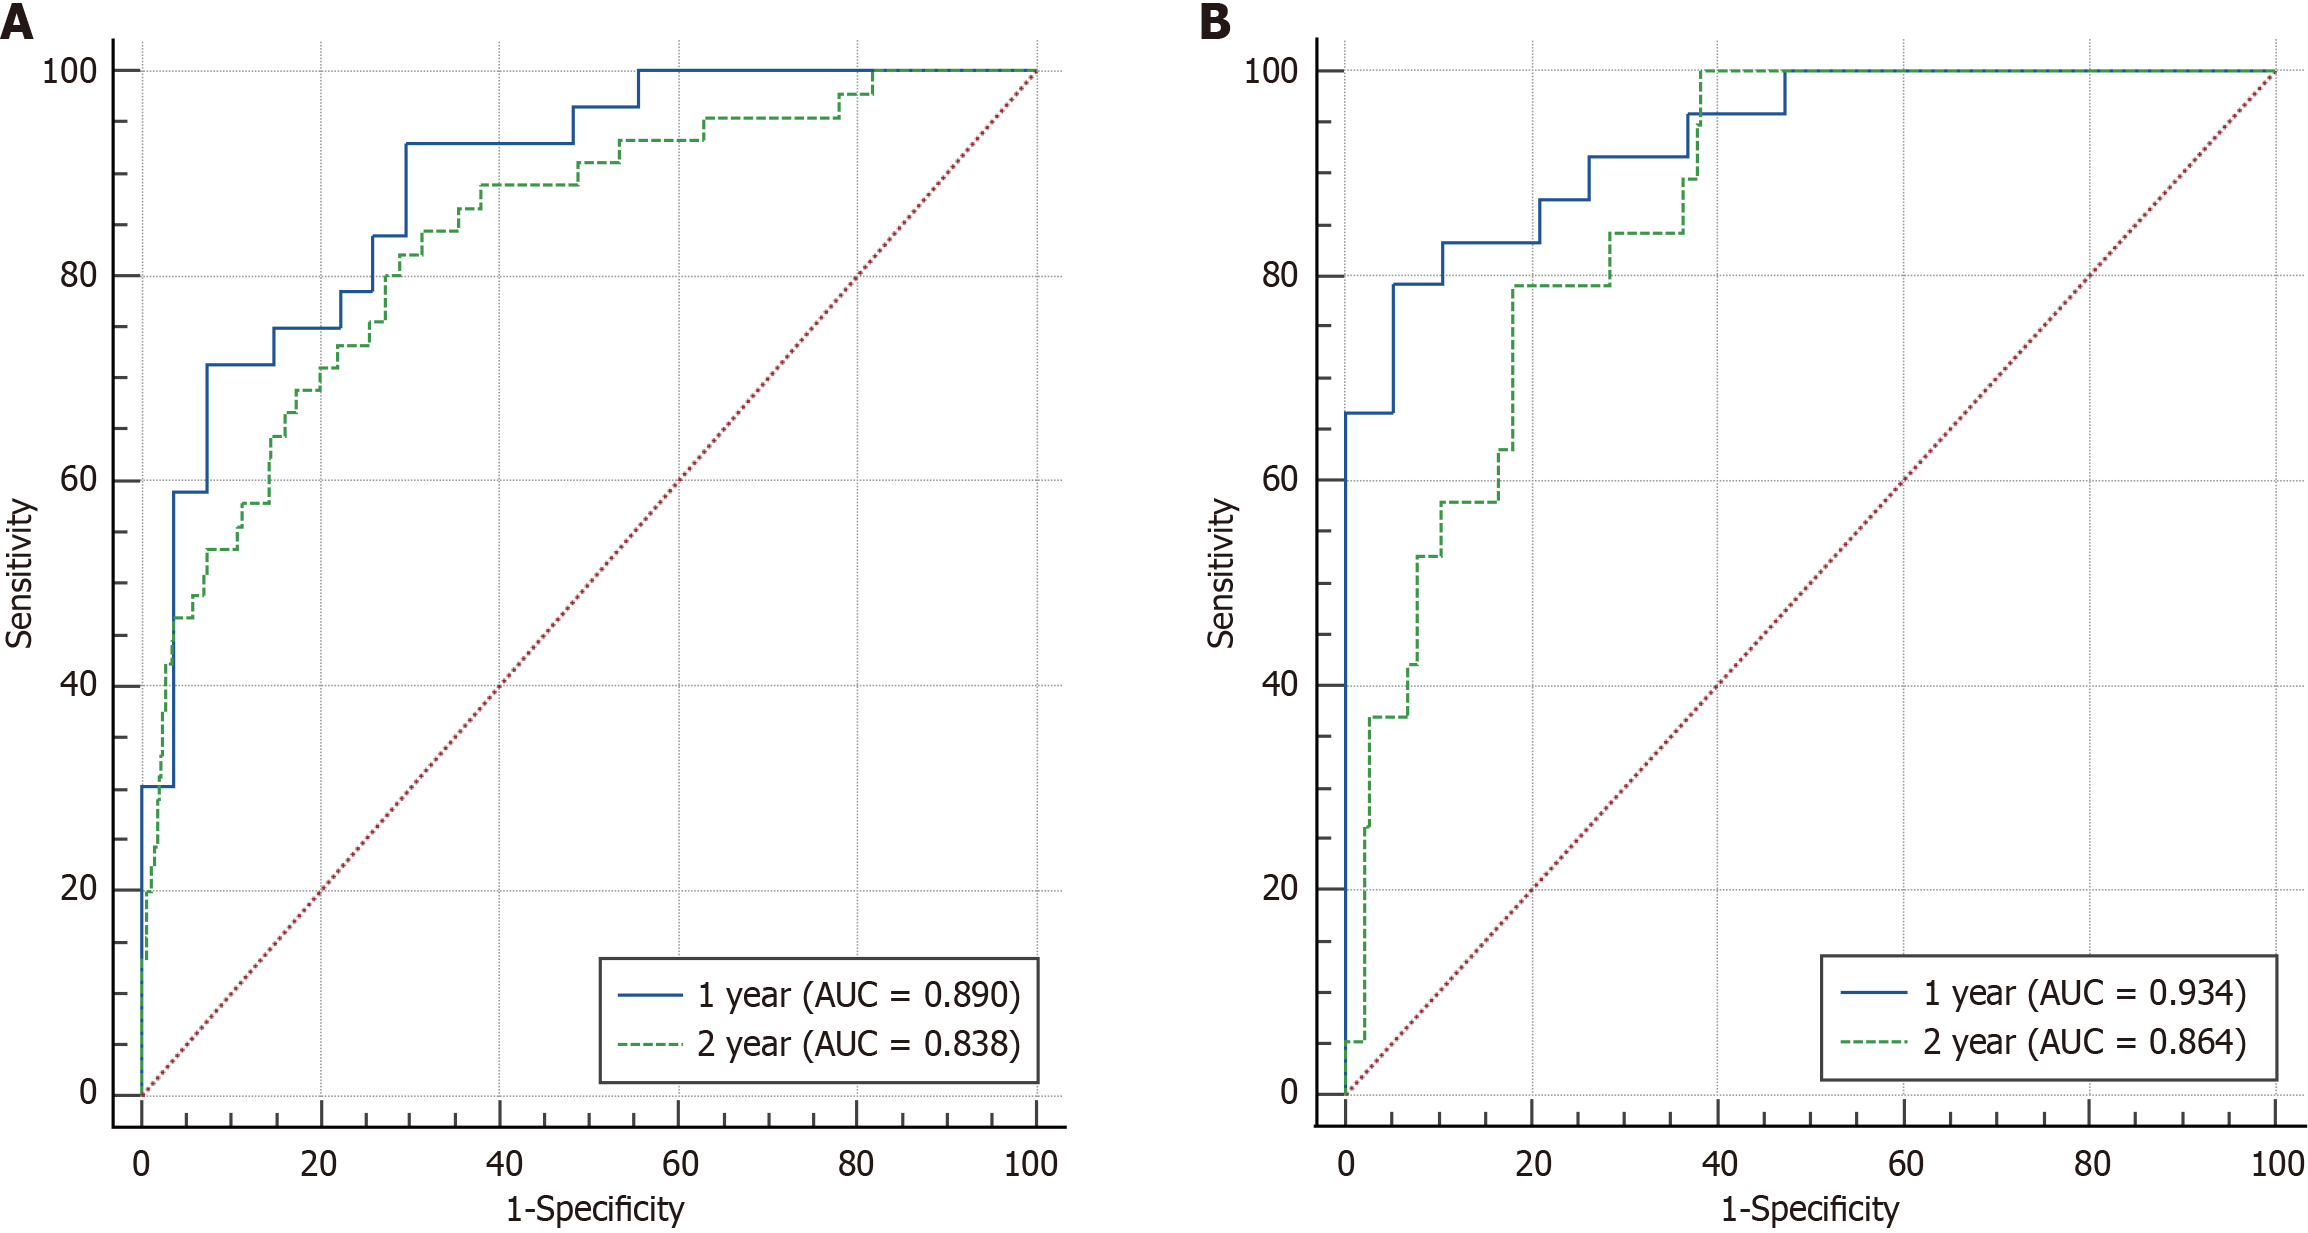
Figure 3 Receiver operating characteristic curves indicating the area under the curve for the nomogram model.
A: Training set; B: Validation set. AUC: Area under the curve.
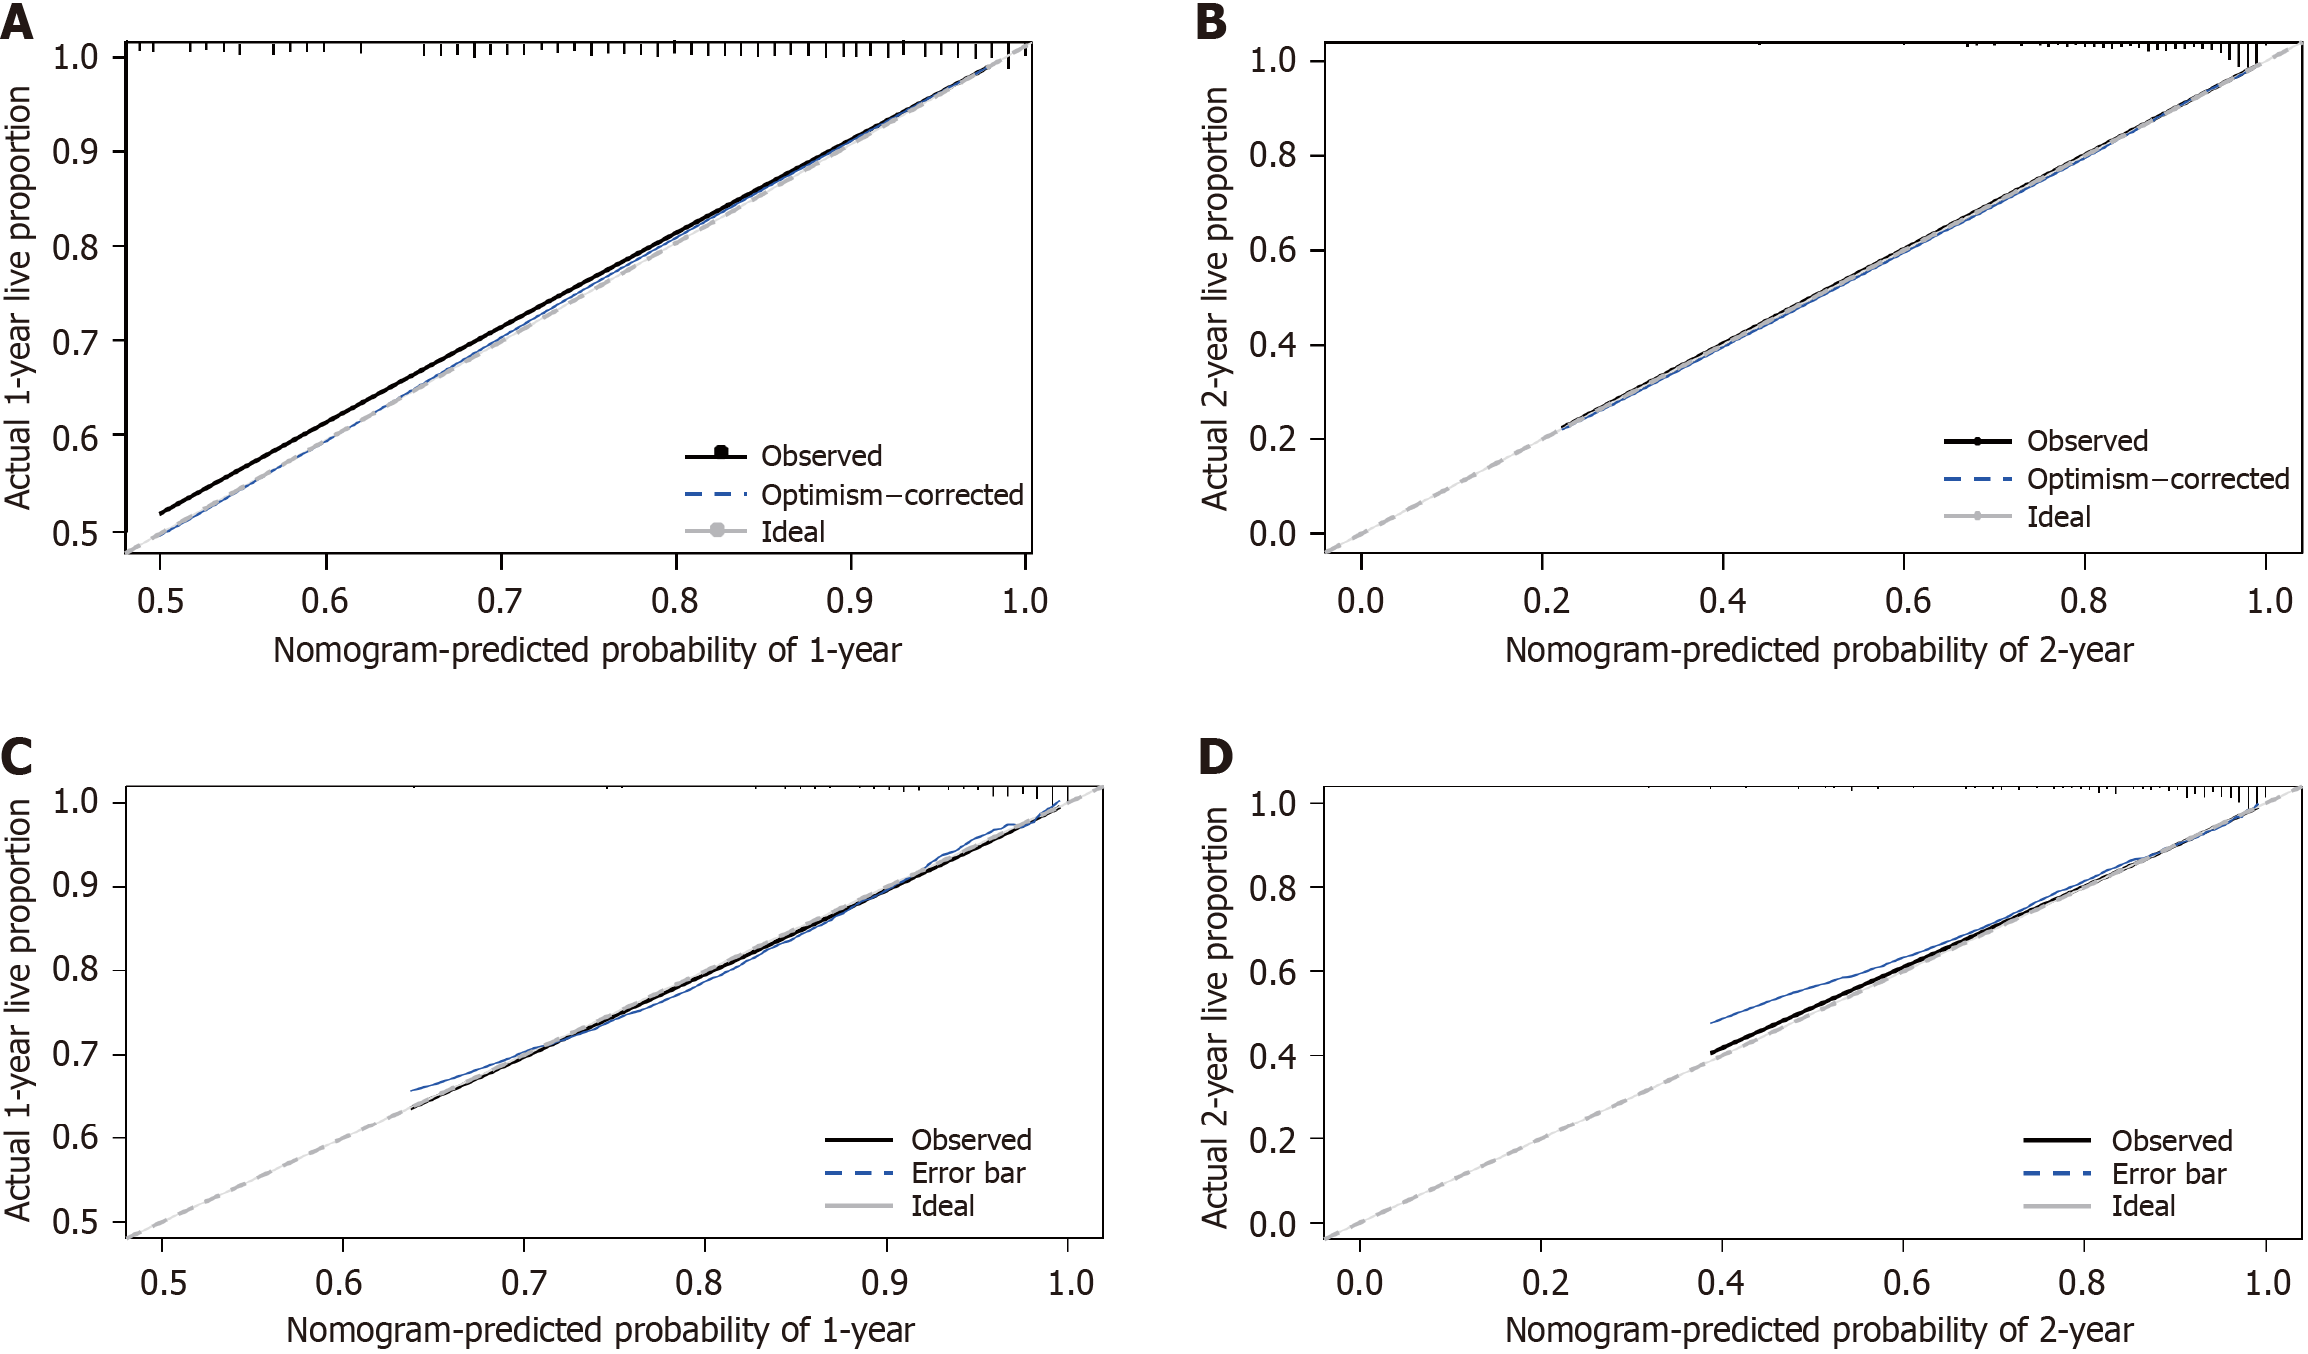
Figure 4 Calibration curves of the nomogram for predicting the 1-year and 2-year survival.
A and B: Calibration curves of the nomogram for predicting the 1-year and 2-year survival in the training set; C and D: Calibration curves of the nomogram for predicting the 1-year and 2-year survival in the validation set.
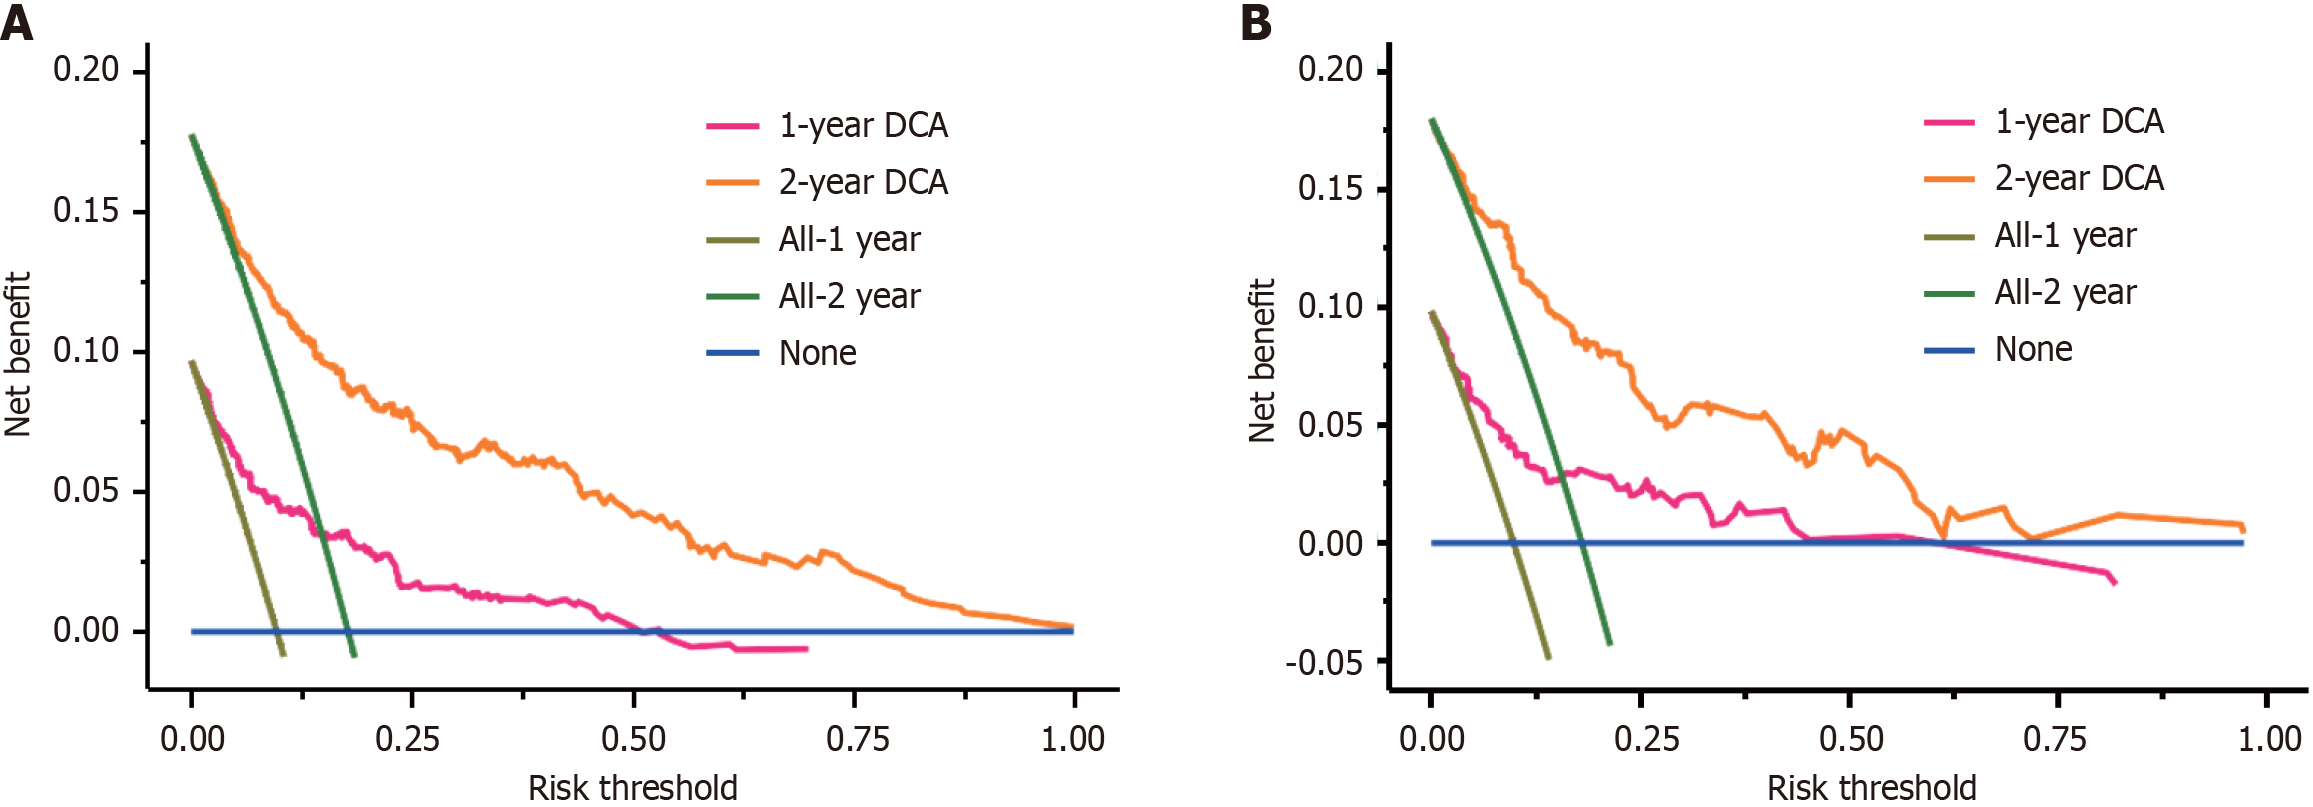
Figure 5 Decision curve analysis for the nomogram predicting the mortality.
A: Decision curve analysis for the nomogram predicting the mortality in the training set; B: Decision curve analysis for the nomogram predicting the mortality in the validation set. DCA: Decision curve analysis.
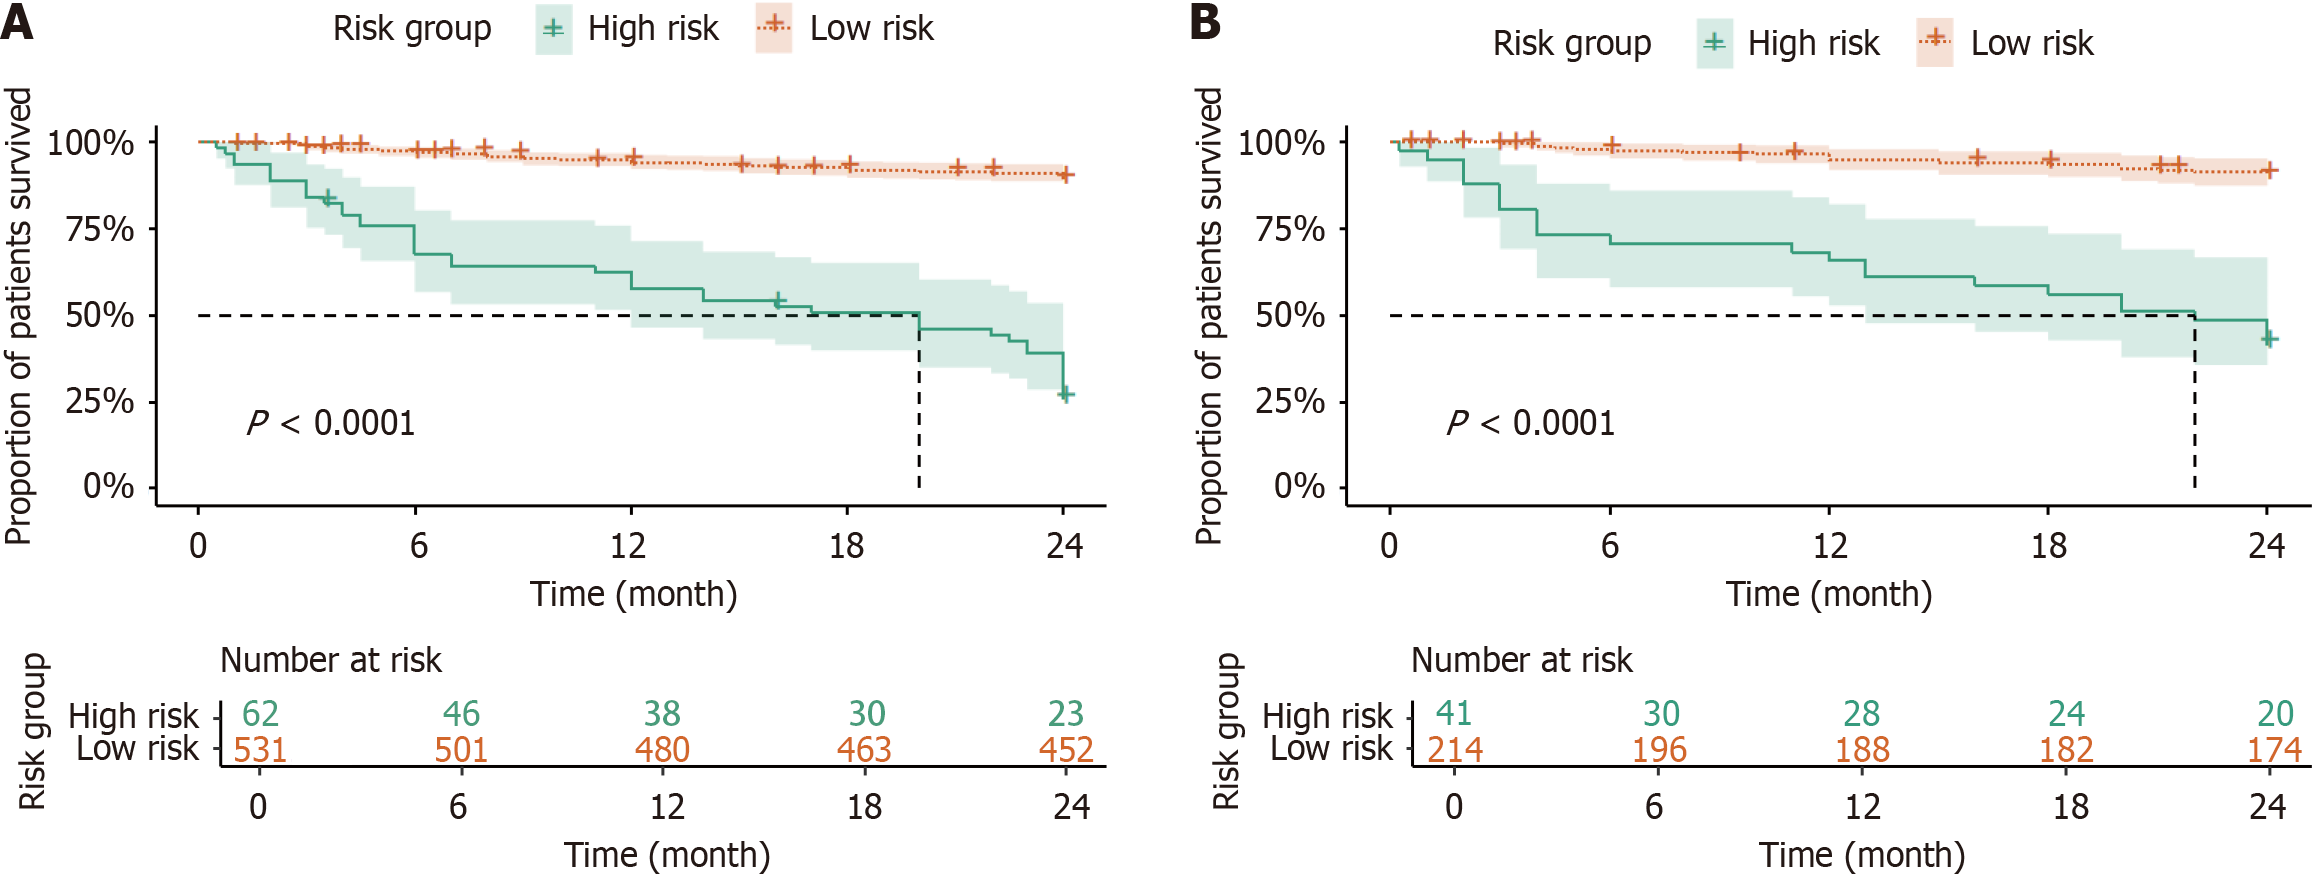
Figure 6 Kaplan-Meier survival curves comparing overall survival between high-risk and low-risk groups.
A: Kaplan-Meier survival curves comparing overall survival between high-risk and low-risk groups in the training cohort; B: Kaplan-Meier survival curves comparing overall survival between high-risk and low-risk groups in the validation cohort.
- Citation: Wang ZB, Zhu B, Meng MM, Wu YF, Zhang Y, Li DZ, Tian H, Wang FC, Lv YF, Ye QX, Liu FQ. Nomogram for predicting survival after transjugular intrahepatic portosystemic shunt in portal hypertension patients with bleeding. World J Gastrointest Surg 2025; 17(4): 104884
- URL: https://www.wjgnet.com/1948-9366/full/v17/i4/104884.htm
- DOI: https://dx.doi.org/10.4240/wjgs.v17.i4.104884


