Copyright
©The Author(s) 2025.
World J Gastrointest Surg. Apr 27, 2025; 17(4): 104615
Published online Apr 27, 2025. doi: 10.4240/wjgs.v17.i4.104615
Published online Apr 27, 2025. doi: 10.4240/wjgs.v17.i4.104615
Figure 1 Multivariable analysis indicating good liquefaction.
ALT: Alanine aminotransferase; OR: Odds ratio; CI: Confidence interval.
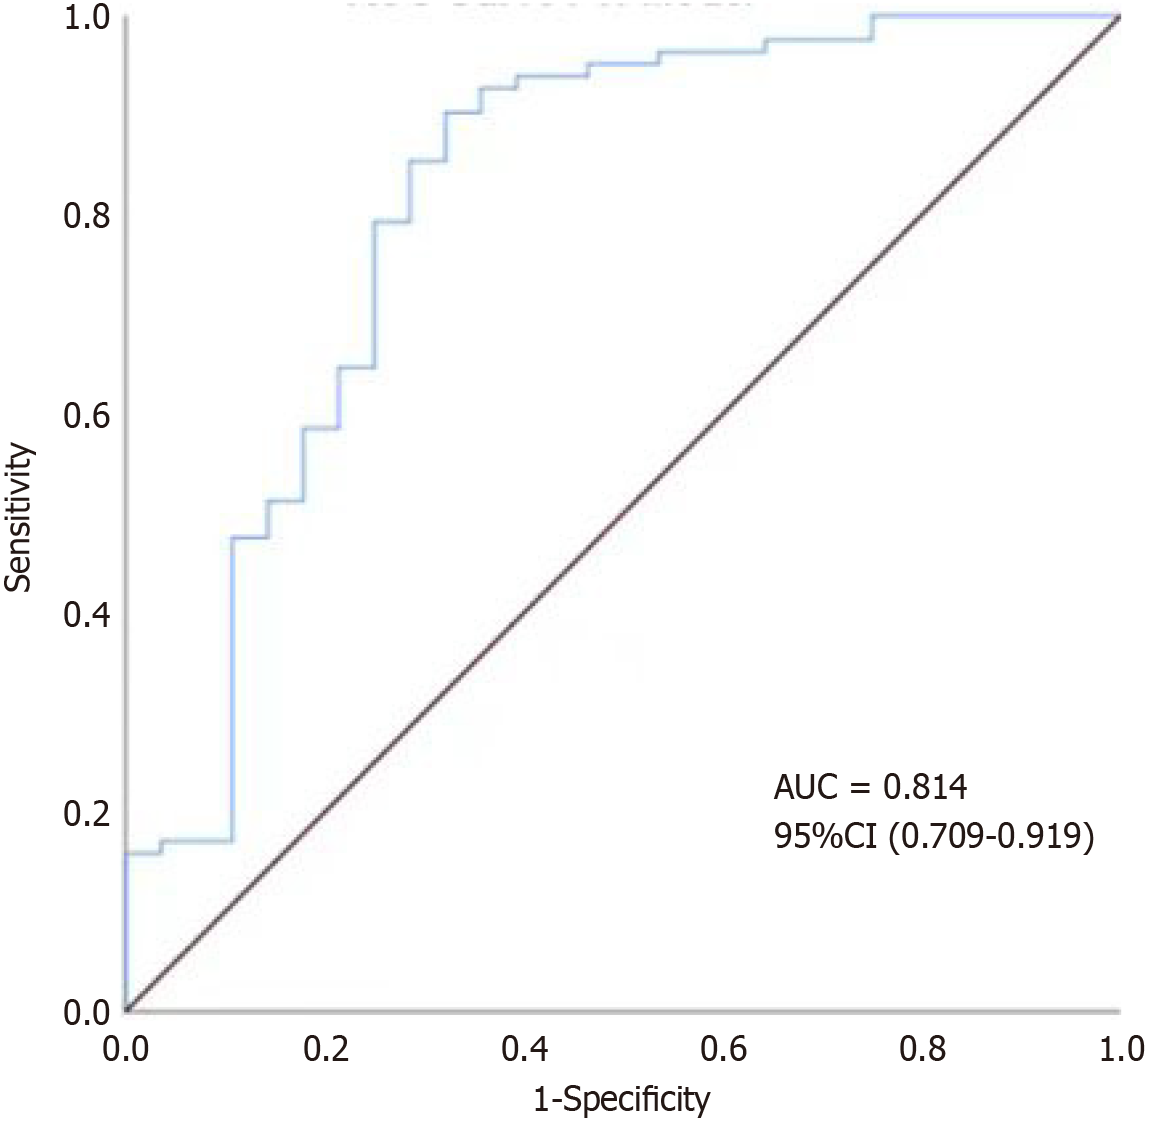
Figure 2 Receiver operating characteristic curve of the model.
AUC: Area under the curve; CI: Confidence interval.
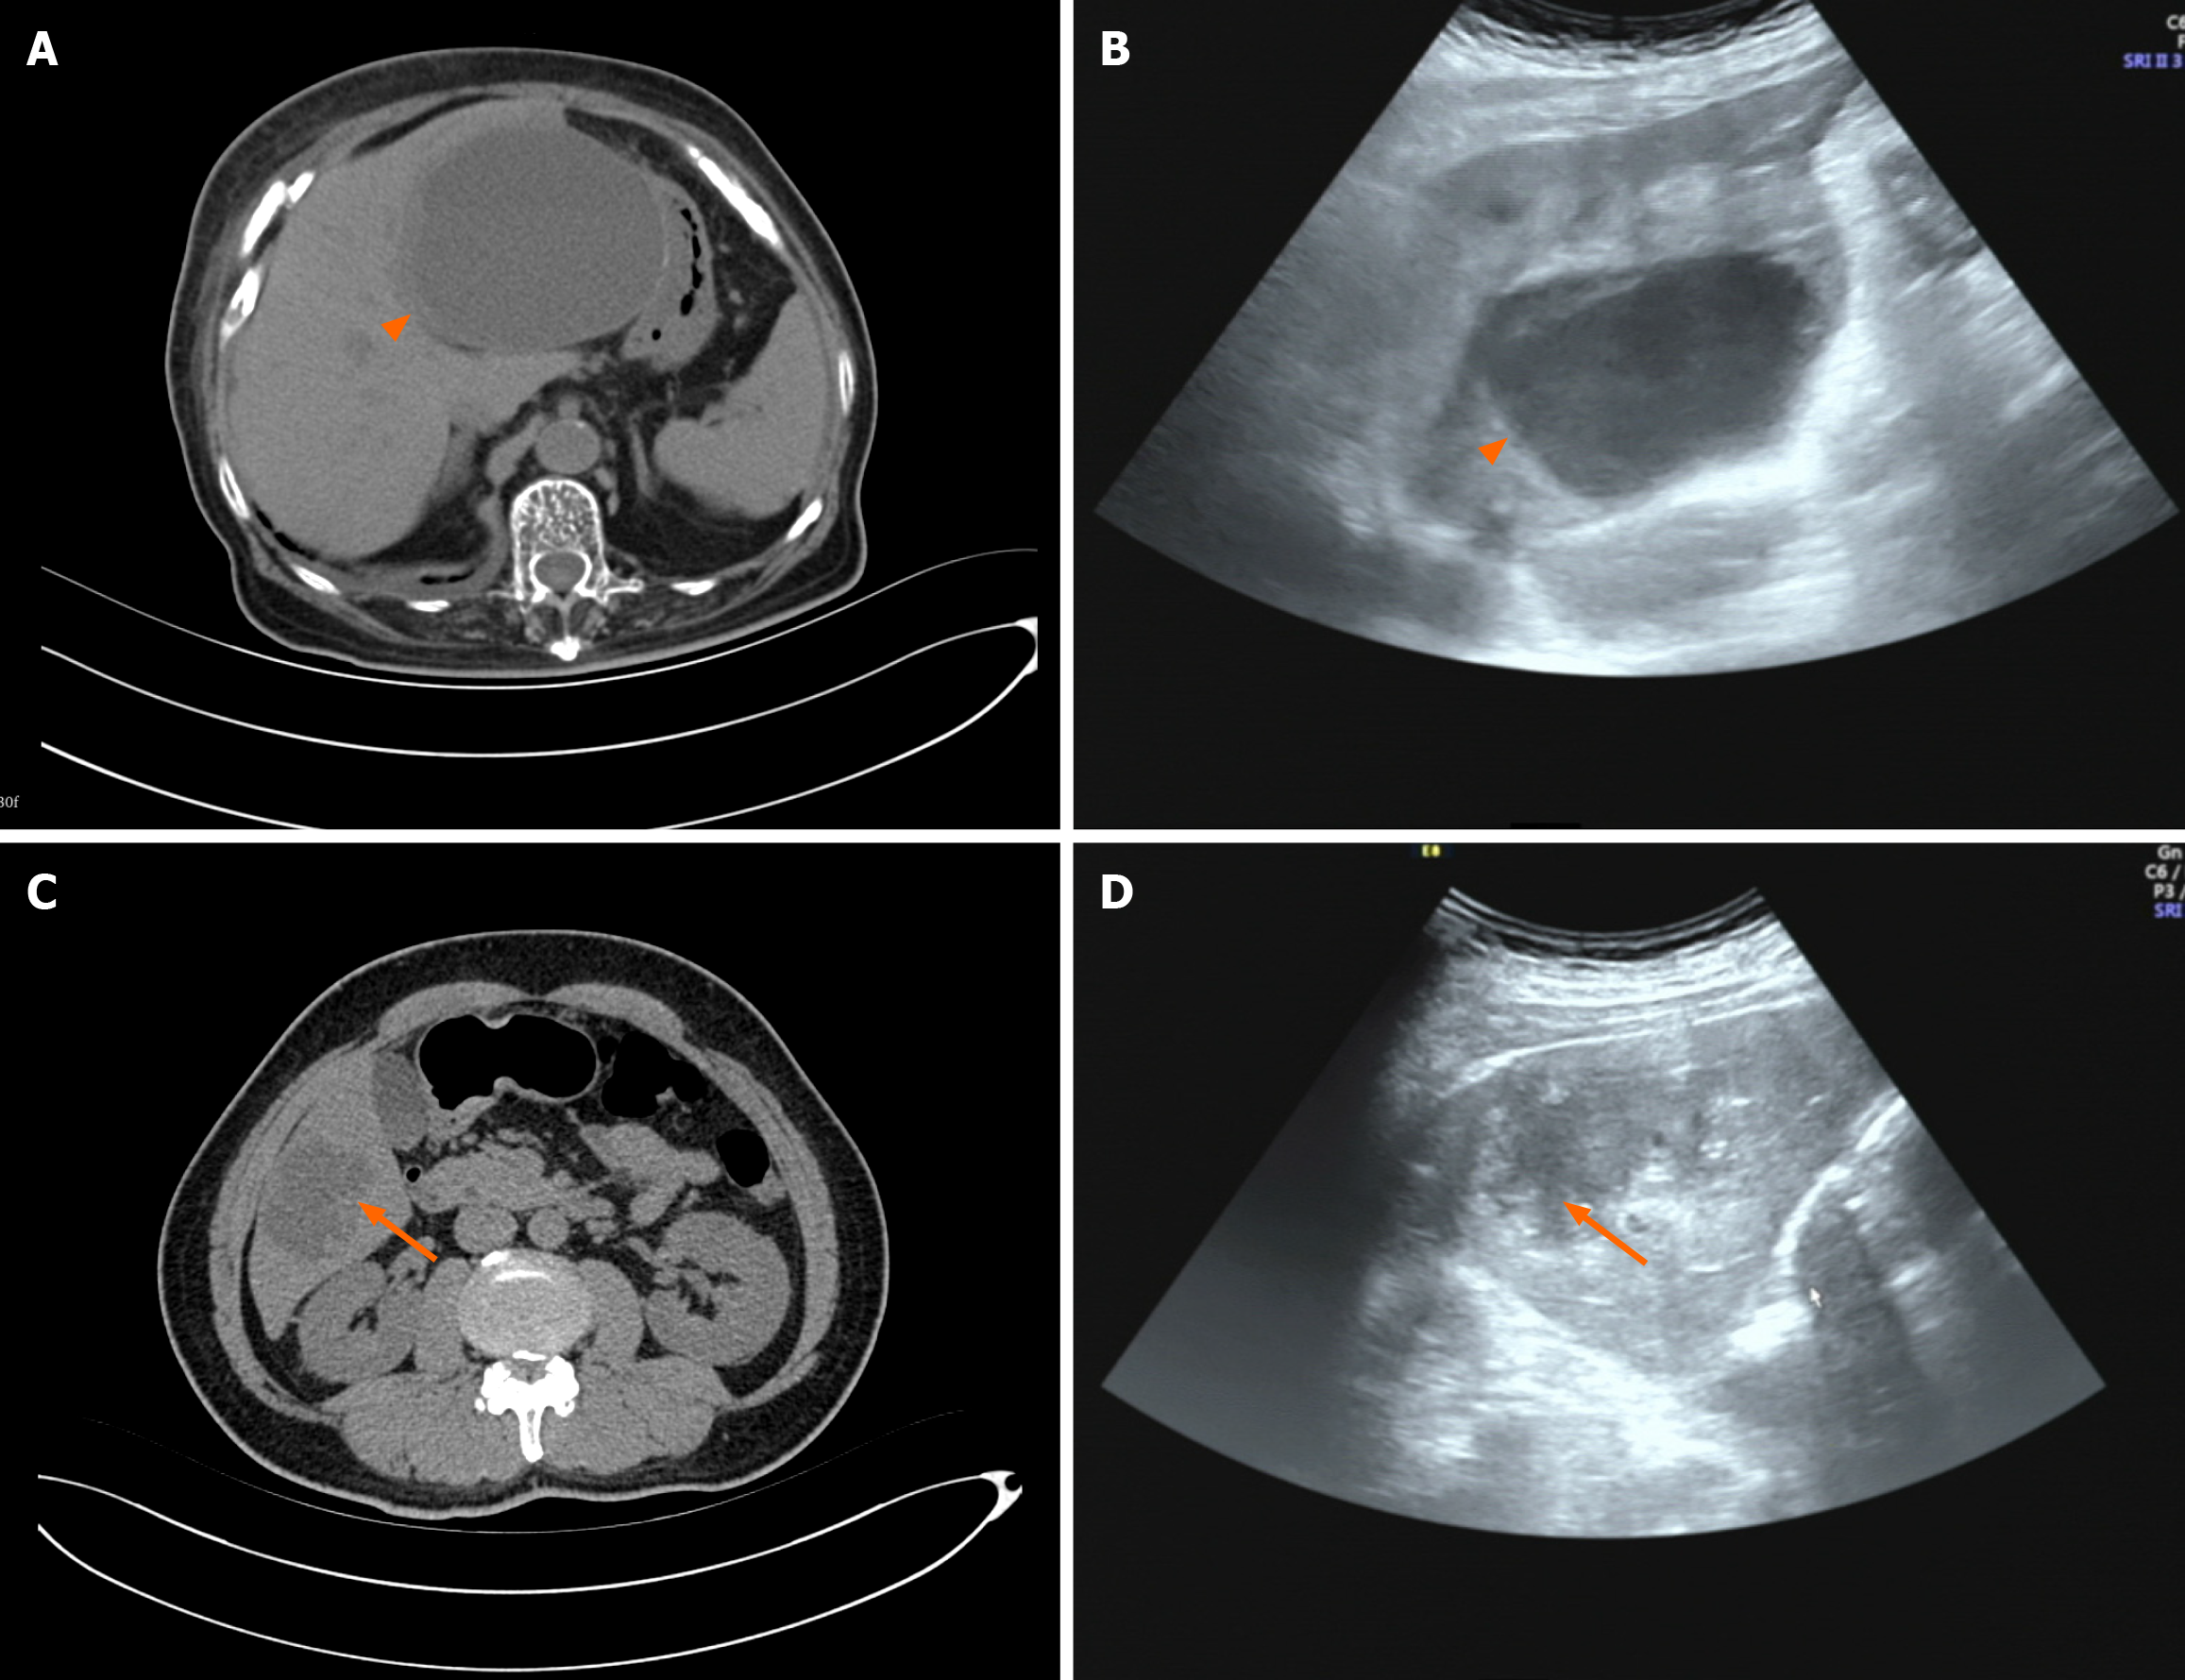
Figure 3 Elderly patients with diabetes and hypertension.
A and B: An elderly female patient; Computed tomography (CT) scan (A); Ultrasound (US) examination (B). These results were interpreted by two radiologists as showing well-formed liquefaction. The postoperative drainage volume was only 100 mL, with a ratio of 0.23 compared to the lesion volume; C and D: An elderly male patient; CT scan (C); US examination (D). The degree of liquefaction of the lesion is less than in A and B, but the postoperative drainage volume was 61 mL, with a ratio of 0.85 compared to the lesion volume.
- Citation: Long HY, Yan X, Meng JX, Xie F. Predictive factors for liver abscess liquefaction degree based on clinical, laboratory, and computed tomography data. World J Gastrointest Surg 2025; 17(4): 104615
- URL: https://www.wjgnet.com/1948-9366/full/v17/i4/104615.htm
- DOI: https://dx.doi.org/10.4240/wjgs.v17.i4.104615


