Copyright
©The Author(s) 2025.
World J Gastrointest Surg. Apr 27, 2025; 17(4): 103494
Published online Apr 27, 2025. doi: 10.4240/wjgs.v17.i4.103494
Published online Apr 27, 2025. doi: 10.4240/wjgs.v17.i4.103494
Figure 1 Single-cell transcriptome map.
A: Uniform manifold approximation and projection (UMAP) of cell types, with different colors representing different cell types; B: Visualization of cell dimension reduction in the modeling group and Xiaozhiling group, with different colors representing different groups; C: Bubble map of classic marker genes in each cell type; D: Cell proportion diagrams for the model group and Xiaozhiling group, with different colors representing different clusters; E: Analysis of large groups of differentially expressed genes in fibroblasts; F: UMAP of fibroblasts; G: UMAP of Xiaozhiling-treated fibroblasts; H: Proportions of fibroblasts in different groups; I: Volcano plot of differentially expressed genes (actin alpha 2, myosin heavy chain 1, myosin light chain kinase, and transgelin) in fibroblasts; J: Violin plot of classic fibroblast markers in each cluster; K: UMAP of classic fibroblast markers. UMAP: Uniform manifold approximation and projection; NK: Natural killer; TAGLN: Transgelin; ACTA2: Actin alpha 2; MYH11: Myosin heavy chain 1, MYLK: Myosin light chain kinase; CK: Control group.
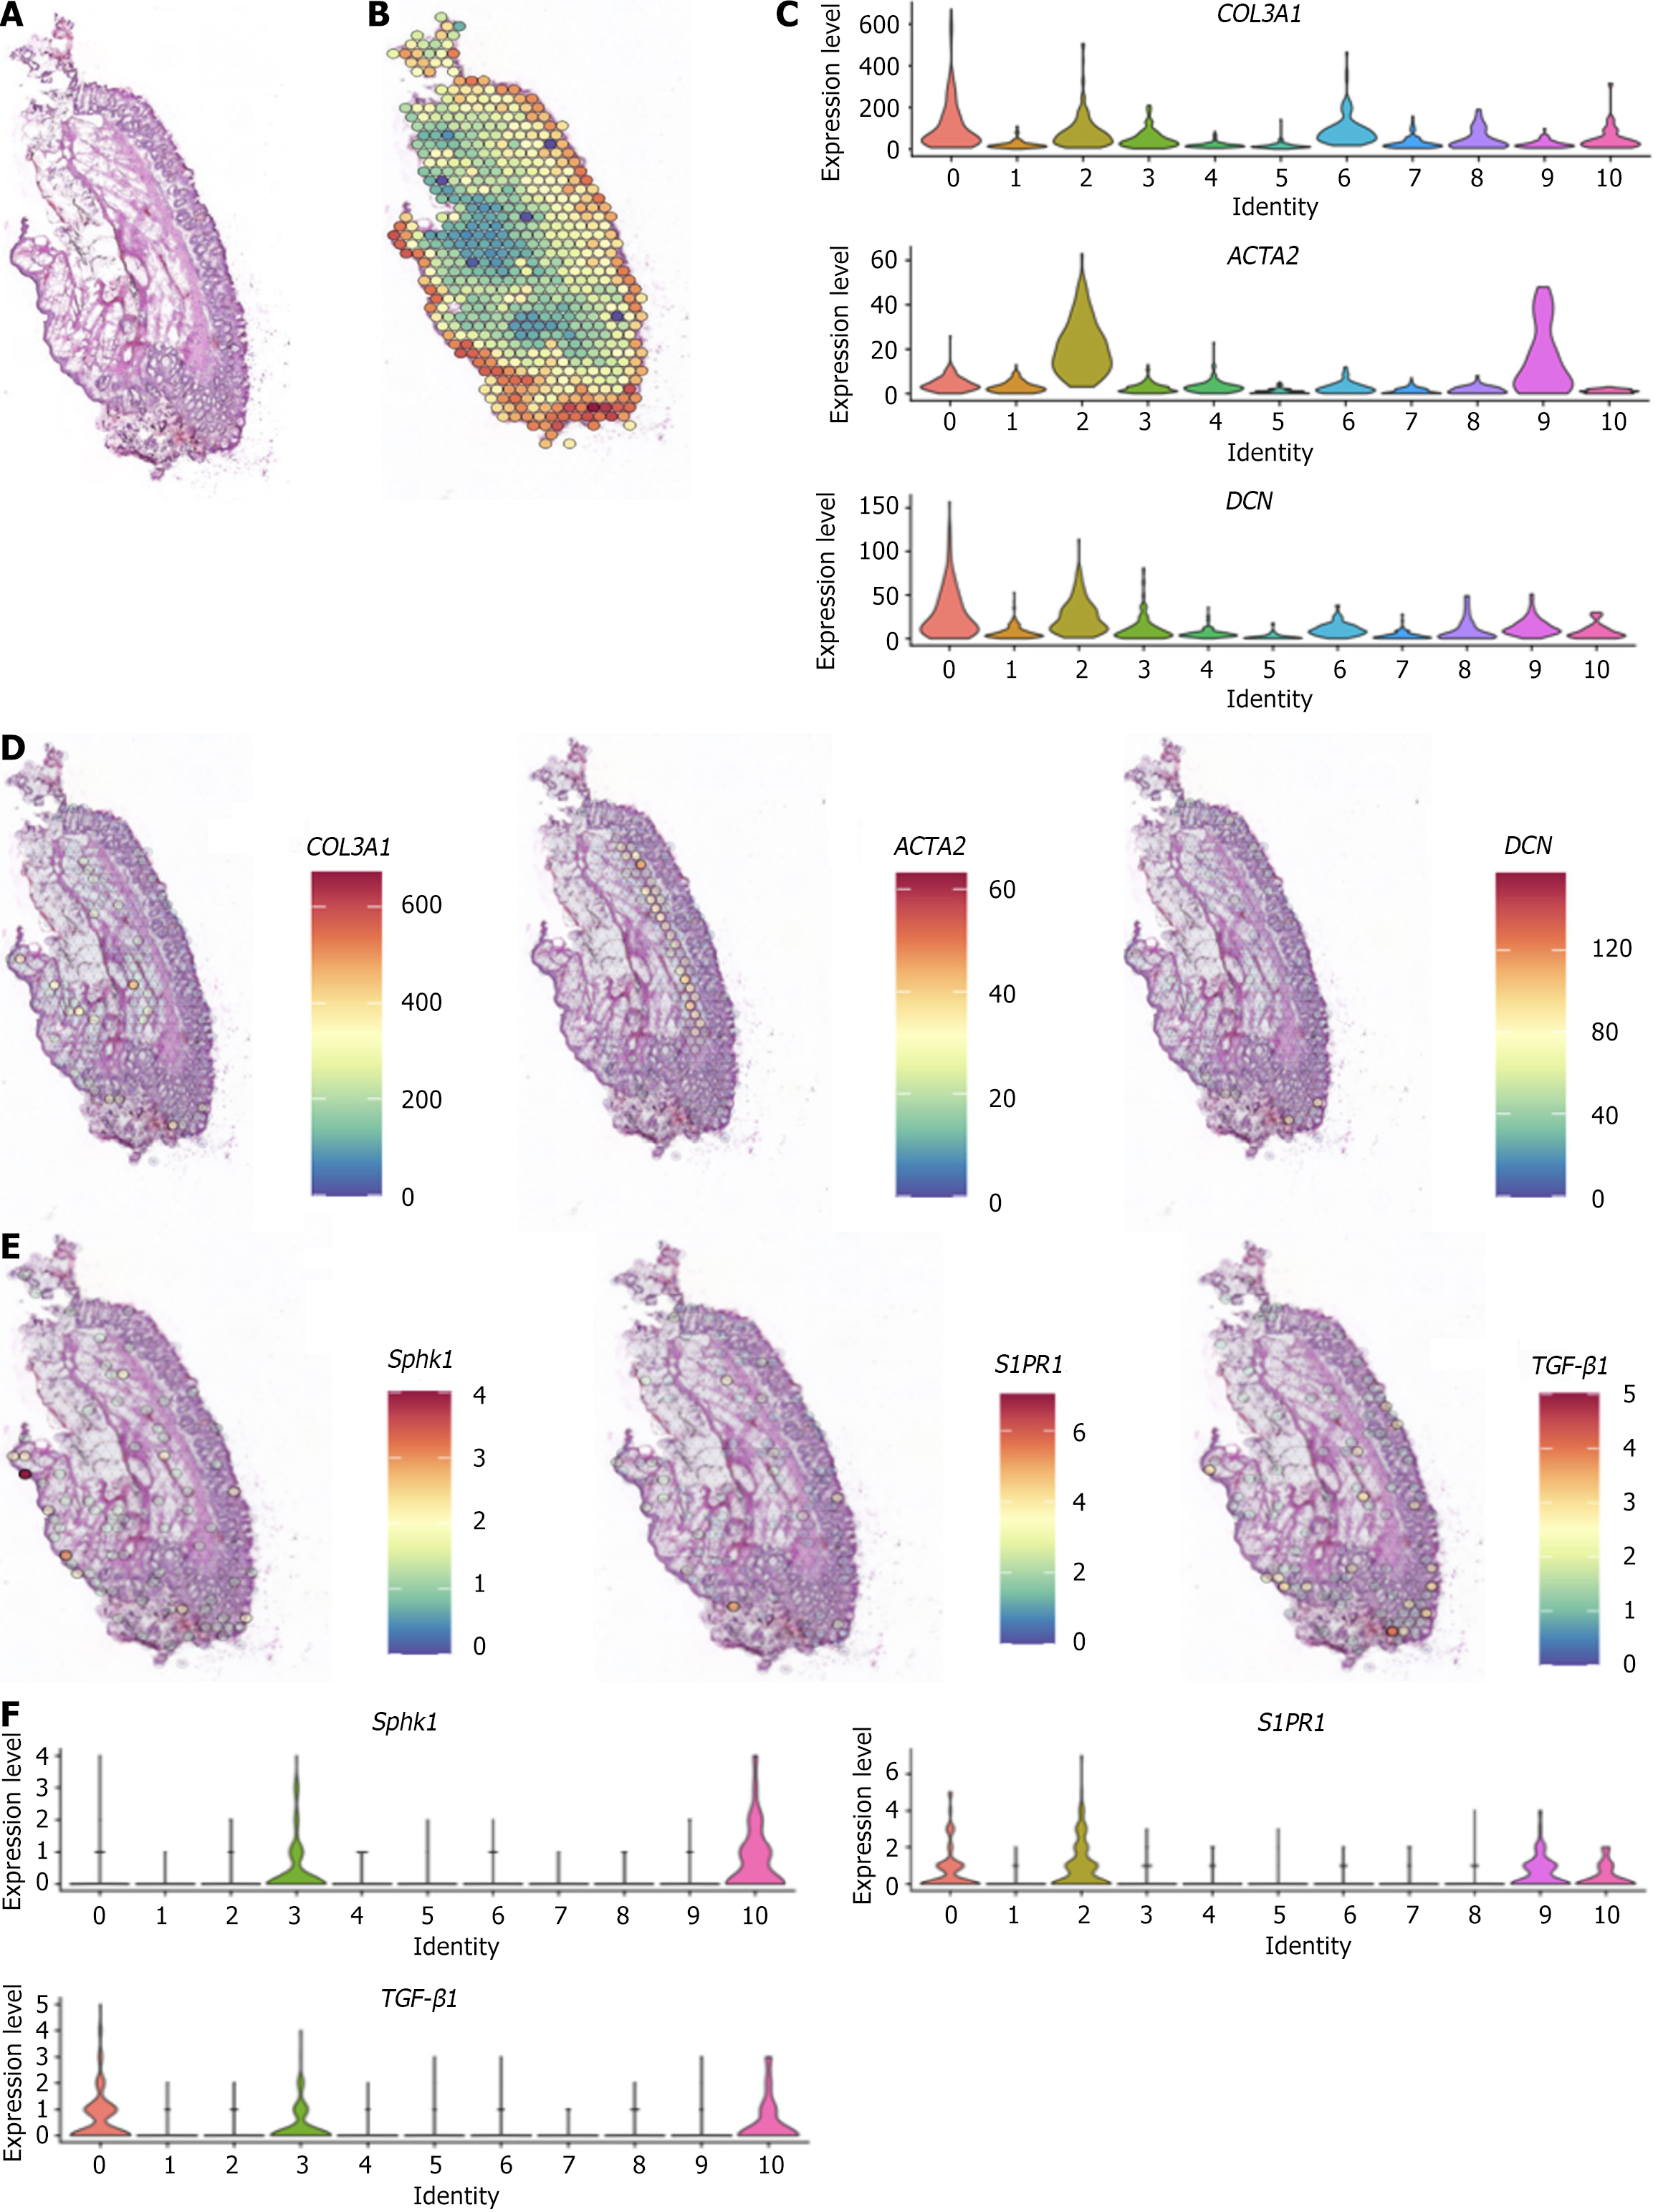
Figure 2 Spatial transcriptome map of internal hemorrhoid tissue.
A: Hematoxylin and eosin-stained section of internal hemorrhoid tissue; B: Spatial transcriptome; C: Differences in expression of the classic marker genes collagen 3 alpha 1, decorin, and actin alpha 2 in fibroblasts; D: Spatial localization of the classic marker genes collagen 3 alpha 1, decorin, and actin alpha 2 in fibroblasts; E: Spatial distribution of sphingosine kinase 1, sphingosine-1-phosphate receptor 1, and transforming growth factor-β1; F: Differences in gene expression of sphingosine kinase 1, sphingosine-1-phosphate receptor 1, and transforming growth factor-β1. COL3A1: Collagen 3 alpha 1; DCN: Decorin; ACTA2: Actin alpha 2; Sphk1: Sphingosine kinase 1; S1PR1: Sphingosine-1-phosphate receptor 1; TGF-β1: Transforming growth factor-β1.
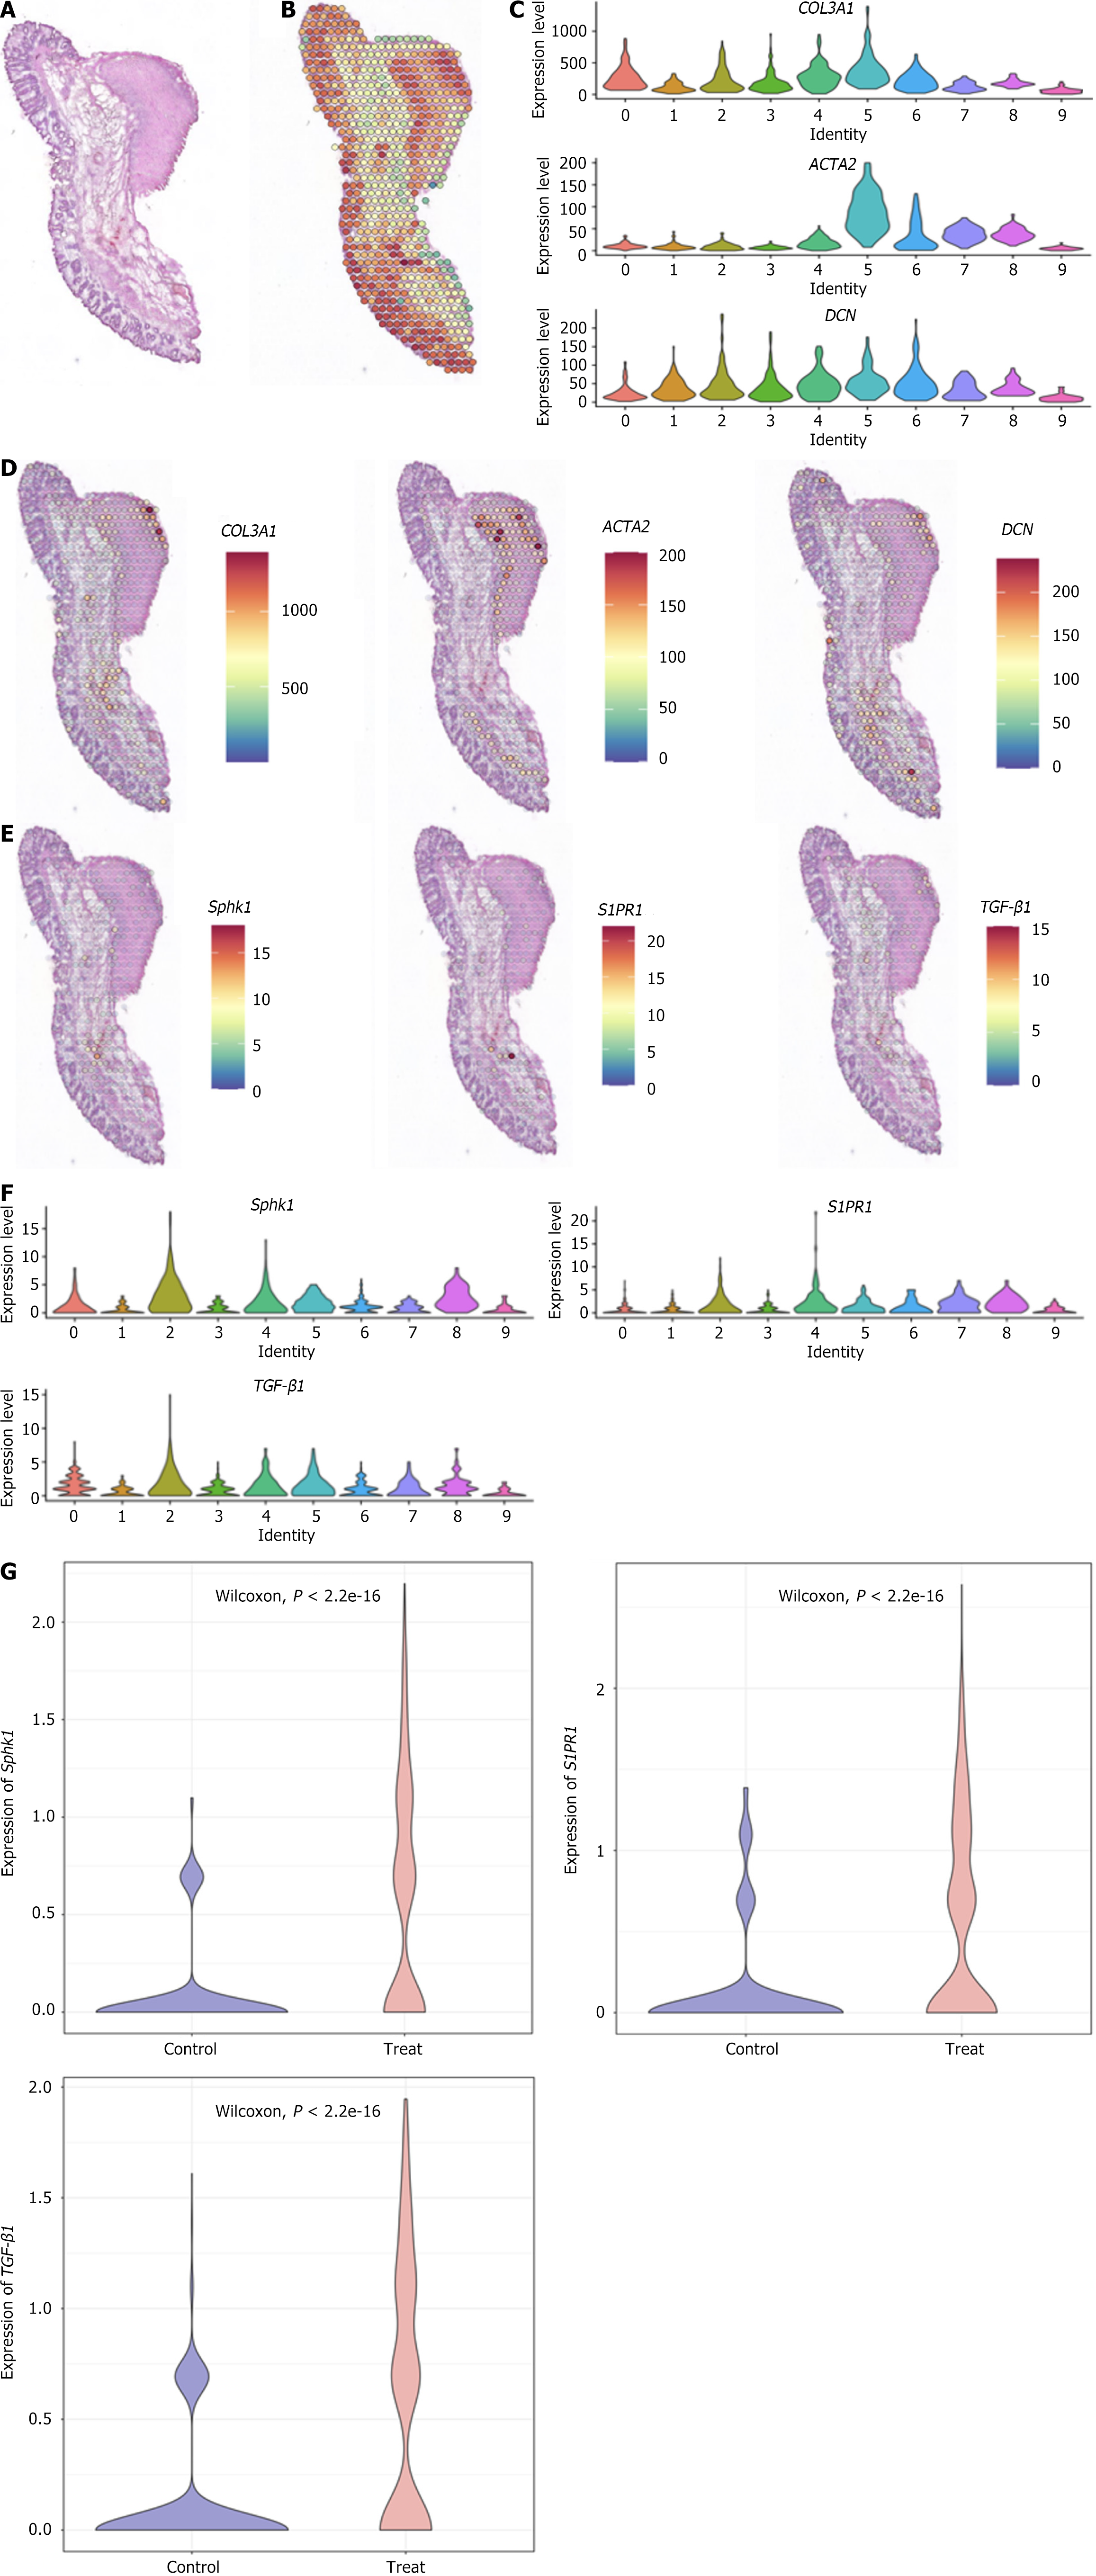
Figure 3 Spatial transcriptome.
A: Hematoxylin and eosin-stained section 1 week after Xiaozhiling injection; B: Spatial transcriptome; C: Differences in expression of the classic fibroblast marker genes collagen 3 alpha 1, decorin, and actin alpha 2 in different clusters; D: Spatial localization of the classic fibroblast marker genes collagen 3 alpha 1, decorin, and actin alpha 2; E: Spatial localization of sphingosine kinase 1, sphingosine-1-phosphate receptor 1, and transforming growth factor-β1; F: Differences in expression of sphingosine kinase 1, sphingosine-1-phosphate receptor 1, and transforming growth factor-β1 in different clusters; G: Analysis of differences between the two groups. COL3A1: Collagen 3 alpha 1; DCN: Decorin; ACTA2: Actin alpha 2; Sphk1: Sphingosine kinase 1; S1PR1: Sphingosine-1-phosphate receptor 1; TGF-β1: Transforming growth factor-β1.
Figure 4 Transmission electron microscopy.
A: Transmission electron microscopy (× 5000) of eosinophils, mast cells, fibroblasts, lymphocytes, and fiber bundles 1 week after Xiaozhiling injection treatment; B: Transmission electron microscopy (× 10000) of active endoplasmic reticulum of fibroblasts 1 week after Xiaozhiling injection, with abundant glycogen attached to the endoplasmic reticulum. EOS: Eosinophil; MC: Mast cell; FB: Fibroblast; LYM: Lymphocyte; CF: Fiber bundles.
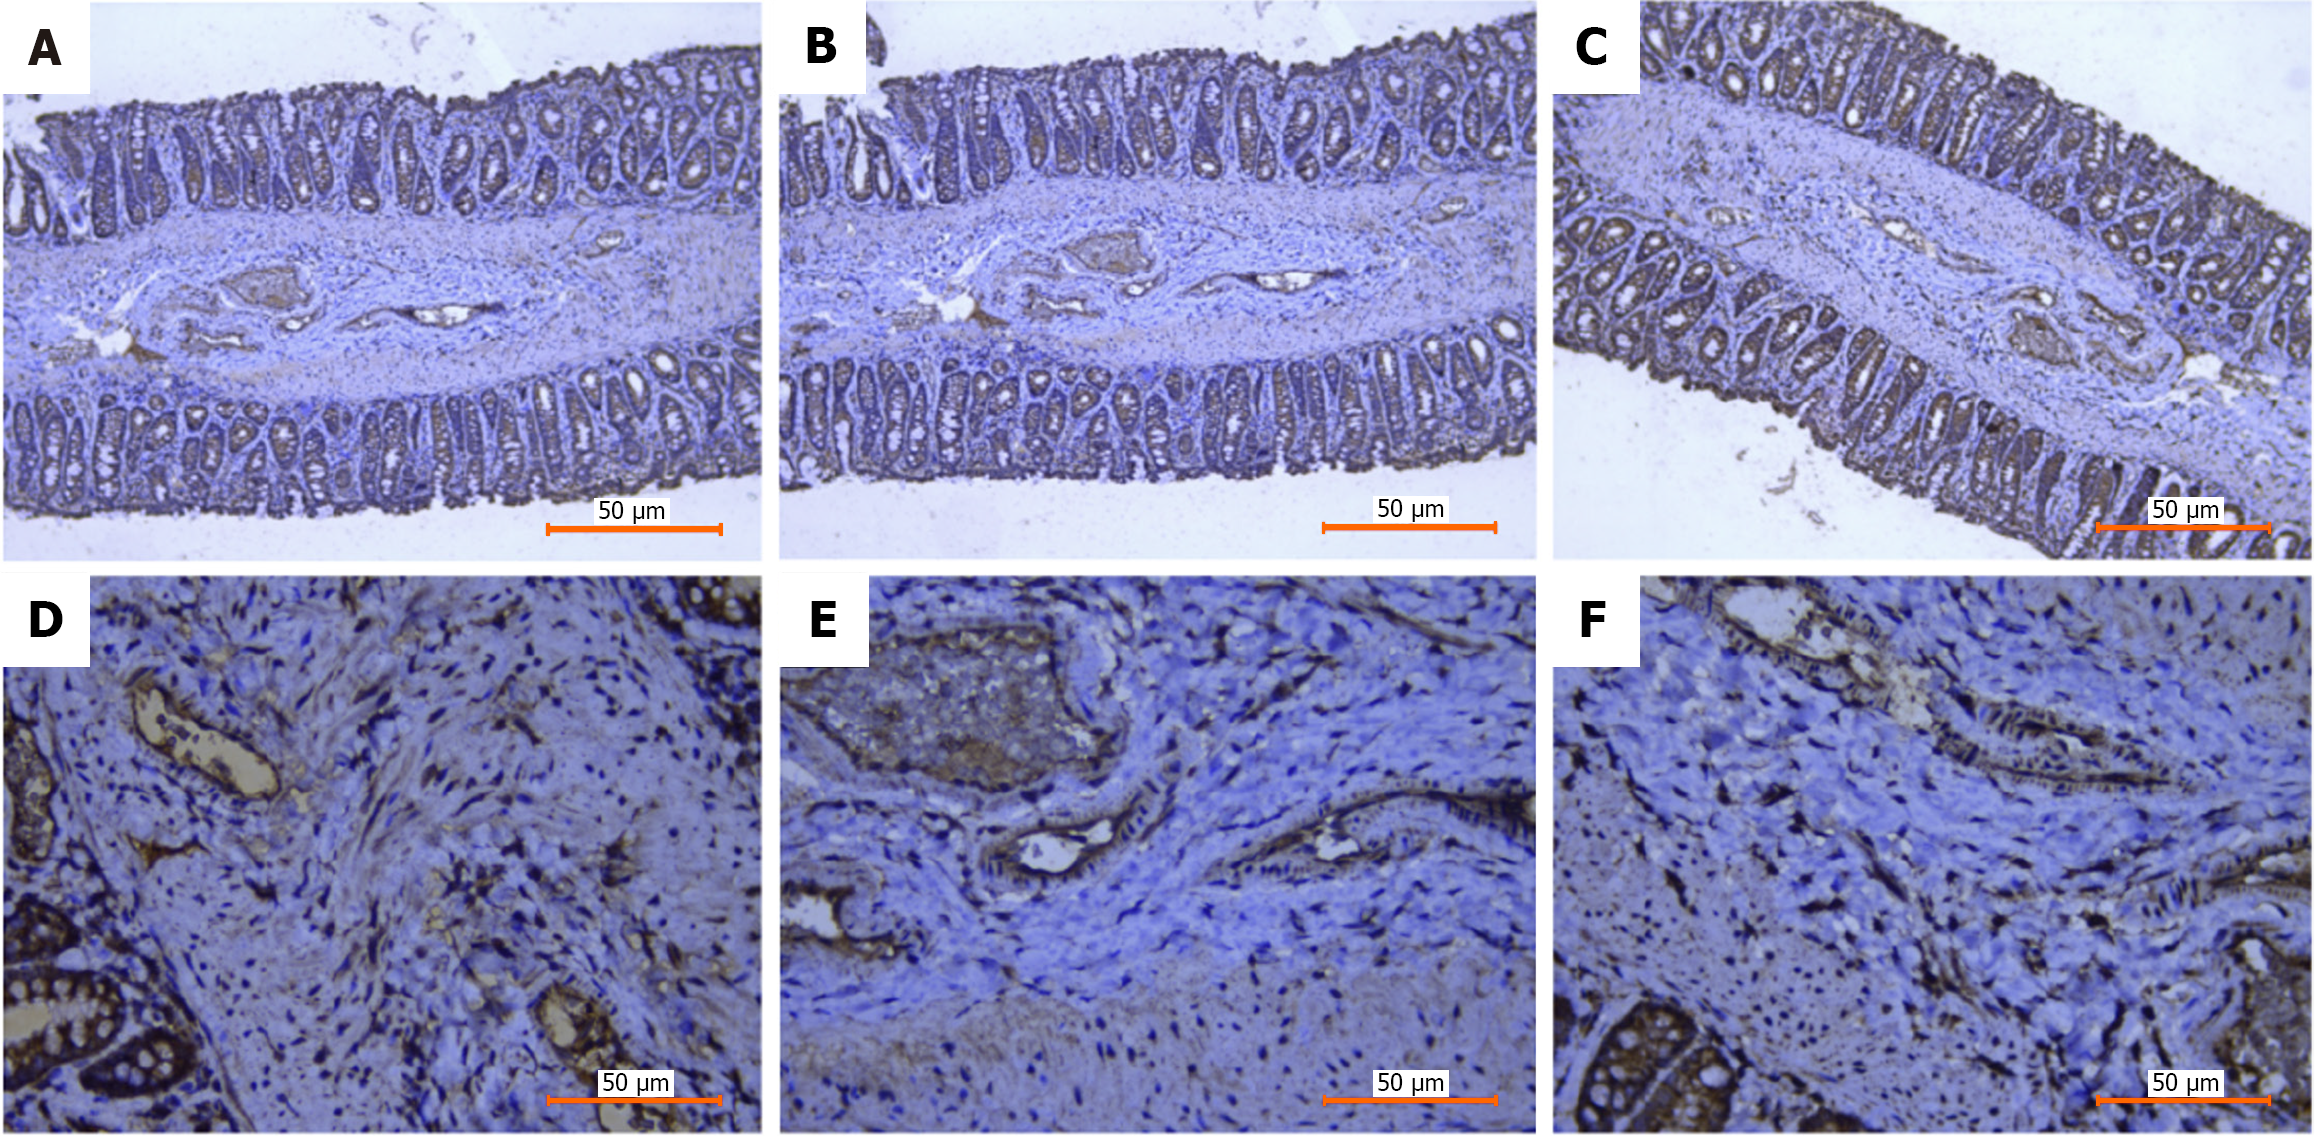
Figure 5 Immunohistochemical staining of internal hemorrhoid tissue.
A: Sphingosine kinase 1 (100 ×); B: Sphingosine-1-phosphate receptor 1 (100 ×); C: Transforming growth factor-β1 (100 ×); D: Sphingosine kinase 1 (400 ×); E: Sphingosine-1-phosphate receptor 1 (400 ×); F: Transforming growth factor-β1 (400 ×).
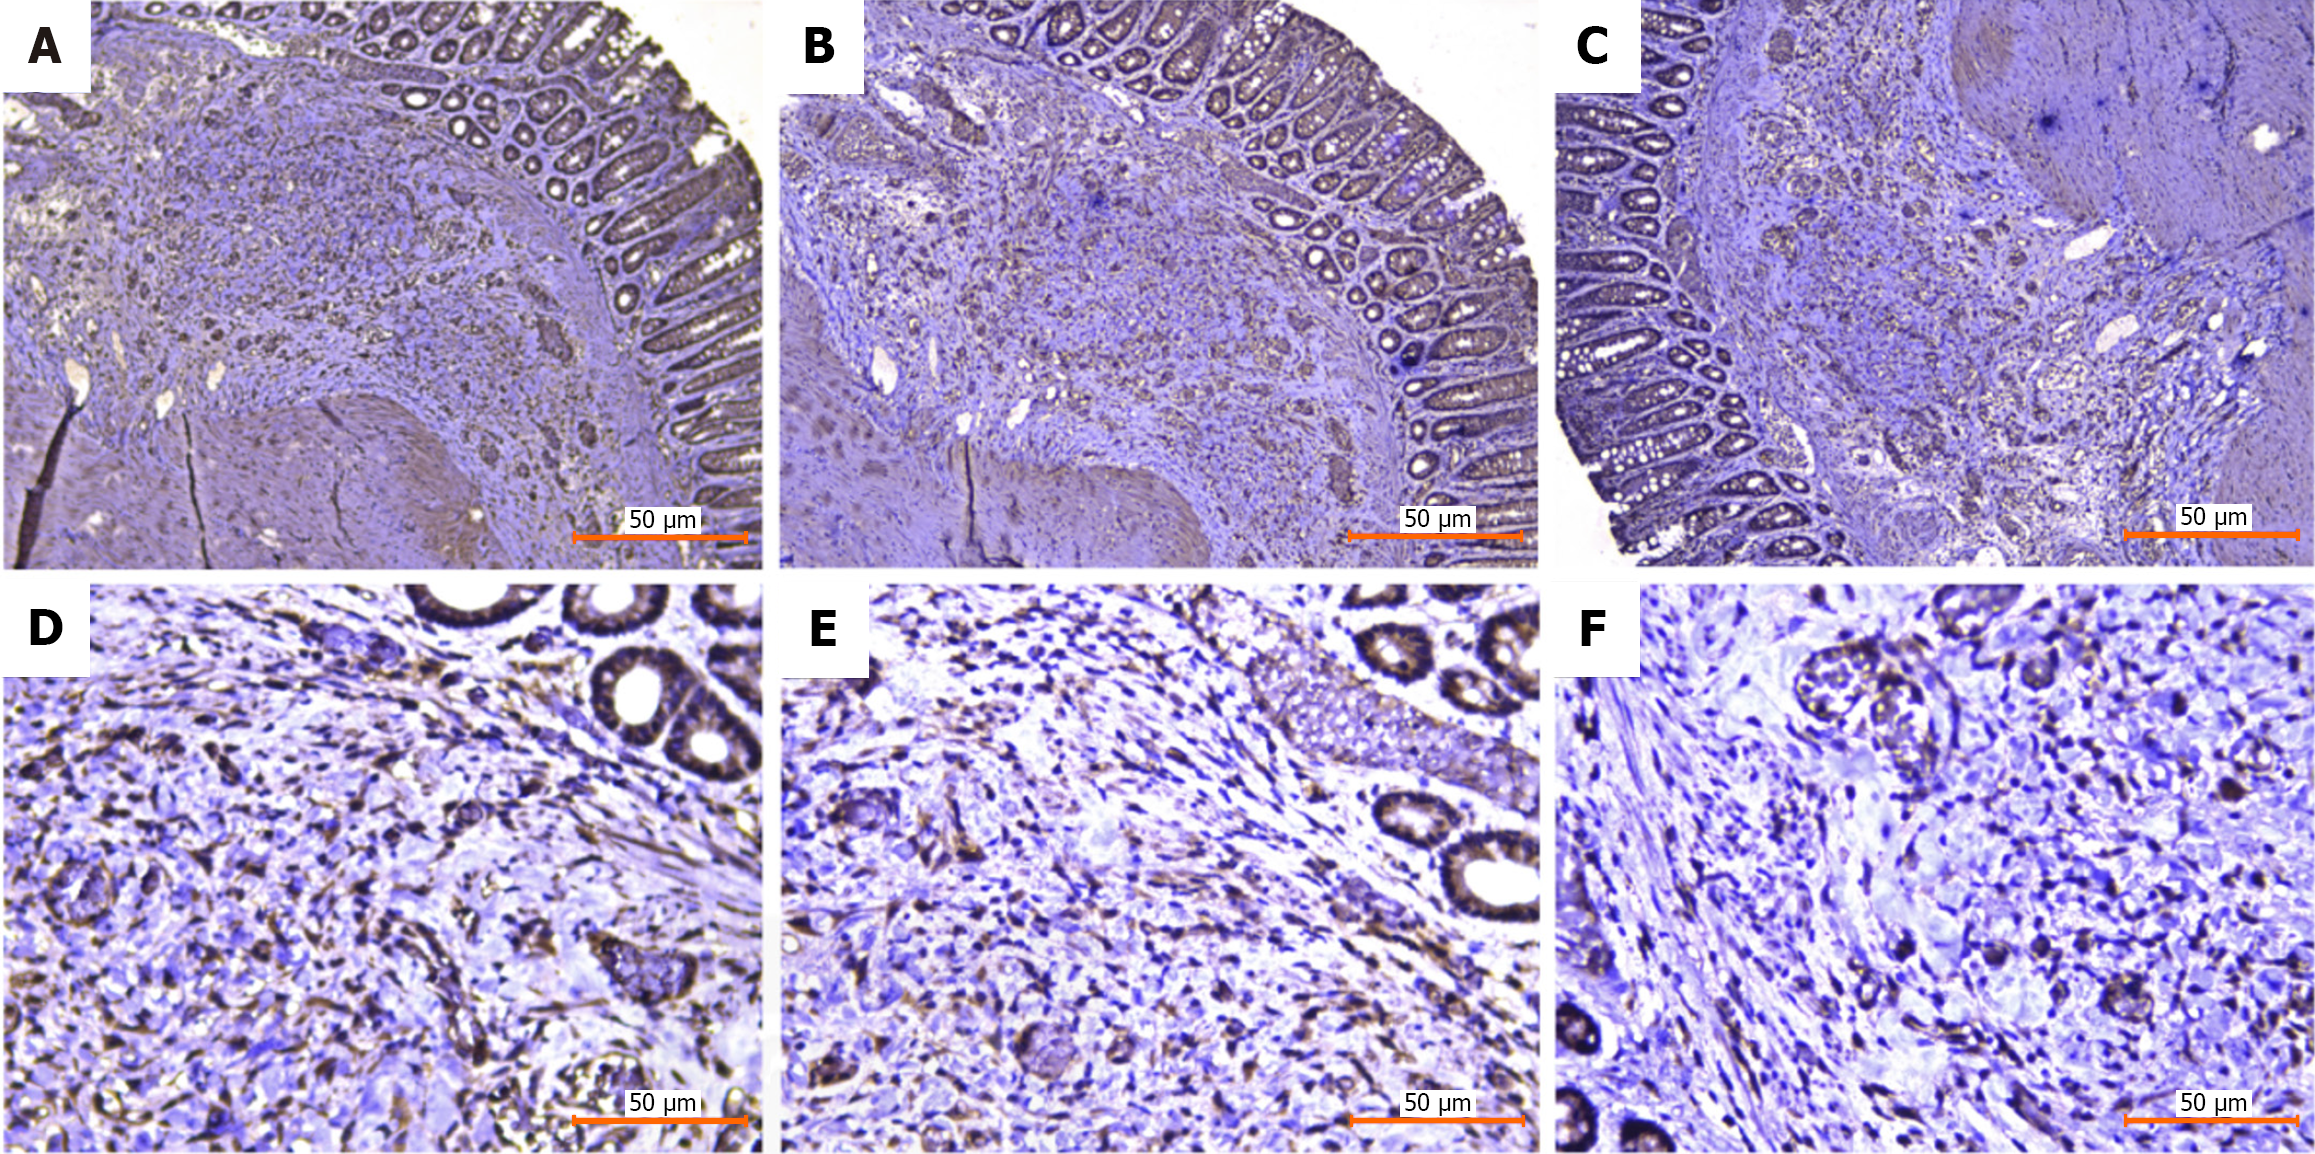
Figure 6 Immunohistochemical staining.
A: Sphingosine kinase 1 (100 ×); B: Sphingosine-1-phosphate receptor 1 (100 ×); C: Transforming growth factor-β1 (100 ×); D: Sphingosine kinase 1 (400 ×); E: Sphingosine-1-phosphate receptor 1 (400 ×); F: Transforming growth factor-β1 (400 ×).
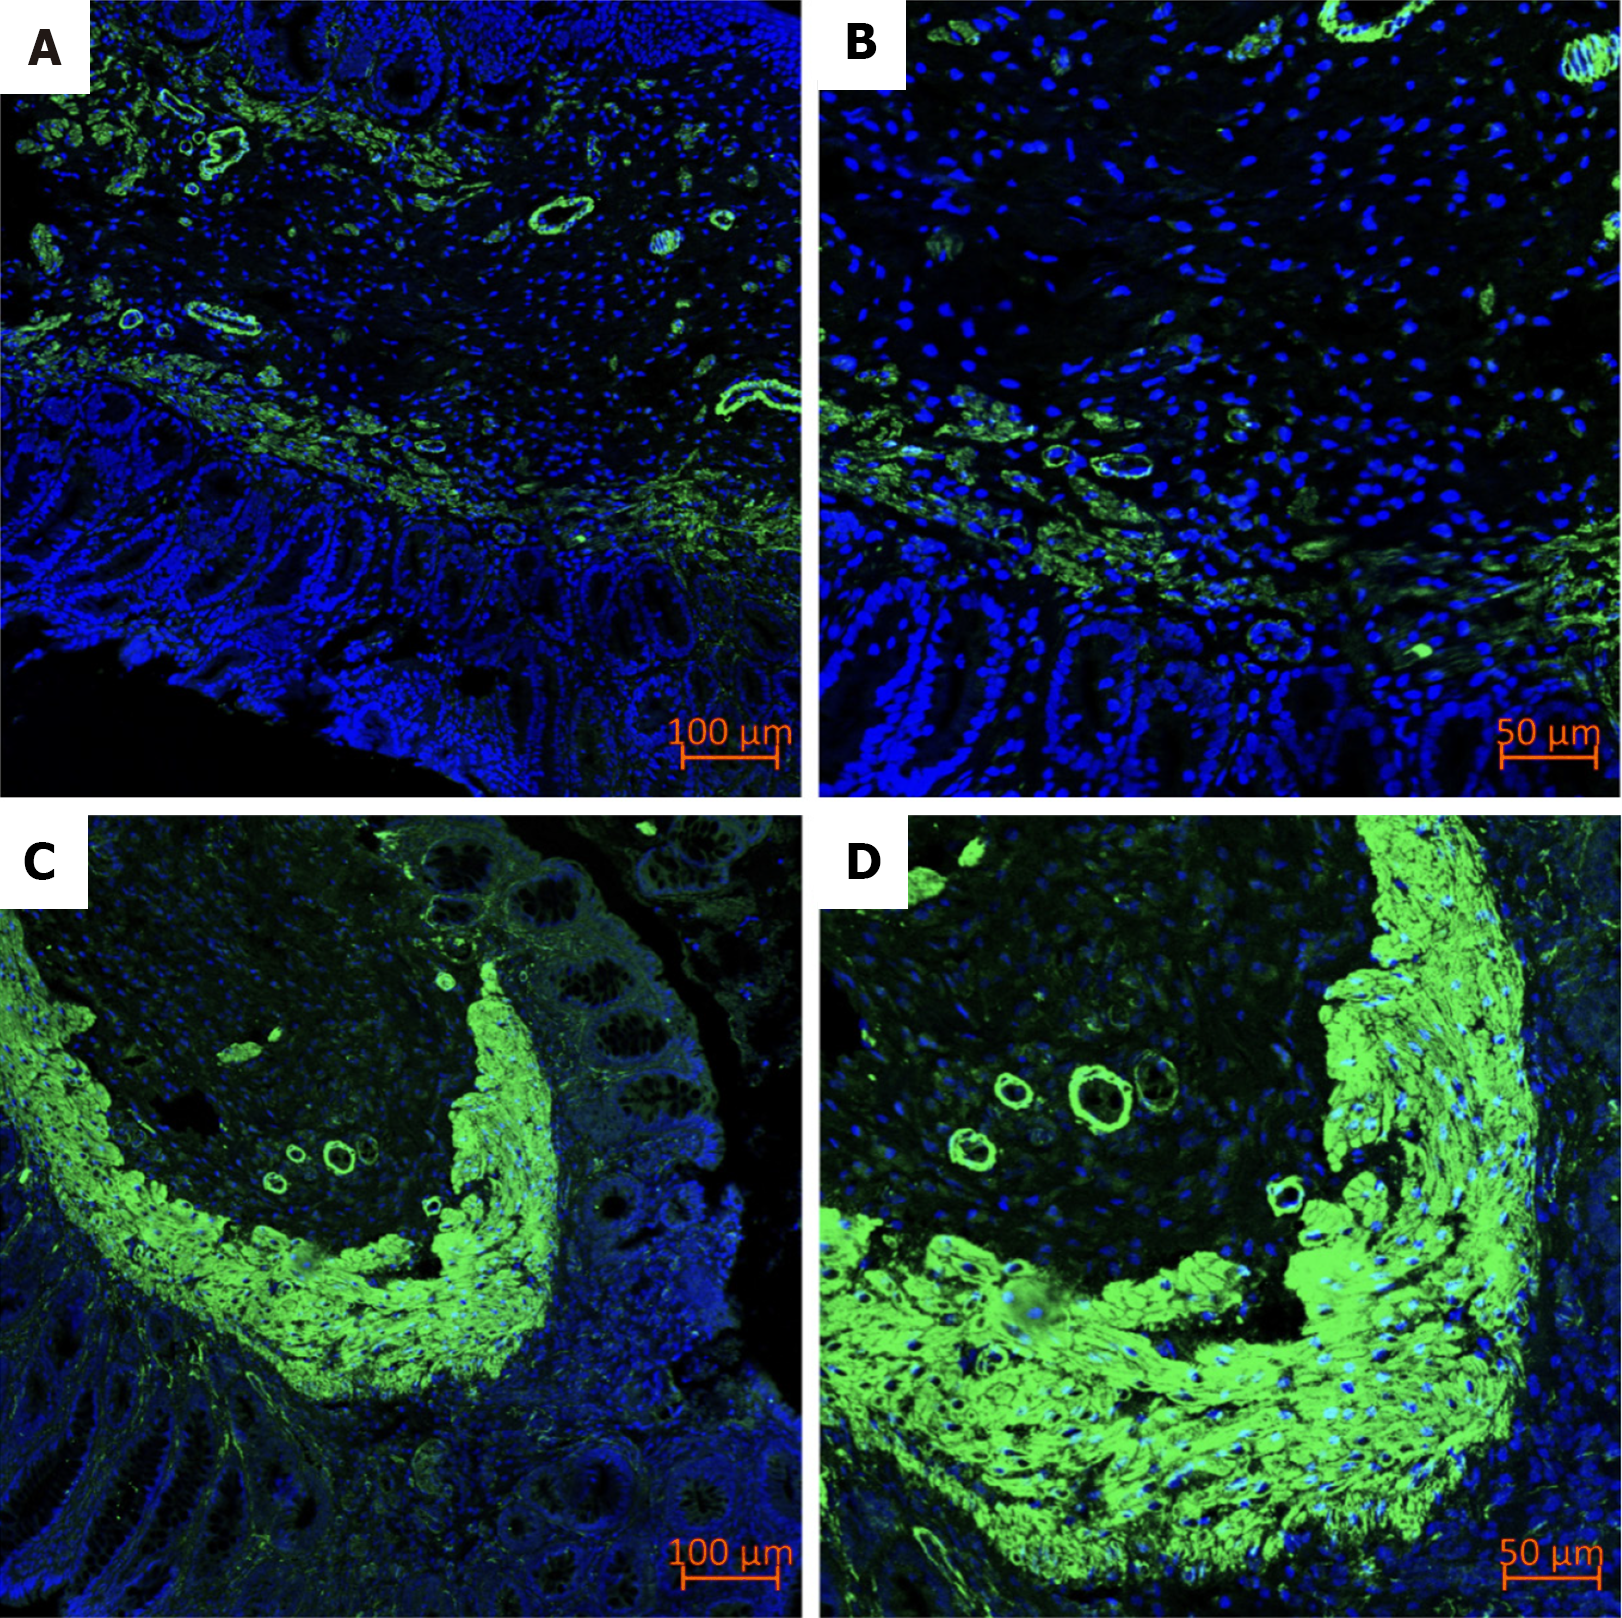
Figure 7 Immunofluorescence.
A: Alpha-smooth muscle actin (α-SMA) in control group (100 ×); B: α-SMA in control group (200 ×); C: α-SMA in treatment group (100 ×); D: α-SMA in treatment group (200 ×).
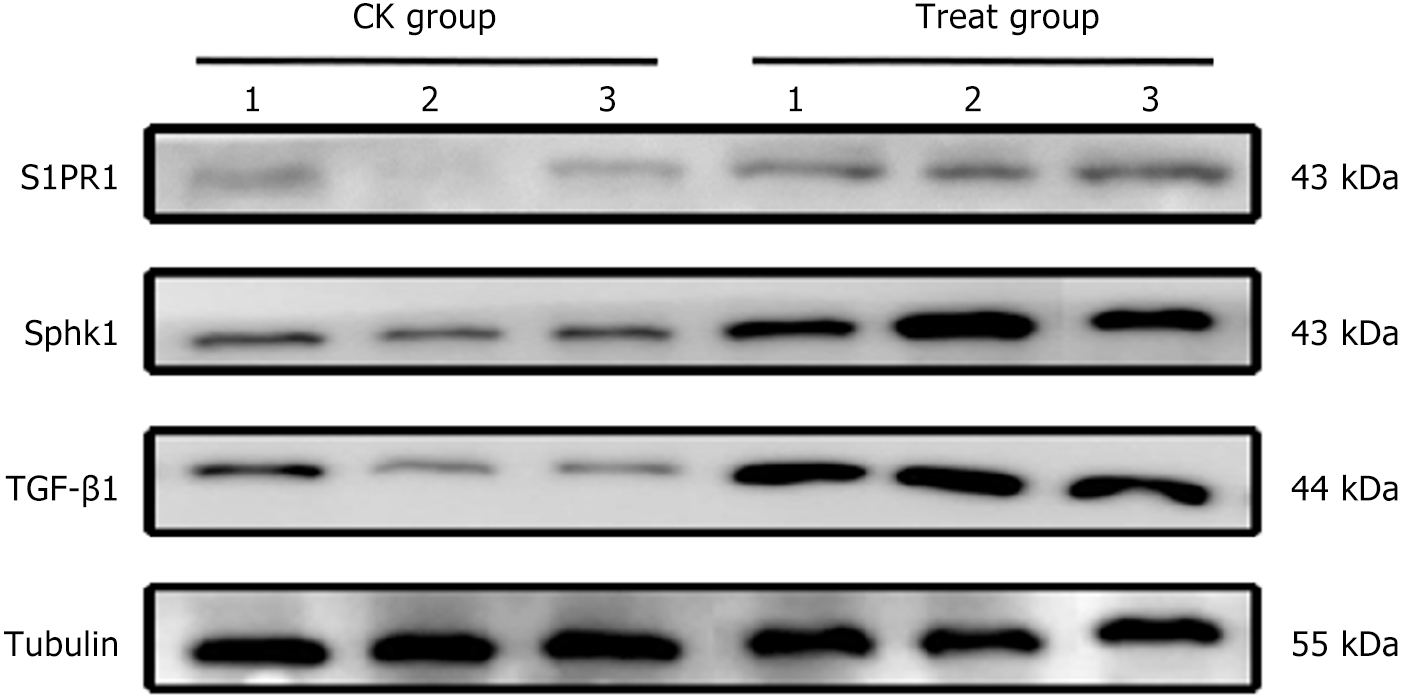
Figure 8 Expression of sphingosine kinase 1-sphingosine-1-phosphate pathway related proteins in rectal tissues.
Sphk1: Sphingosine kinase 1; S1PR1: Sphingosine-1-phosphate receptor 1; TGF-β1: Transforming growth factor-β1.
- Citation: Ke MH, Huang SY, Lin WG, Xu ZG, Zheng XX, Liu XB, Cheng YM, Li ZF. Single-nucleus RNA sequencing and spatial transcriptomics reveal the mechanism by which Xiaozhiling injection treats internal hemorrhoids. World J Gastrointest Surg 2025; 17(4): 103494
- URL: https://www.wjgnet.com/1948-9366/full/v17/i4/103494.htm
- DOI: https://dx.doi.org/10.4240/wjgs.v17.i4.103494


