Copyright
©The Author(s) 2025.
World J Gastrointest Surg. Apr 27, 2025; 17(4): 102442
Published online Apr 27, 2025. doi: 10.4240/wjgs.v17.i4.102442
Published online Apr 27, 2025. doi: 10.4240/wjgs.v17.i4.102442
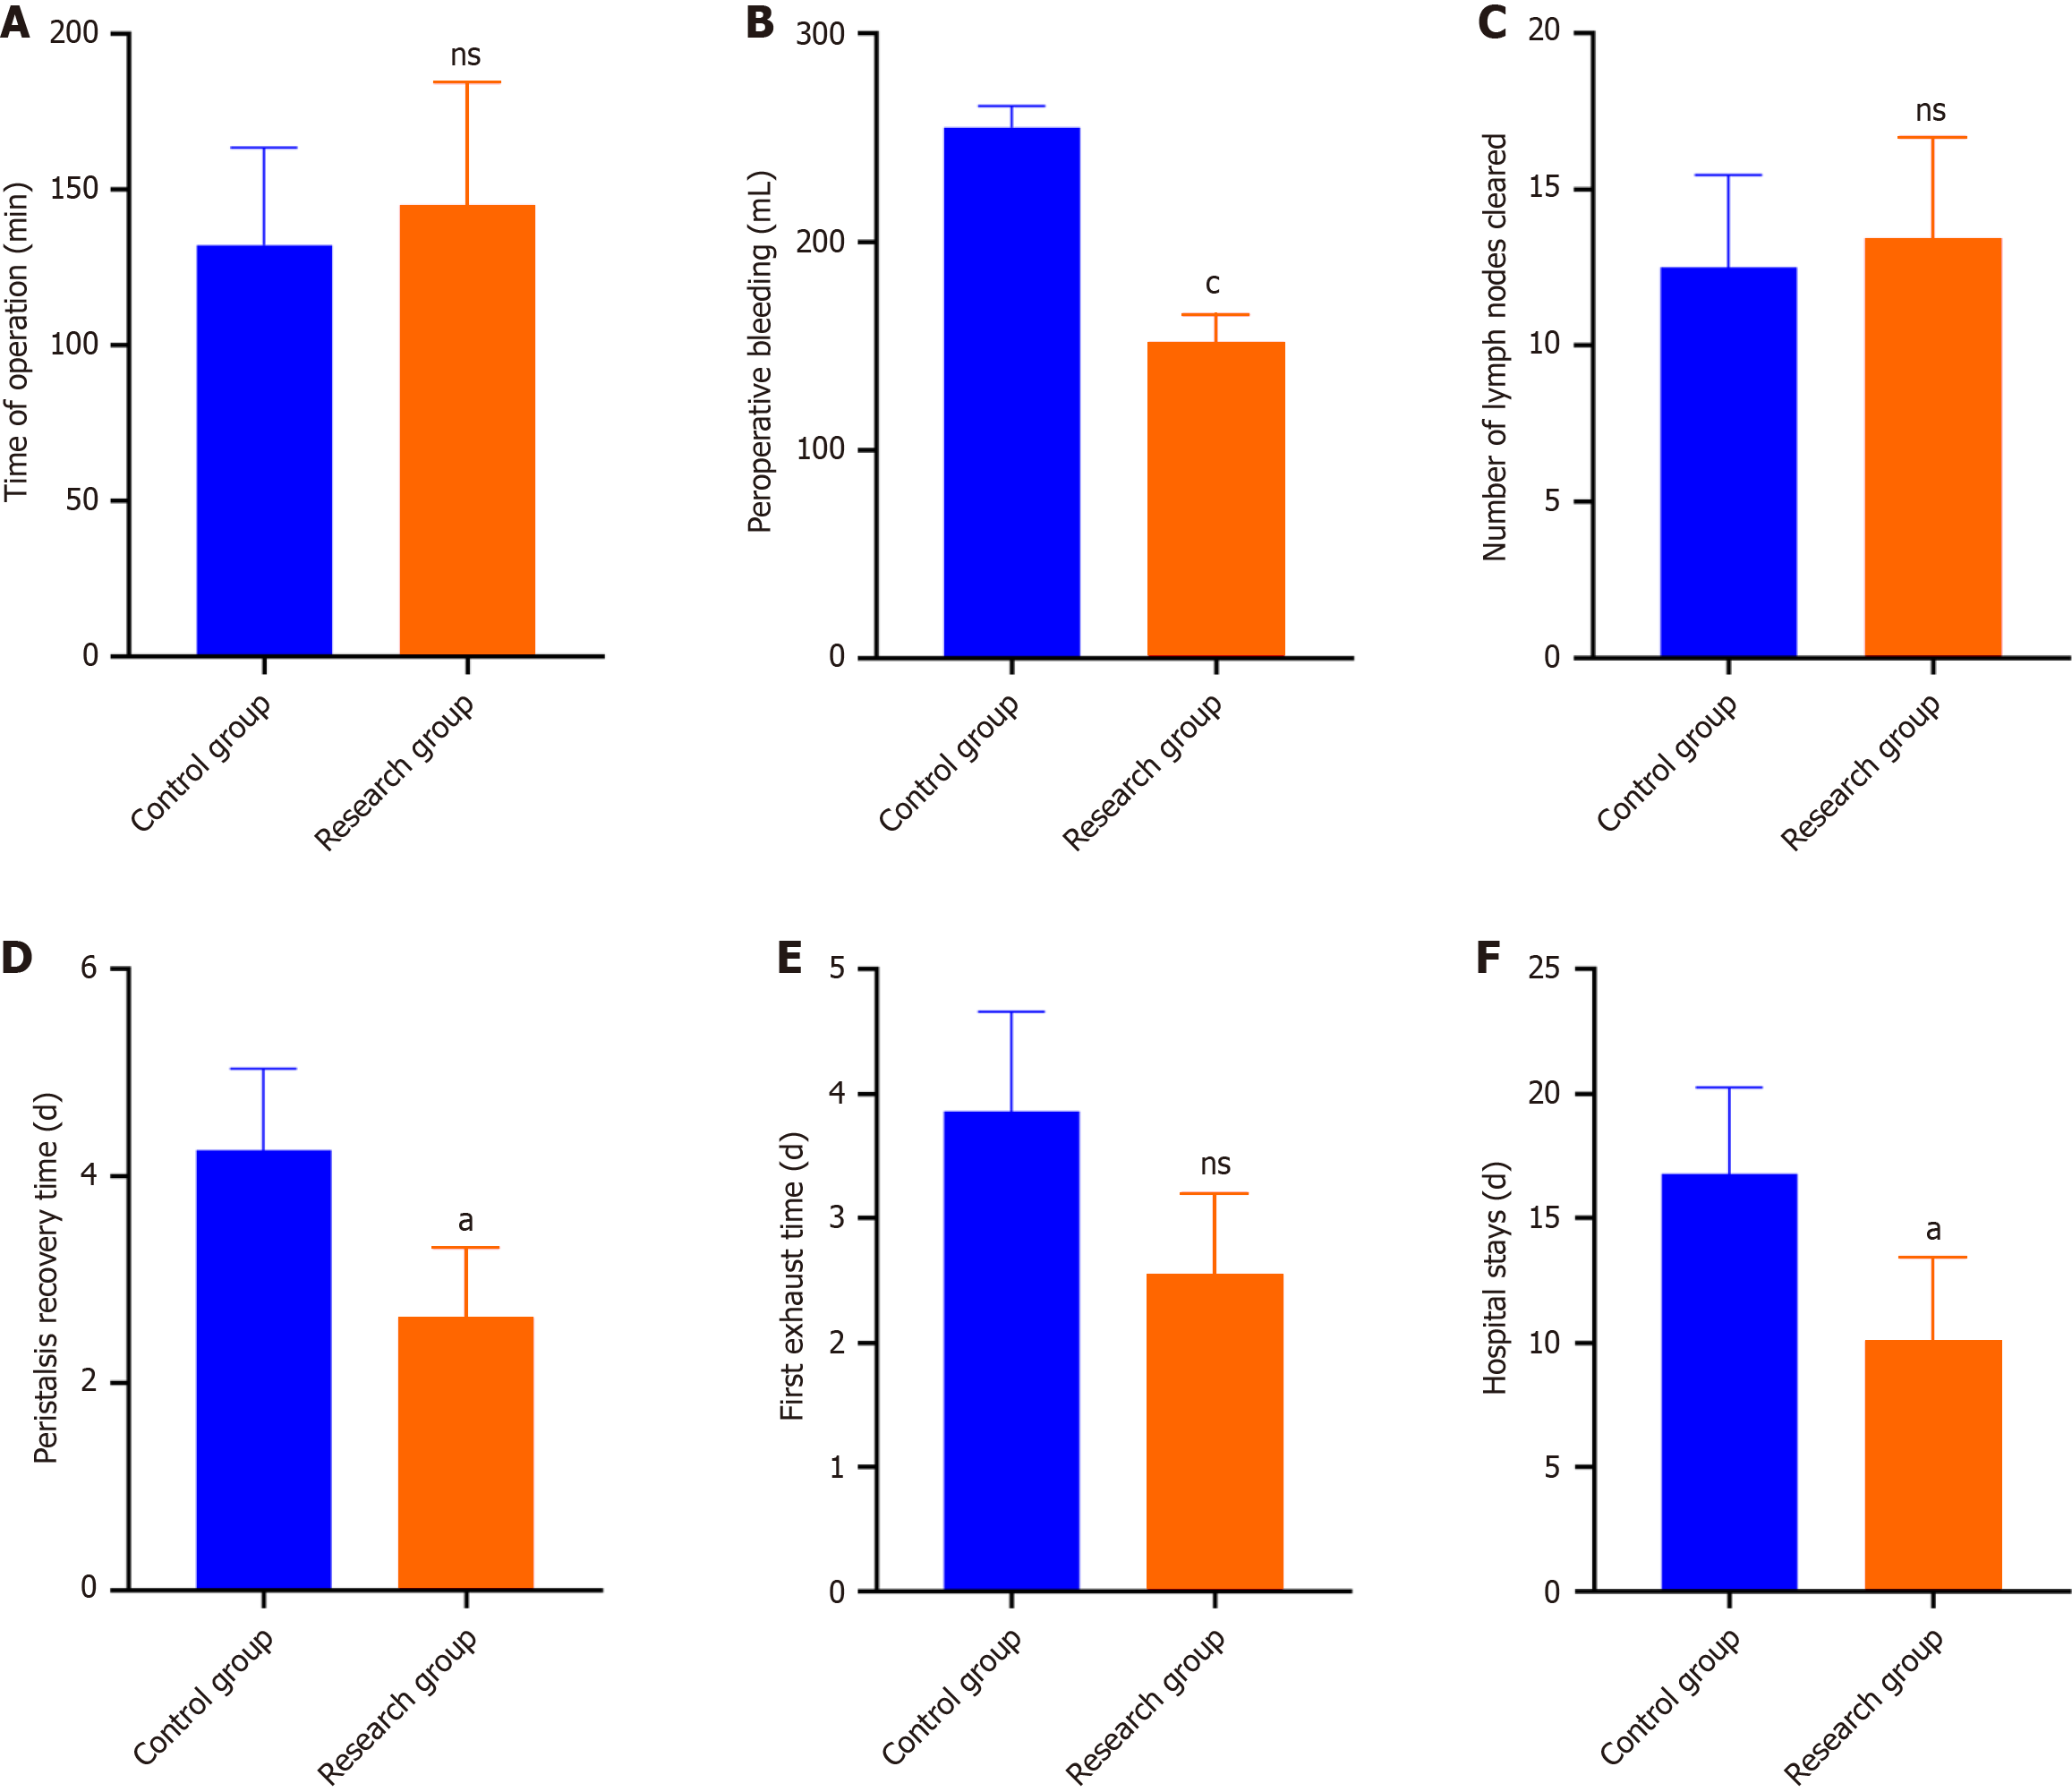
Figure 1 Analysis of general clinical indexes of patients in two groups (n = 100).
A: Comparison of time of operation; B: Comparison of peroperative bleeding; C: Comparison of number of lymph nodes cleared; D: Comparison of peristalsis recovery time; E: Comparison of first exhaust time; F: Comparison of hospital stays. Compared with the control group, nsP > 0.05, aP < 0.05, cP < 0.001.
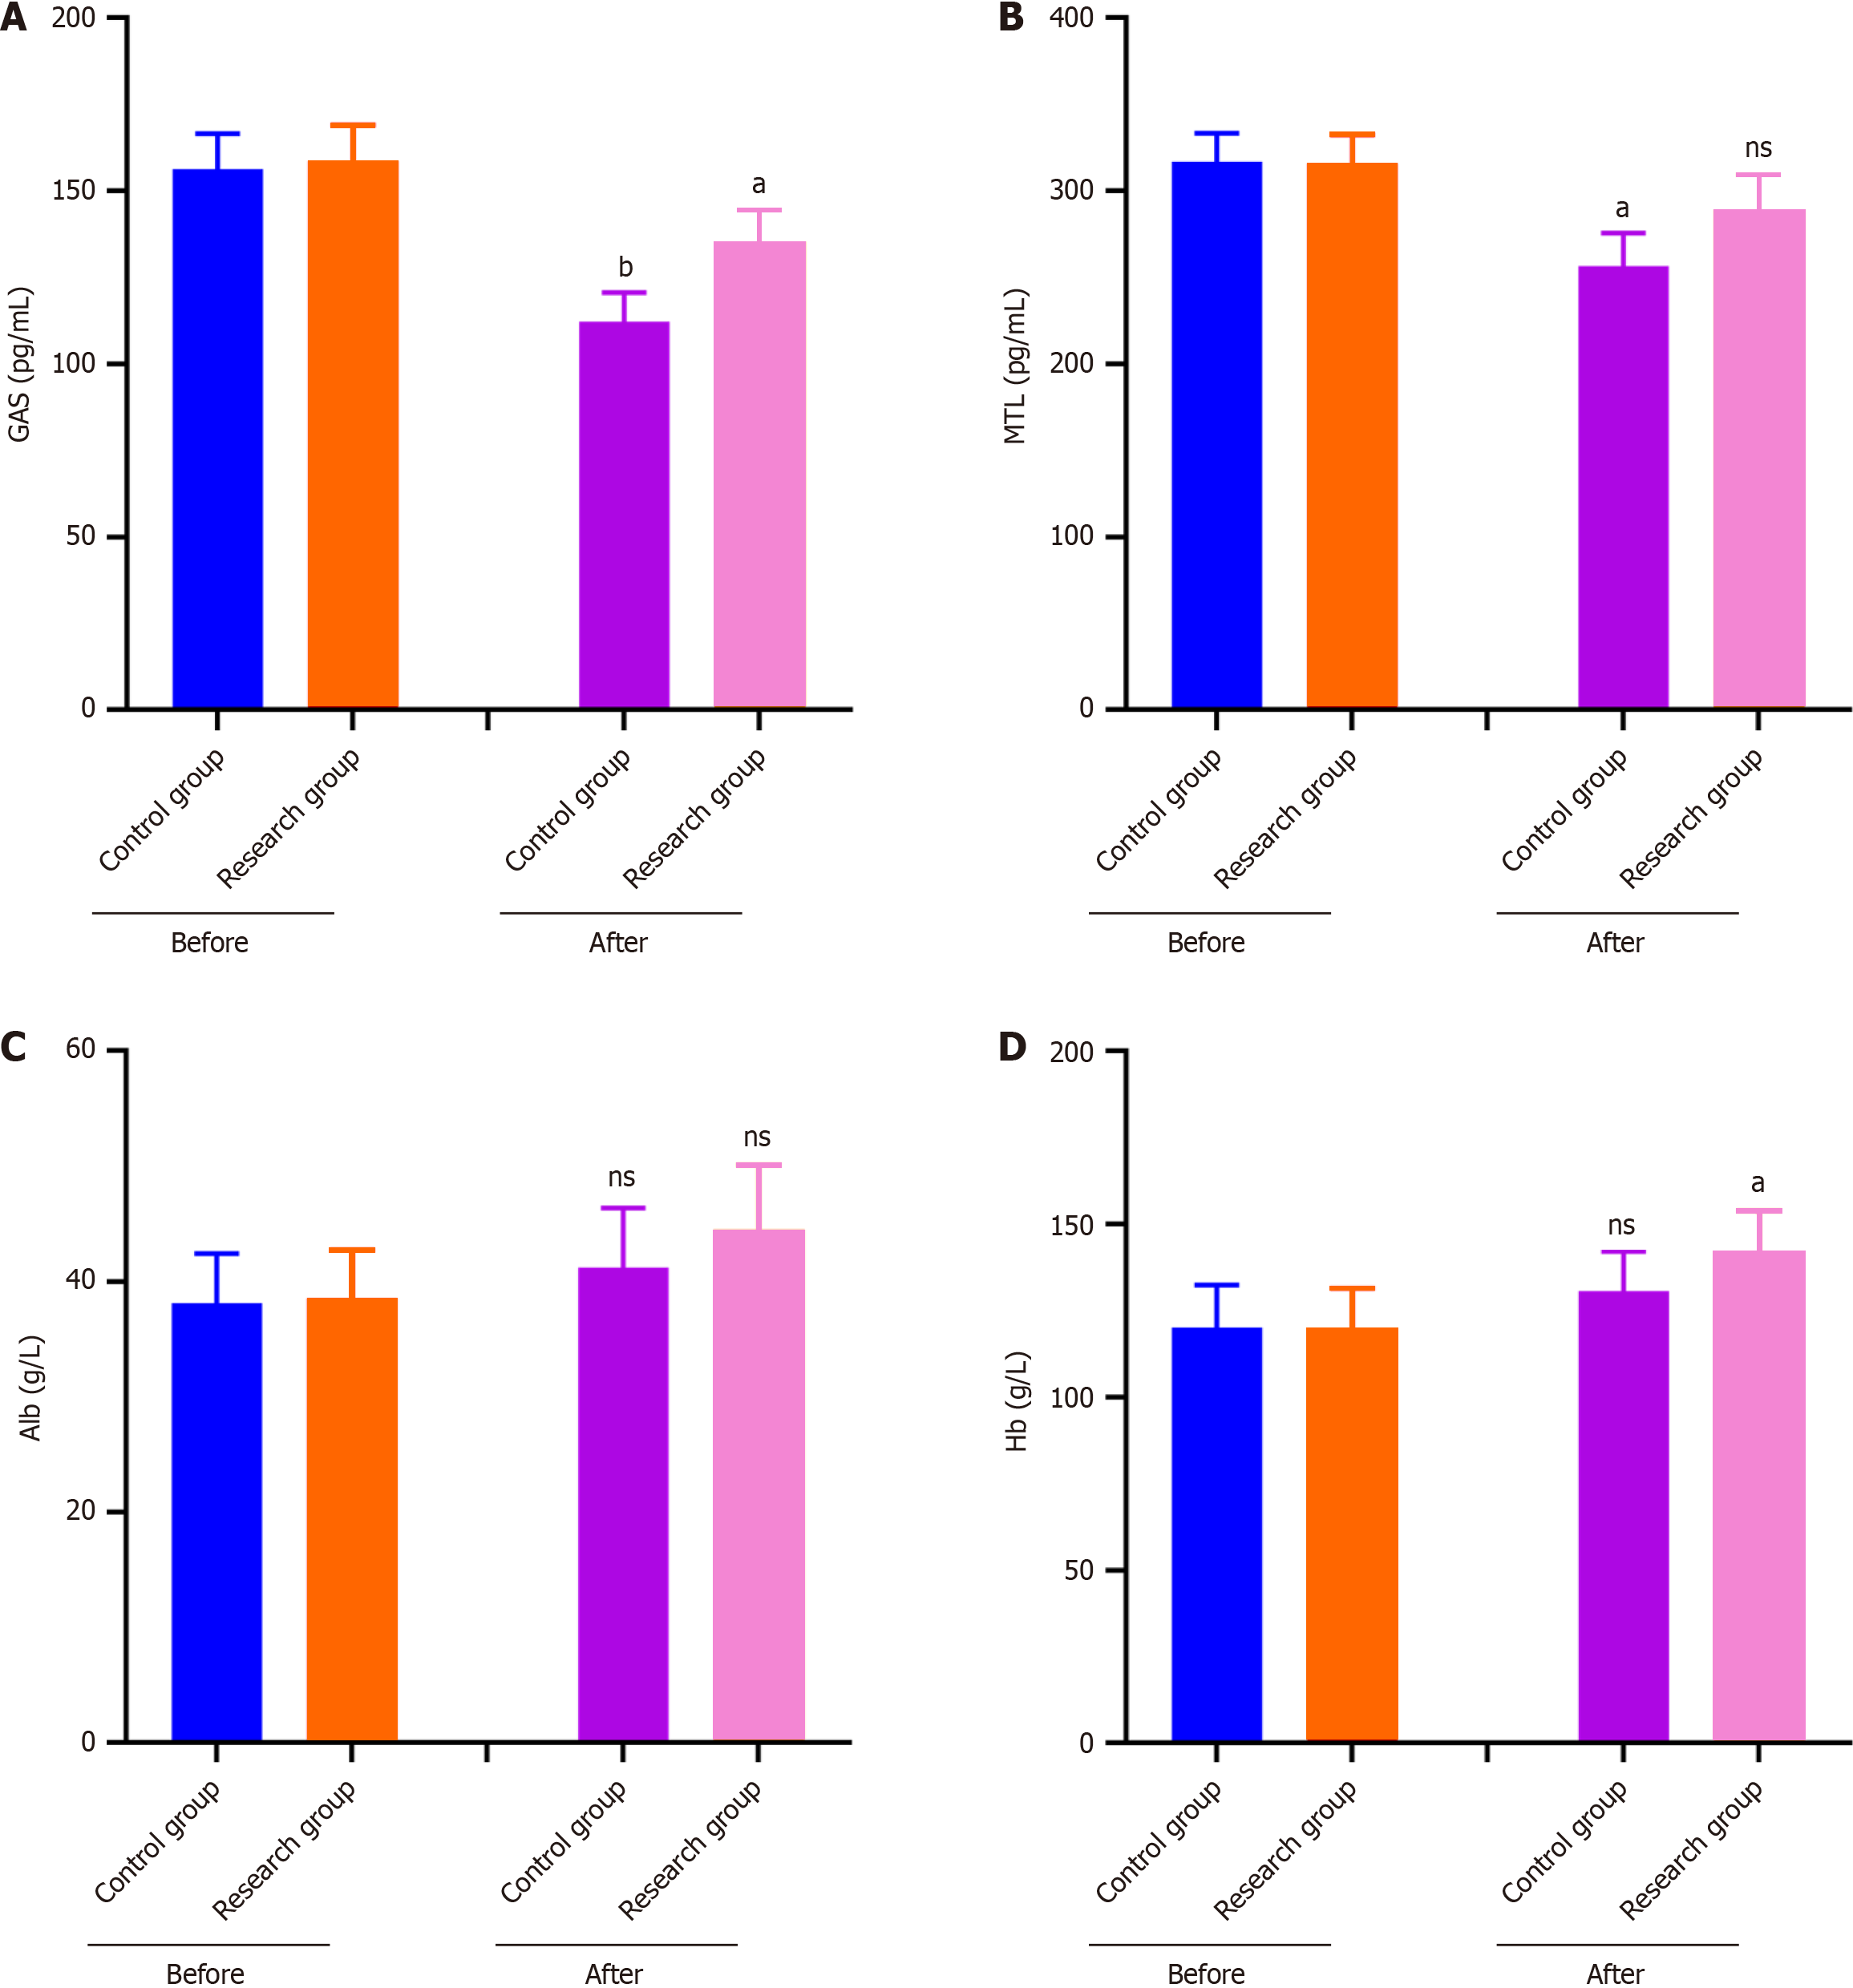
Figure 2 Analysis of gastrointestinal hormones and nutritional indexes of patients in two groups (n = 100).
A: Comparison of gastrointestinal hormone gastrin level; B: Comparison of gastrointestinal hormone motilin level; C: Comparison of nutritional index albumin level; D: Comparison of nutritional index hemoglobin level. Compared with the before operation, nsP > 0.05, aP < 0.05, bP < 0.01. Alb: Albumin; GAS: Gastrin; Hb: Hemoglobin; MTL: Motilin.
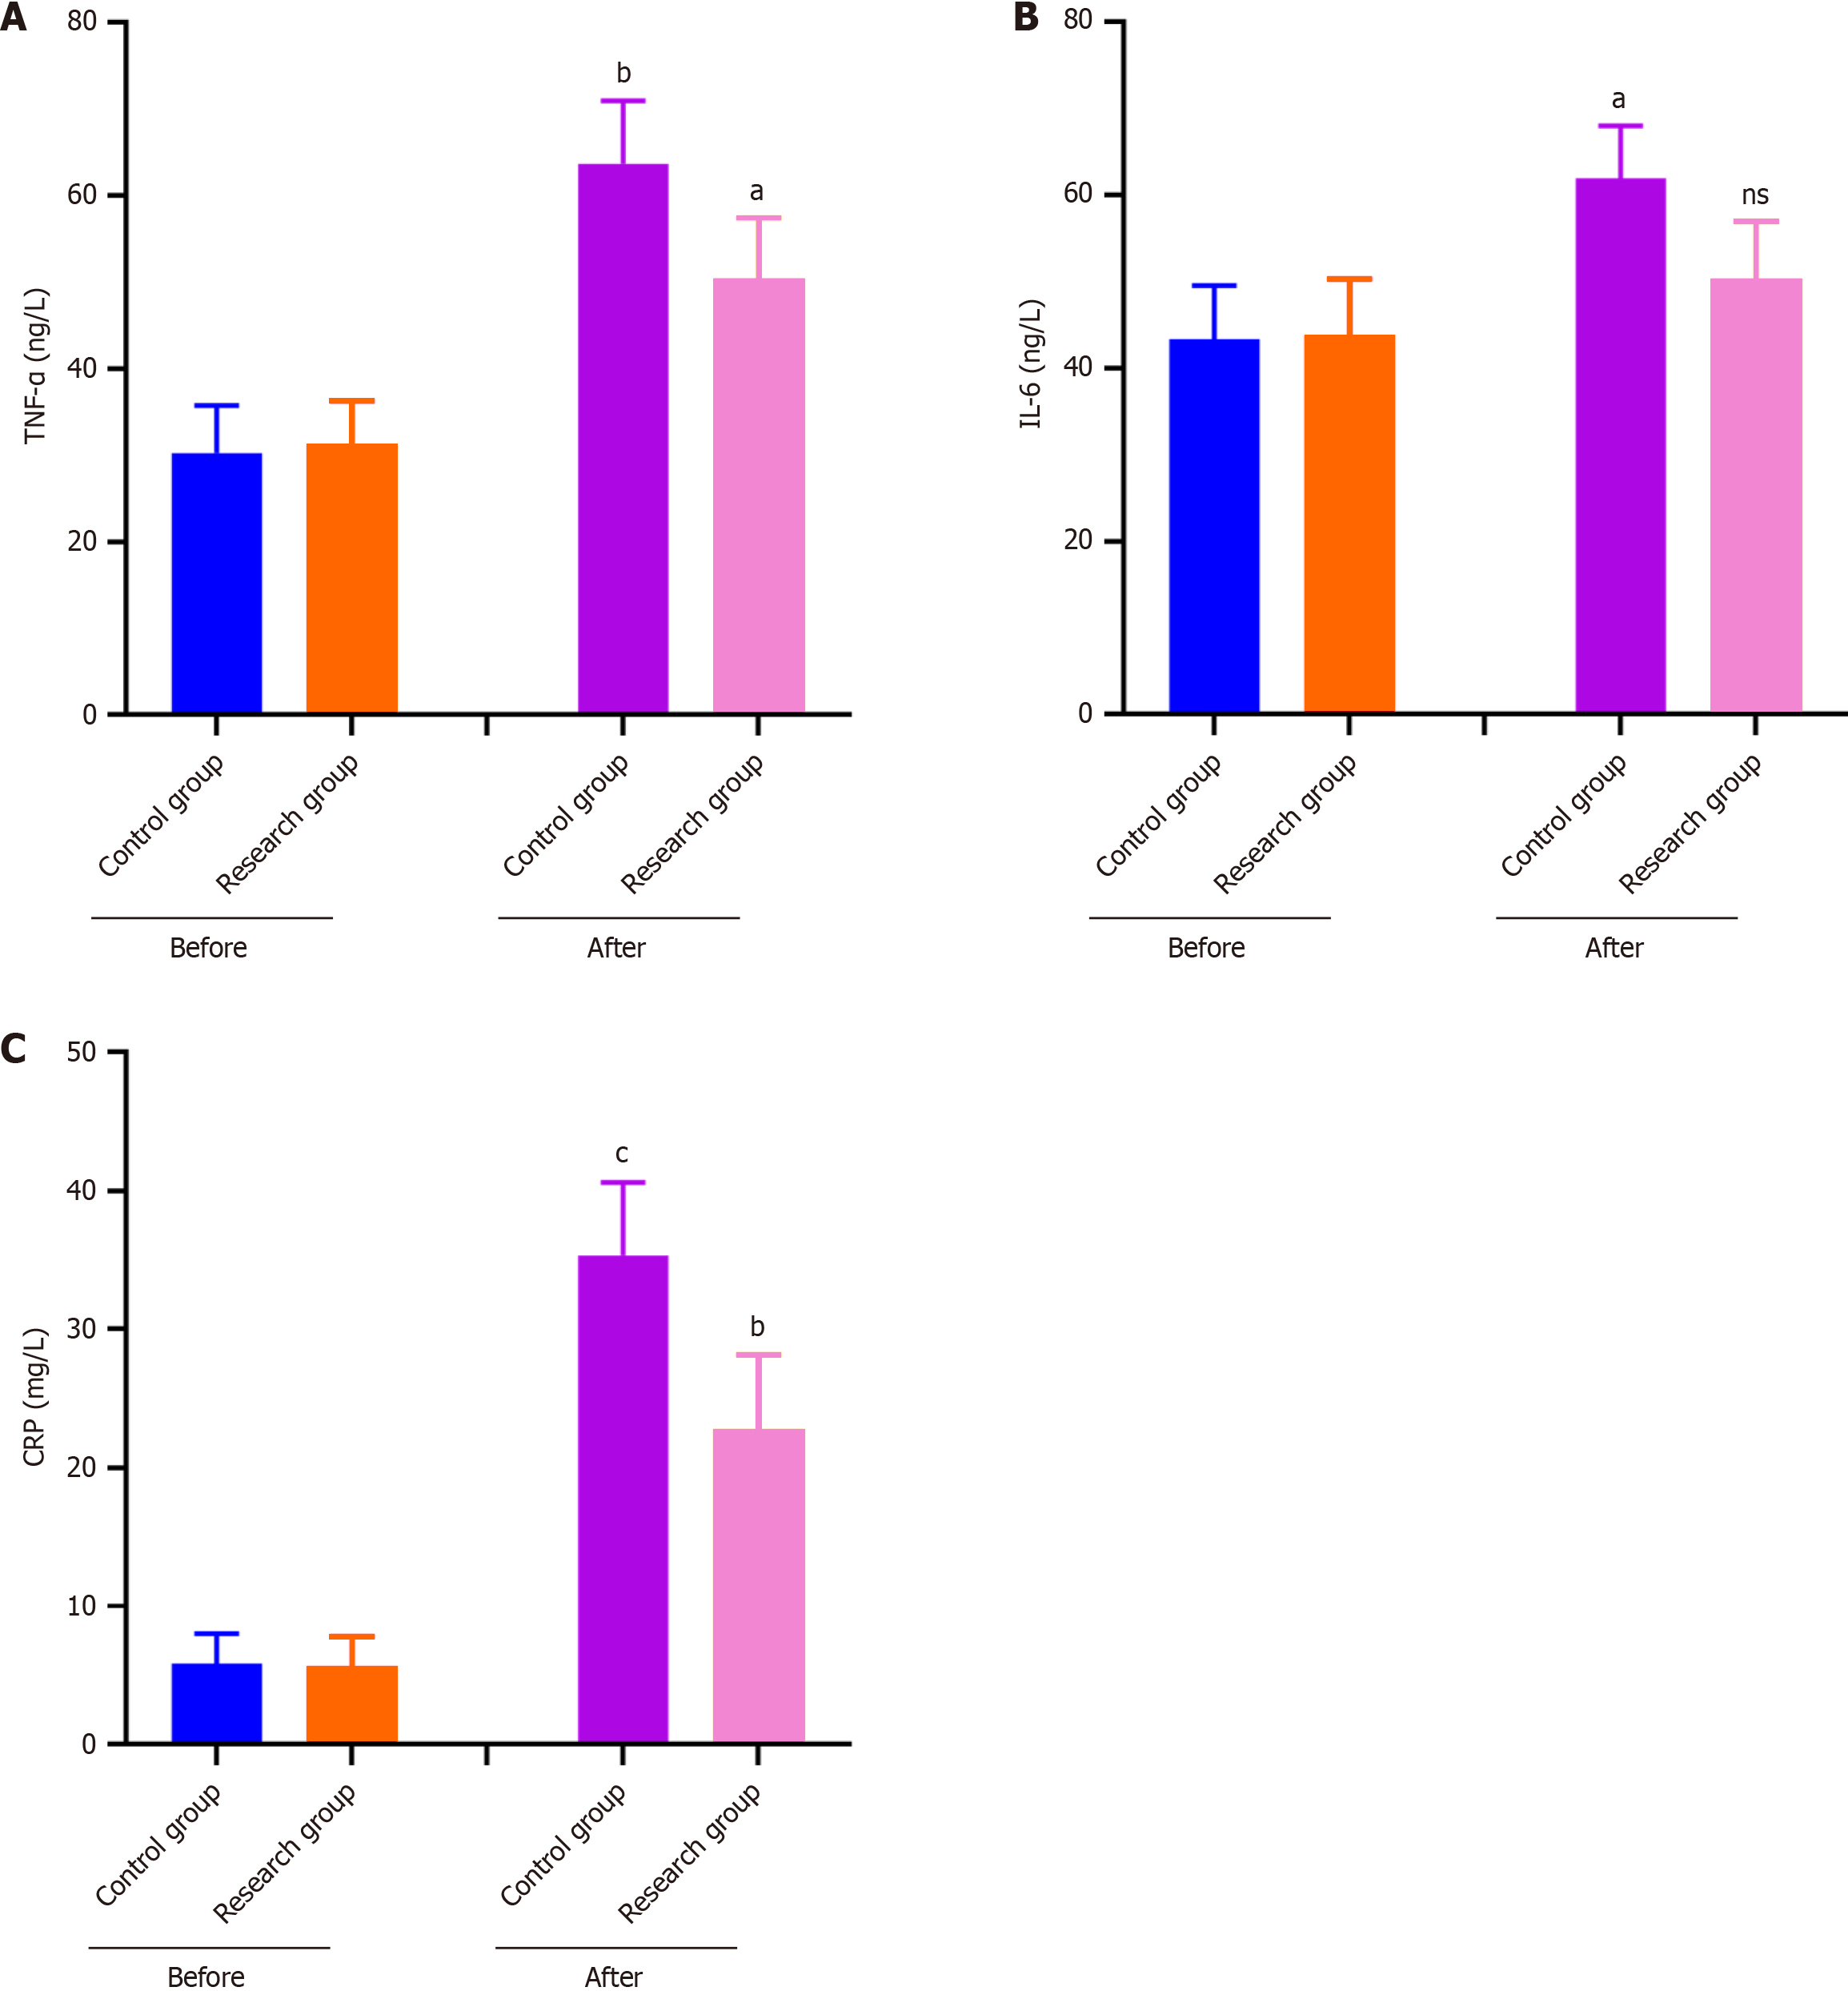
Figure 3 Analysis of the level of inflammatory factors before and after operation in two groups (n = 100).
A: Comparison of the level of tumor necrosis factor-α before and after operation; B: Comparison of the level of interleukin-6 before and after operation; C: Comparison of the level of C-reactive protein before and after operation. Compared with the before operation, nsP > 0.05, aP < 0.05, bP < 0.01, cP < 0.001. CRP: C-reactive protein; IL-6: Interleukin-6; TNF-α: Tumor necrosis factor-α.
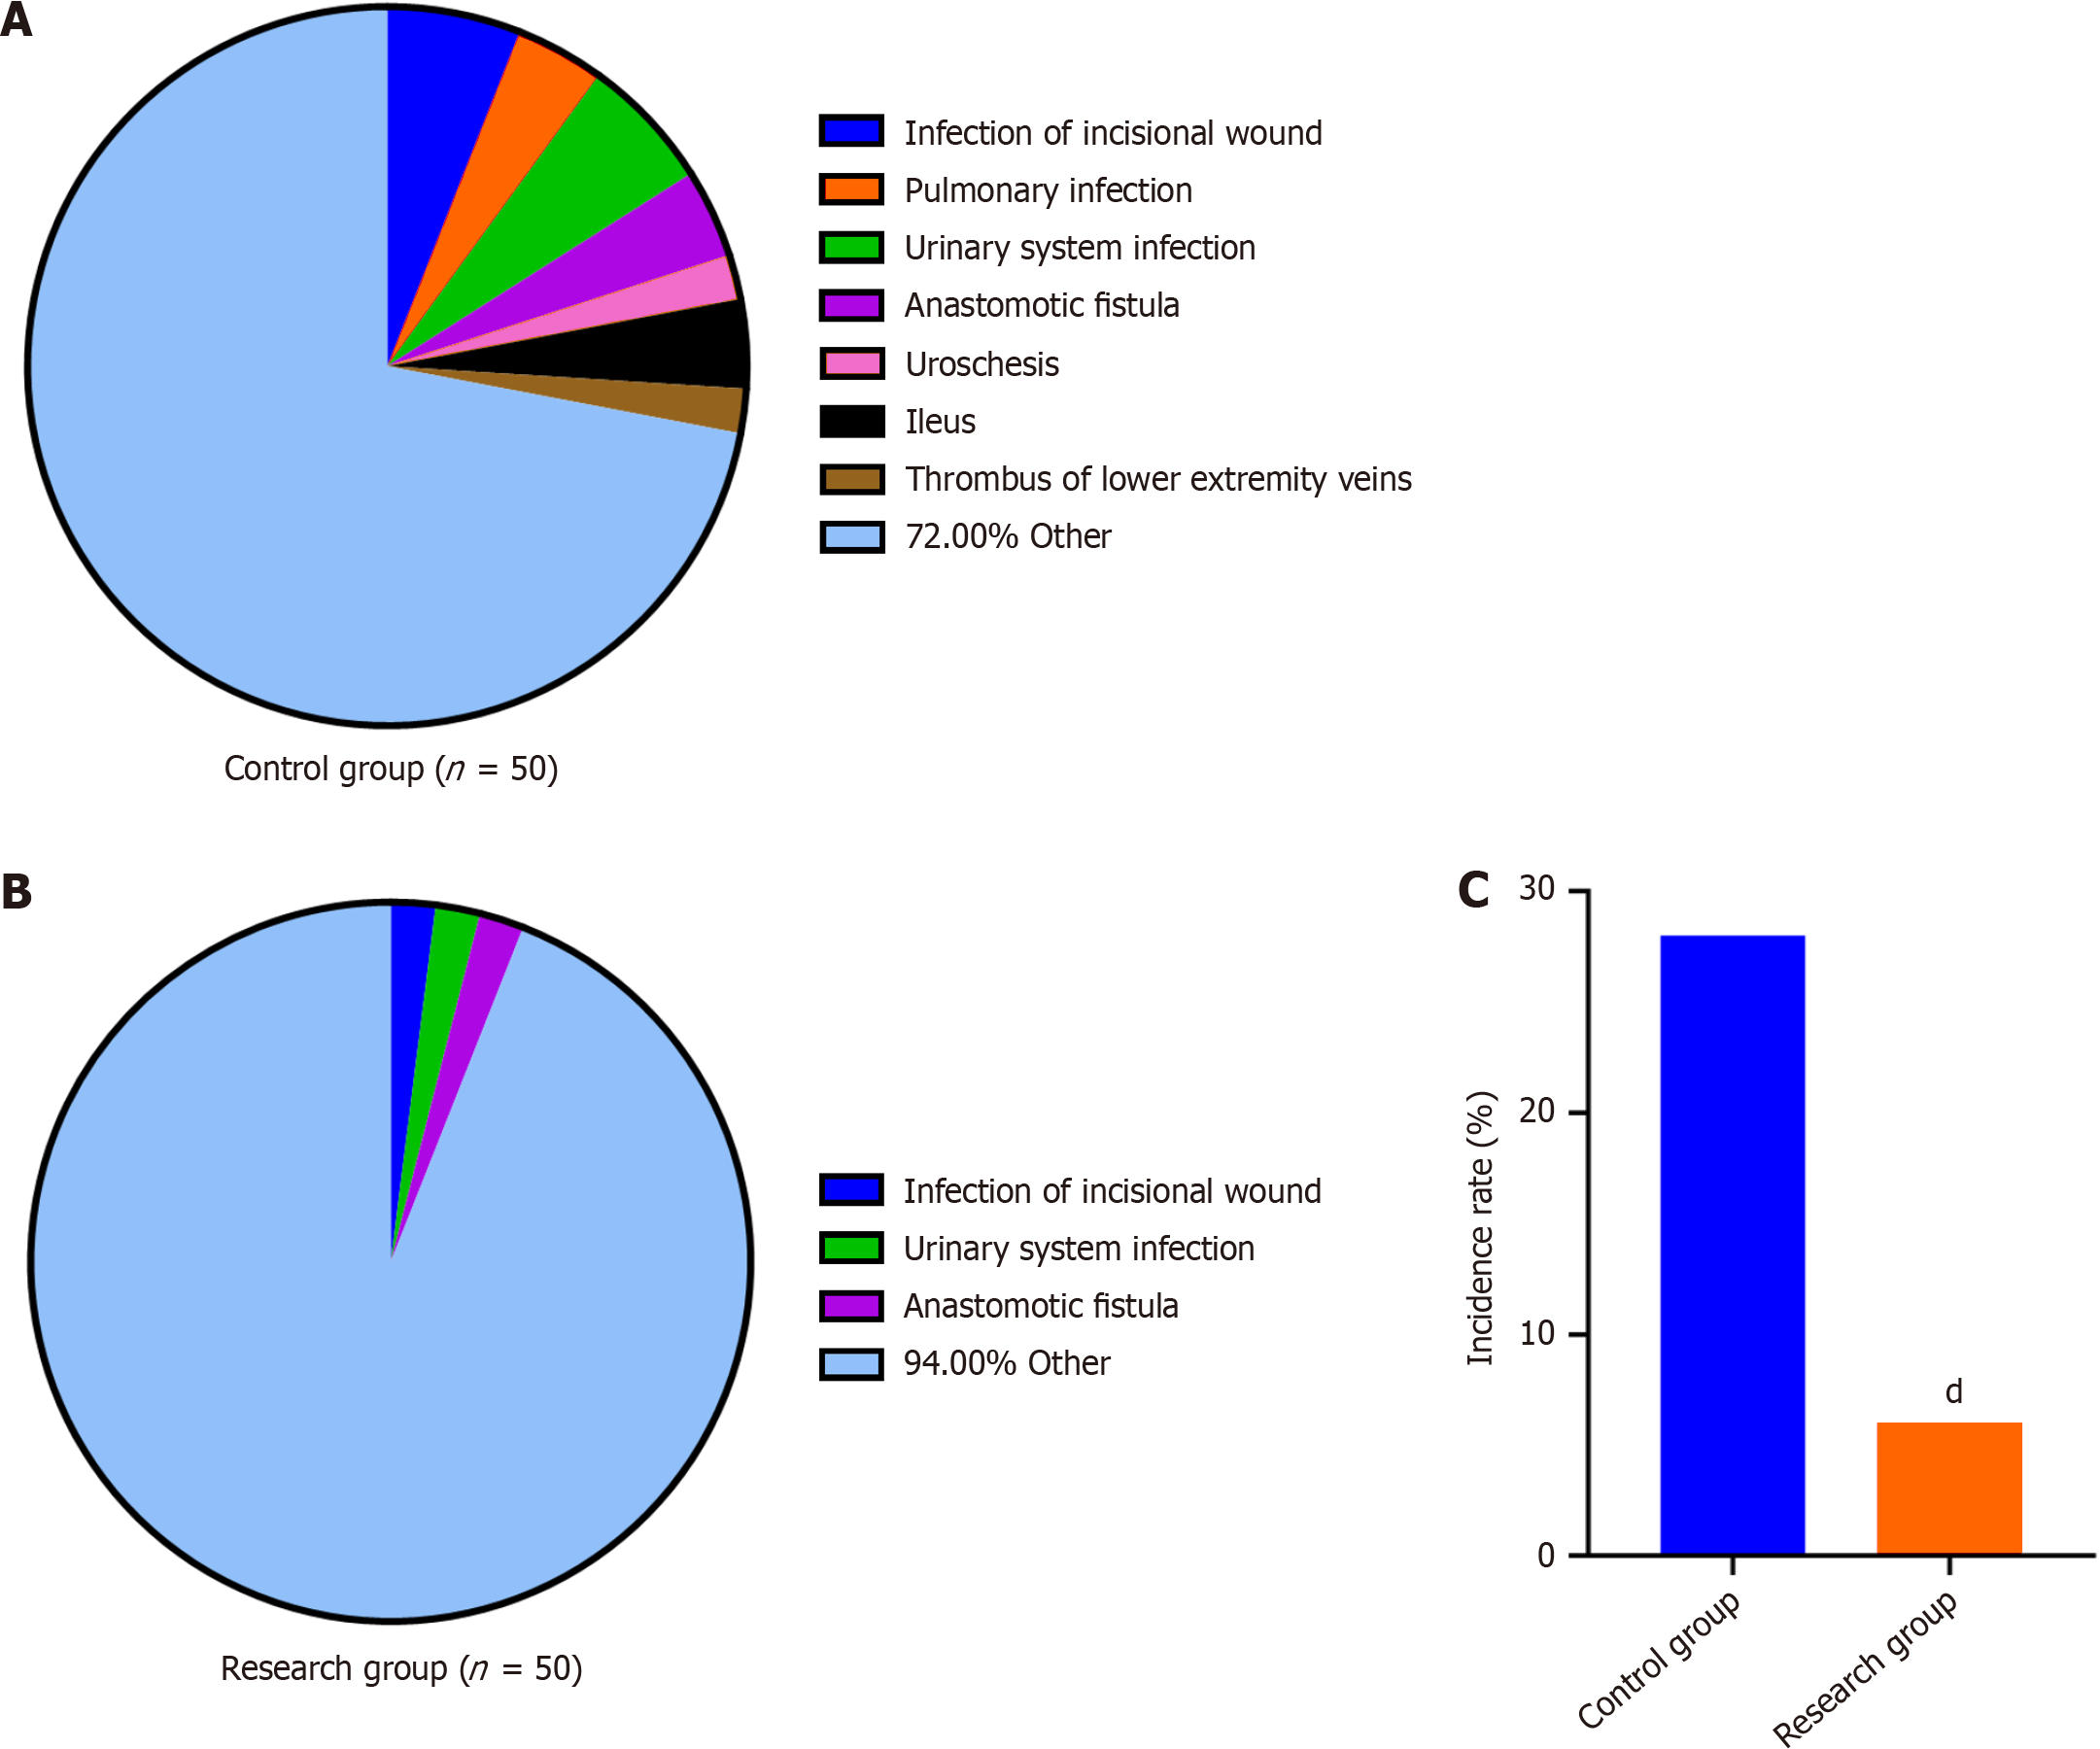
Figure 4 Analysis of the incidence of postoperative complications between the two groups (n = 100).
A: The occurrence and probability distribution of postoperative complications in the control group; B: The occurrence and probability distribution of postoperative complications in the research group; C: The comparison of the incidence of postoperative complications between the two groups. dP < 0.0001.
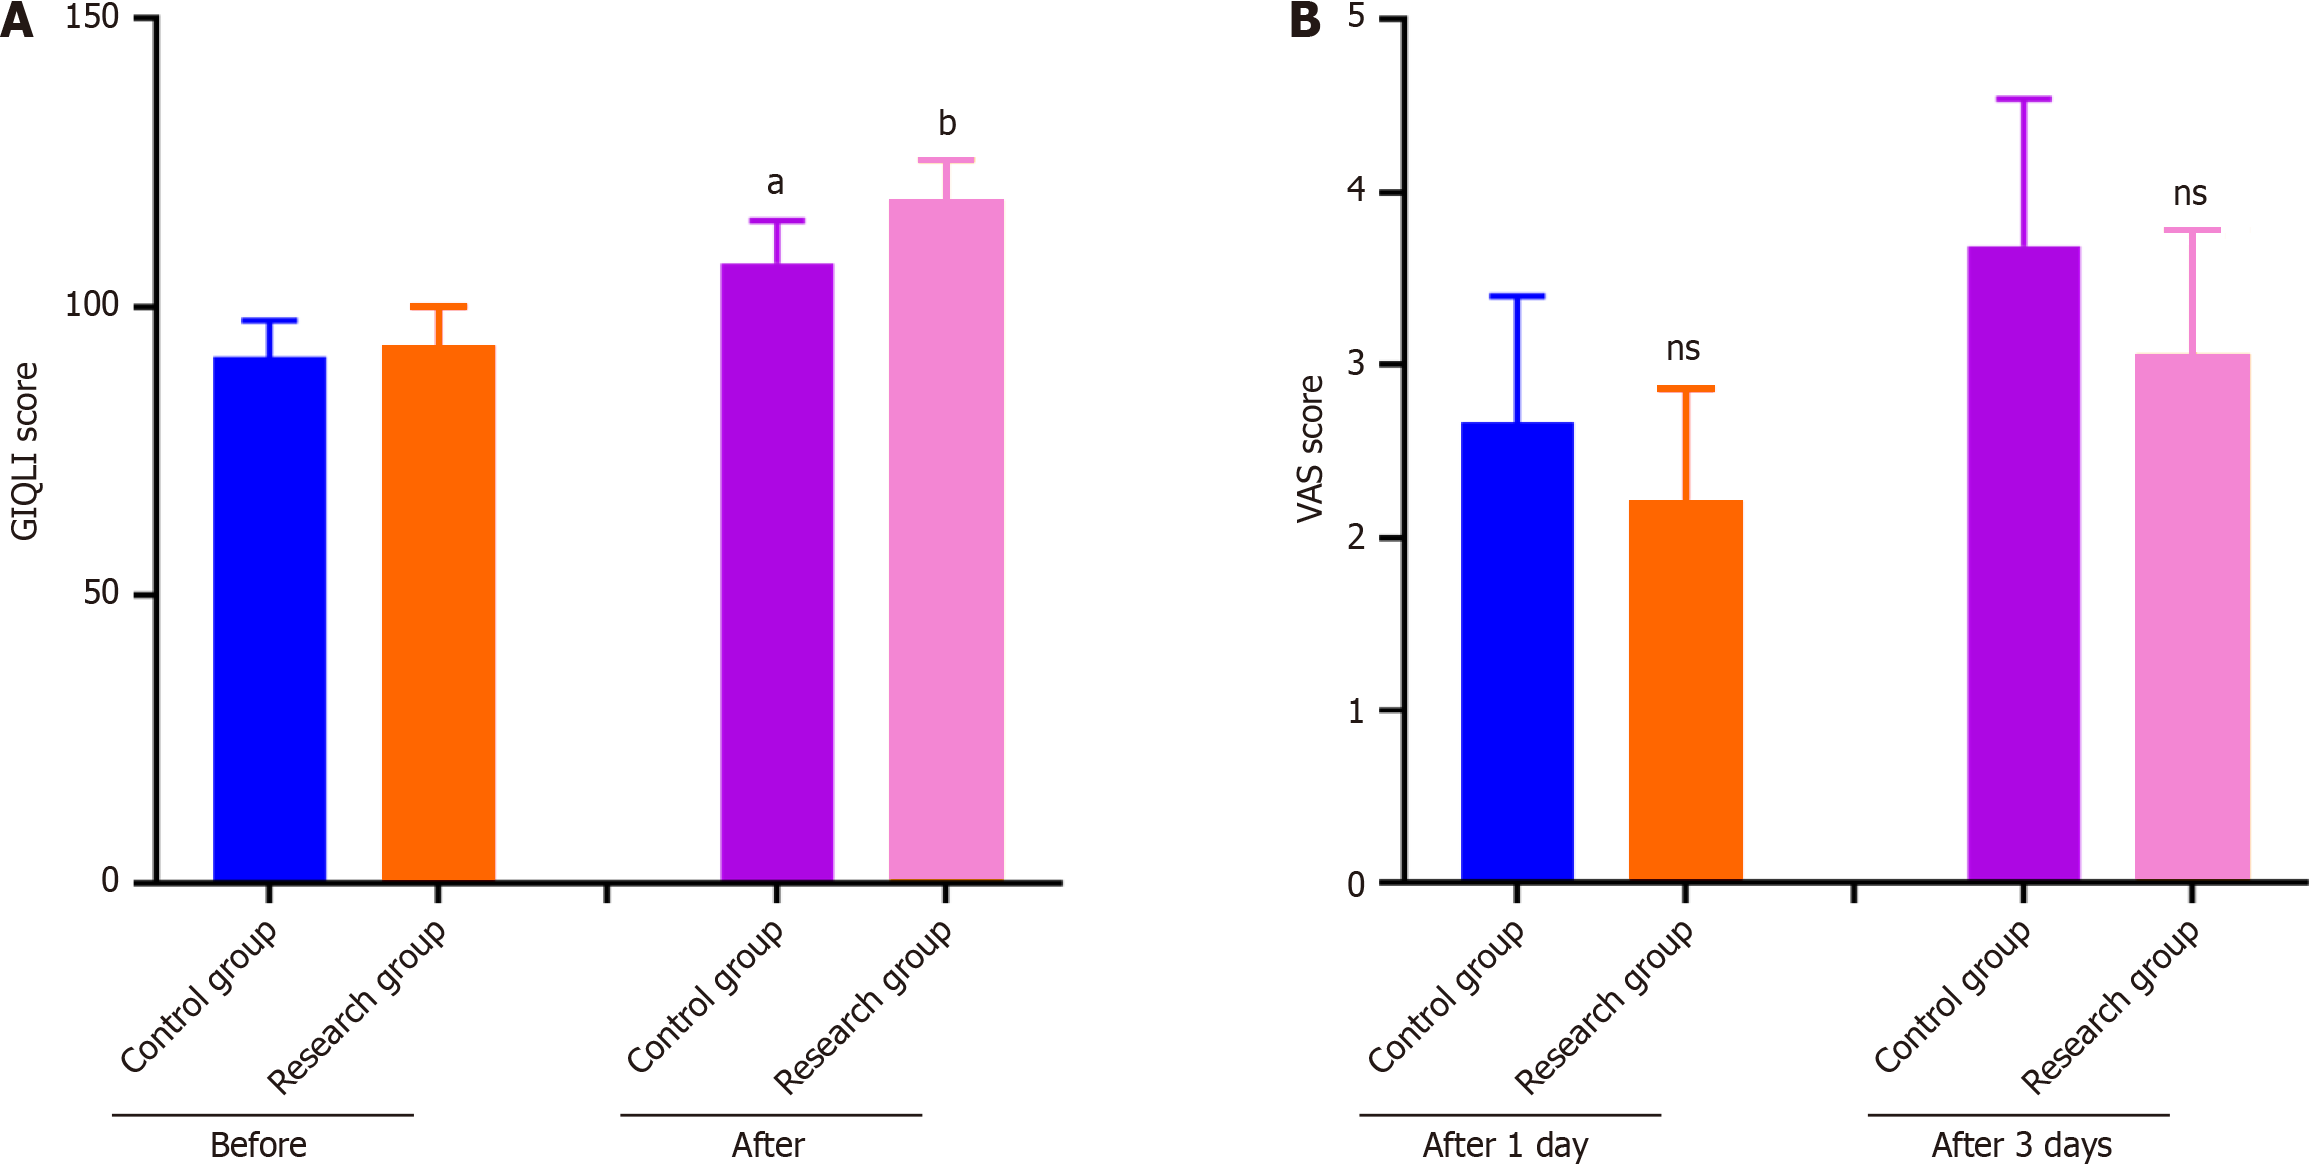
Figure 5 Analysis of Gastrointestinal Quality of Life Index score and Visual Analog Scale score before and after operation (n = 100).
A: Comparison of Gastrointestinal Quality of Life Index score before and after operation; B: Comparison of Visual Analog Scale scores at 1 day and 3 days after operation. nsP > 0.05, aP < 0.05, bP < 0.01. GIQLI: Gastrointestinal Quality of Life Index; VAS: Visual Analog Scale.
- Citation: Li WB, Li J, Yu W, Gao JH. Short-term efficacy of laparoscopic radical resection for colorectal cancer and risk of unplanned reoperation after surgery. World J Gastrointest Surg 2025; 17(4): 102442
- URL: https://www.wjgnet.com/1948-9366/full/v17/i4/102442.htm
- DOI: https://dx.doi.org/10.4240/wjgs.v17.i4.102442


