Copyright
©The Author(s) 2025.
World J Gastrointest Surg. Mar 27, 2025; 17(3): 99782
Published online Mar 27, 2025. doi: 10.4240/wjgs.v17.i3.99782
Published online Mar 27, 2025. doi: 10.4240/wjgs.v17.i3.99782
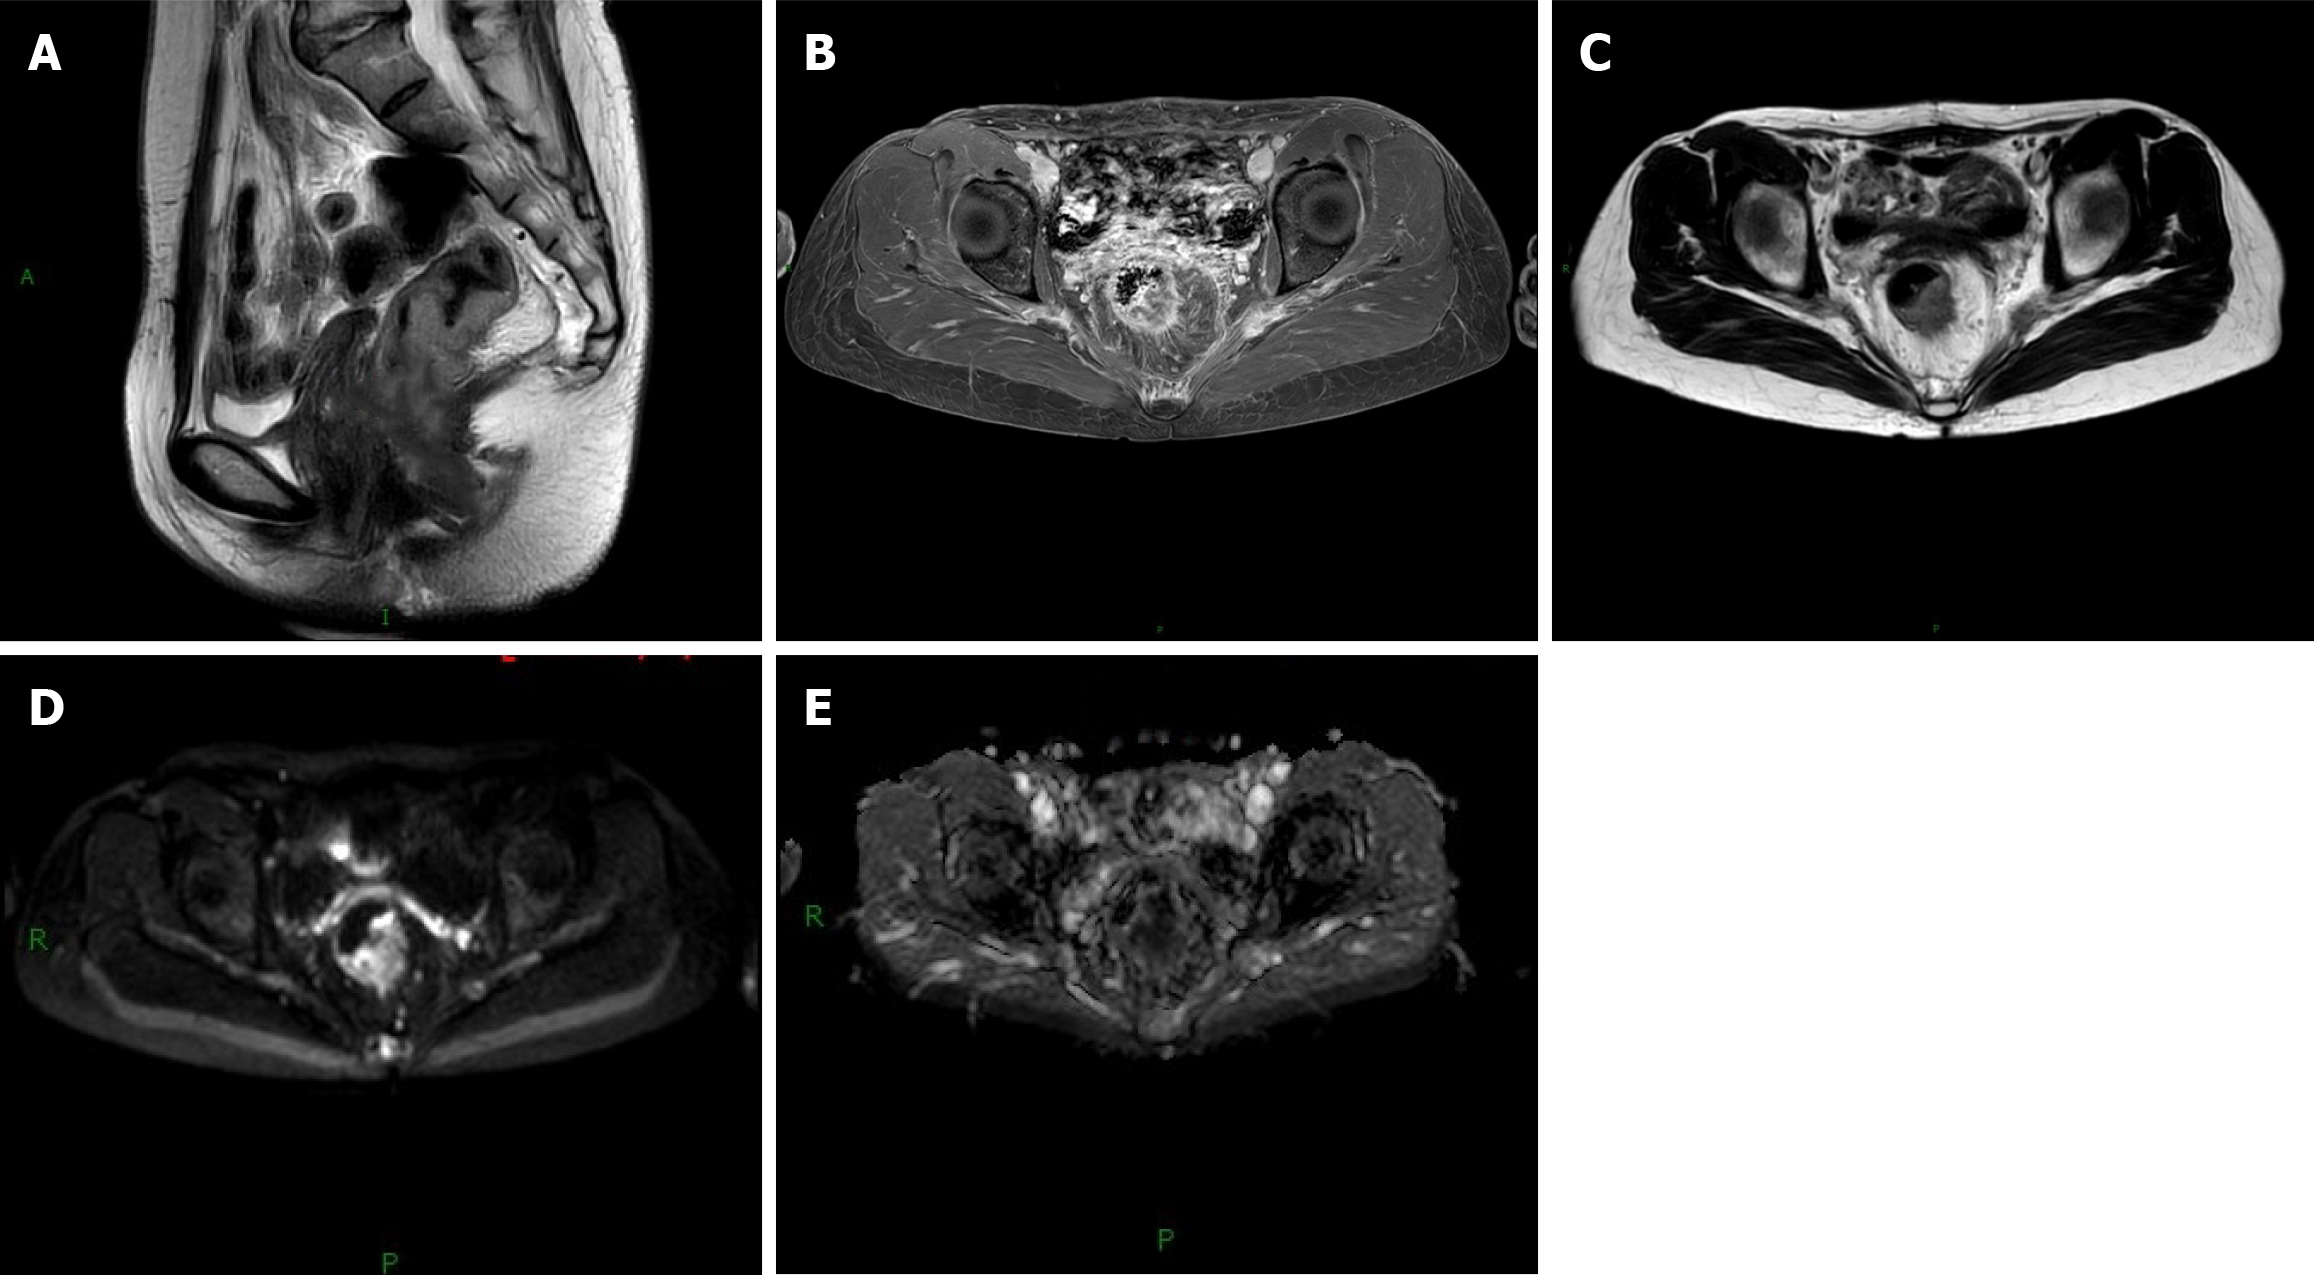
Figure 1 Images of patients with rectal cancer.
A: Sagittal view showing intestinal wall thickening located approximately 7.0 cm from the anal edge, with a lesion length of approximately 3.6 cm. There is local posterior margin breakthrough of the outer membrane layer into the periintestinal fascia; B: Posterior wall of the rectum demonstrating thickening and uneven enhancement; C: T2-weighted imaging sequence revealing significant uneven thickening of the posterior rectal wall, penetrating the adventitia and invading adjacent periintestinal fascia; D: DWI sequence displaying patchy high signal intensity within the lesion; E: Corresponding apparent diffusion coefficient map indicating low signal intensity, indicative of significantly restricted diffusion.
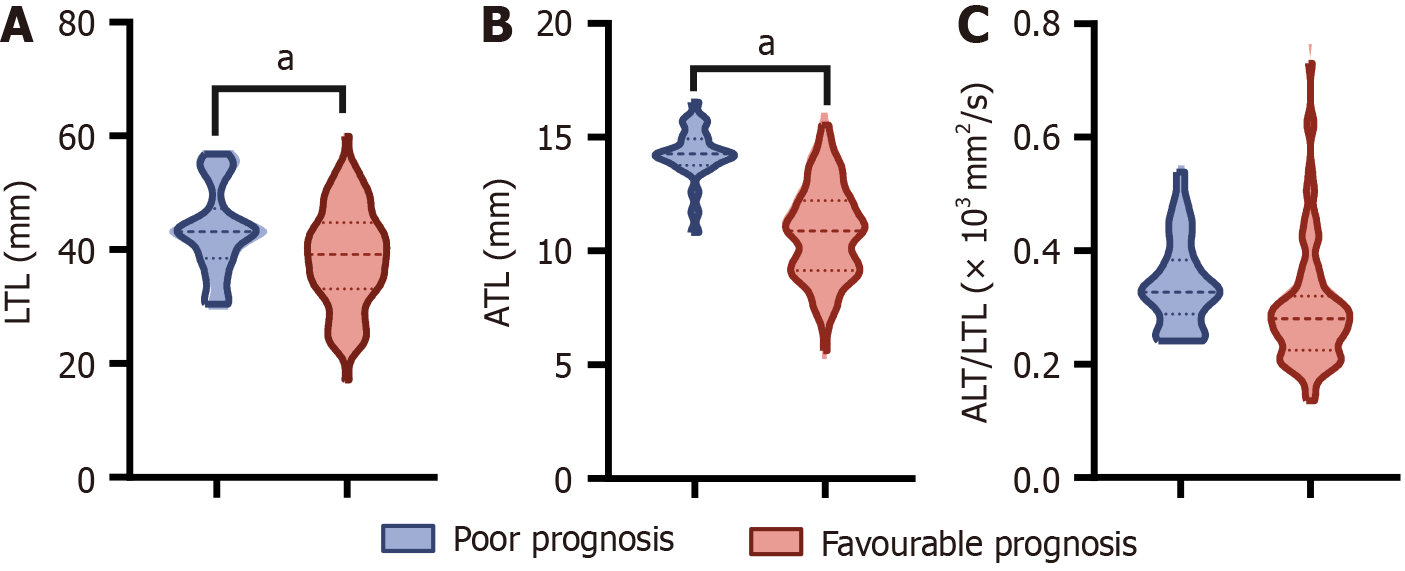
Figure 2 Longitudinal tumor length, axial tumor length, and axial tumor length/longitudinal tumor length.
A: Longitudinal tumor length (LTL) of patients with colorectal cancer; B: Axial tumor length (ALT) of patients with colorectal cancer; C: ATL/LTL of patients with colorectal cancer. aP < 0.05; LTL: Longitudinal tumor length; ATL: Axial tumor length.
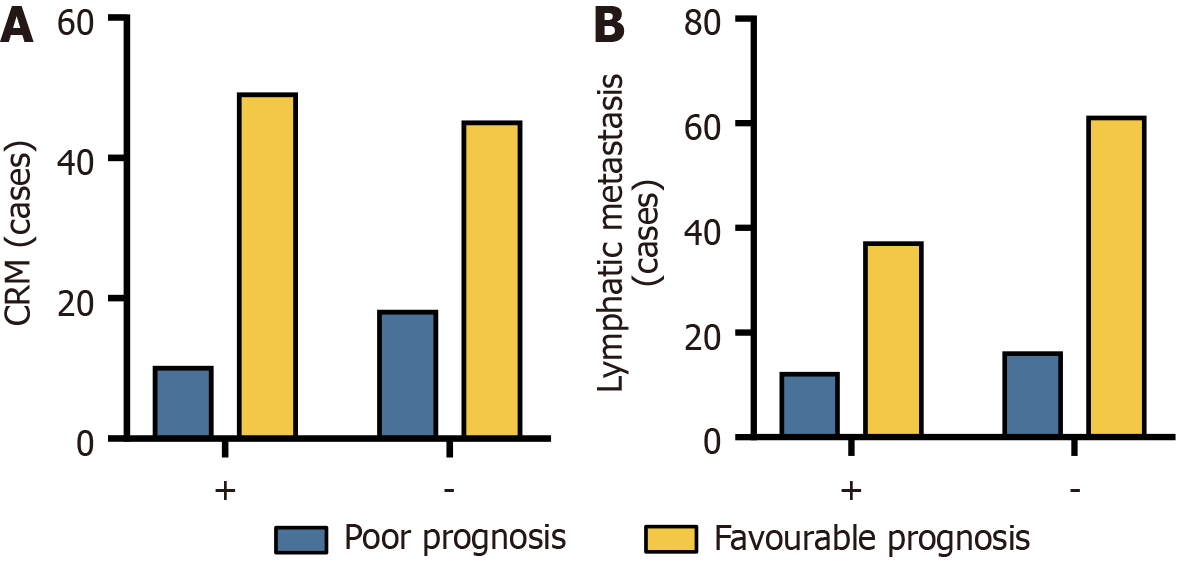
Figure 3 Circumferential resection margin and lymph node metastasis.
A: The number of positive and negative circumferential resection margin in patients with colorectal cancer; B: The number of positive and negative lymph node metastases in patients with colorectal cancer. CRM: Circumferential resection margin; +: Positive; -: Negative.
Figure 4 Comparison of imaging parameters.
A: Volume transfer constant of patients with colorectal cancer; B: Rate constant of patients with colorectal cancer; C: Volume of the extravascular extracellular space of patients with colorectal cancer; D: Plasma volume fraction of patients with colorectal cancer; E: Apparent diffusion coefficient of patients with colorectal cancer. aP < 0.05; Ktrans: Volume transfer constant; Kep: Rate constant; Ve: Volume of the extravascular extracellular space; Vp: Plasma volume fraction; ADC: Apparent diffusion coefficient.
Figure 5 Perioperative-related indicators for different prognoses.
A: Operation time of patients with colorectal cancer; B: Perioperative bleeding in patients with colorectal cancer; C: First time of exhaust for patients with colorectal cancer; D: First time of defecation for patients with colorectal cancer; E: Eating recovery time for patients with colorectal cancer; F: Hospital stay for patients with colorectal cancer. aP < 0.05.
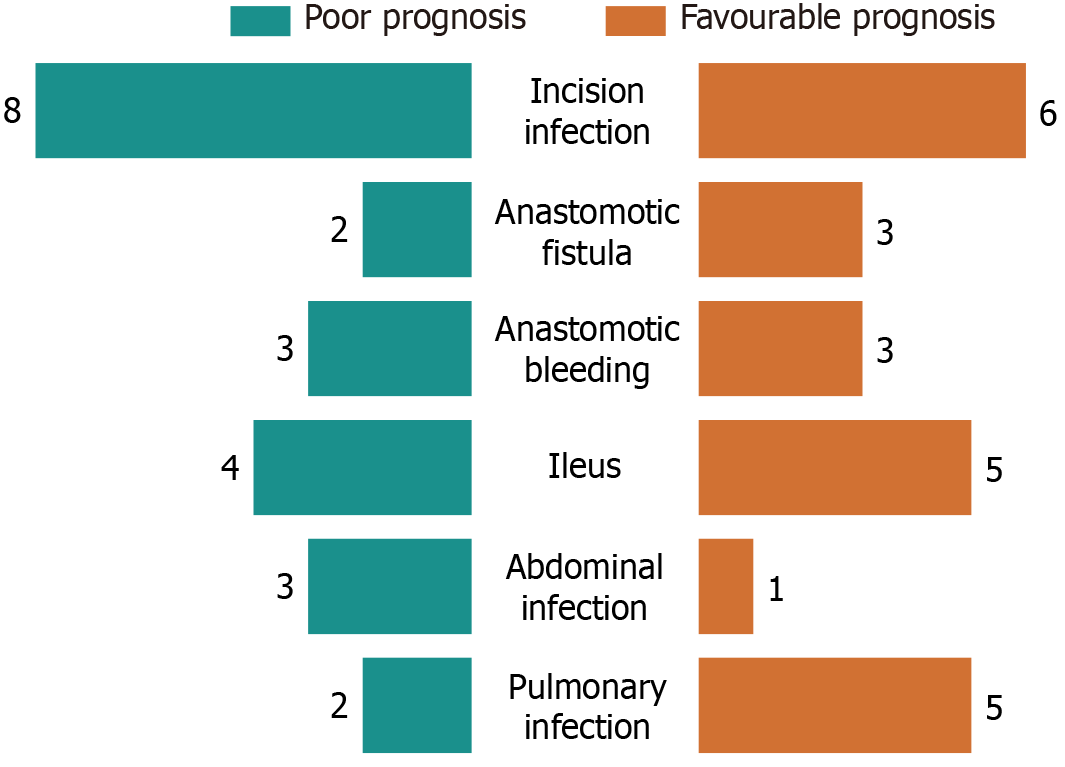
Figure 6
Comparison of postoperative complications between groups.
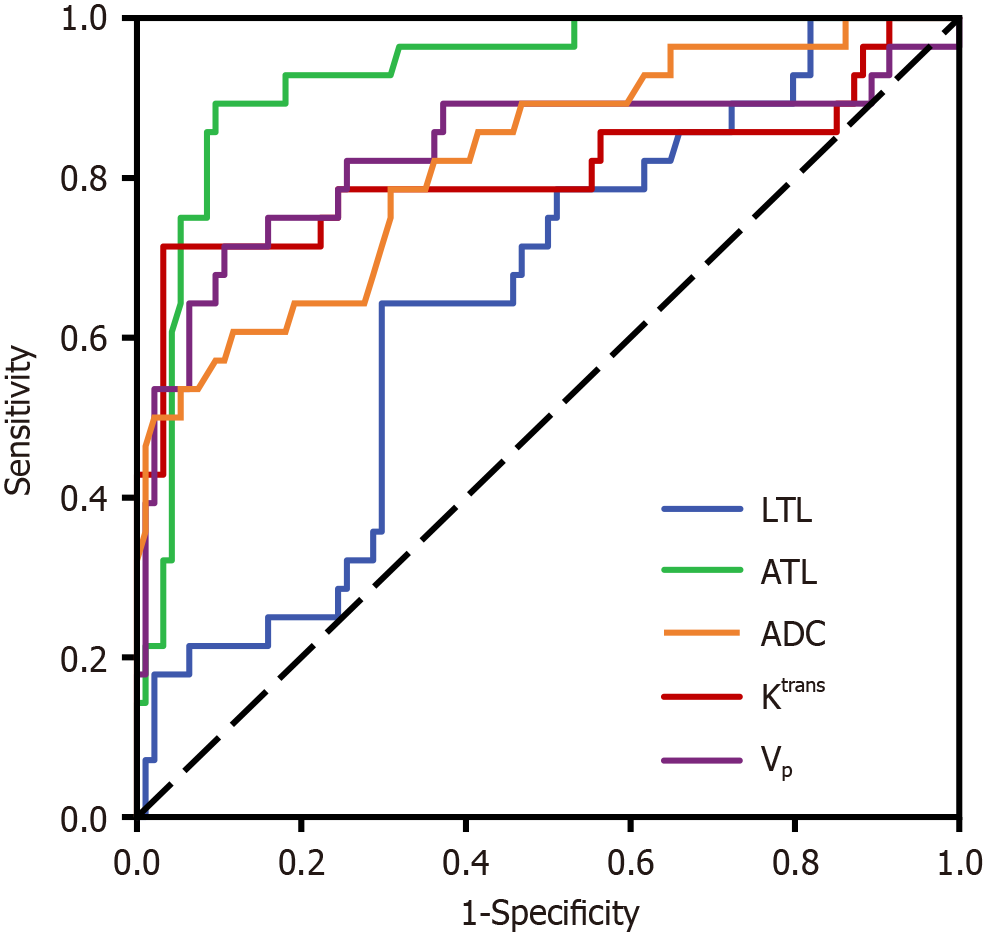
Figure 7 Receiver operating characteristic curve of imaging features for predicting short-term prognosis of laparoscopic radical resec
- Citation: Fang ZH, Hao AH, Qi YG. Imaging features and correlation with short-term prognosis in laparoscopic radical resection of colorectal cancer. World J Gastrointest Surg 2025; 17(3): 99782
- URL: https://www.wjgnet.com/1948-9366/full/v17/i3/99782.htm
- DOI: https://dx.doi.org/10.4240/wjgs.v17.i3.99782


