Copyright
©The Author(s) 2025.
World J Gastrointest Surg. Mar 27, 2025; 17(3): 99597
Published online Mar 27, 2025. doi: 10.4240/wjgs.v17.i3.99597
Published online Mar 27, 2025. doi: 10.4240/wjgs.v17.i3.99597
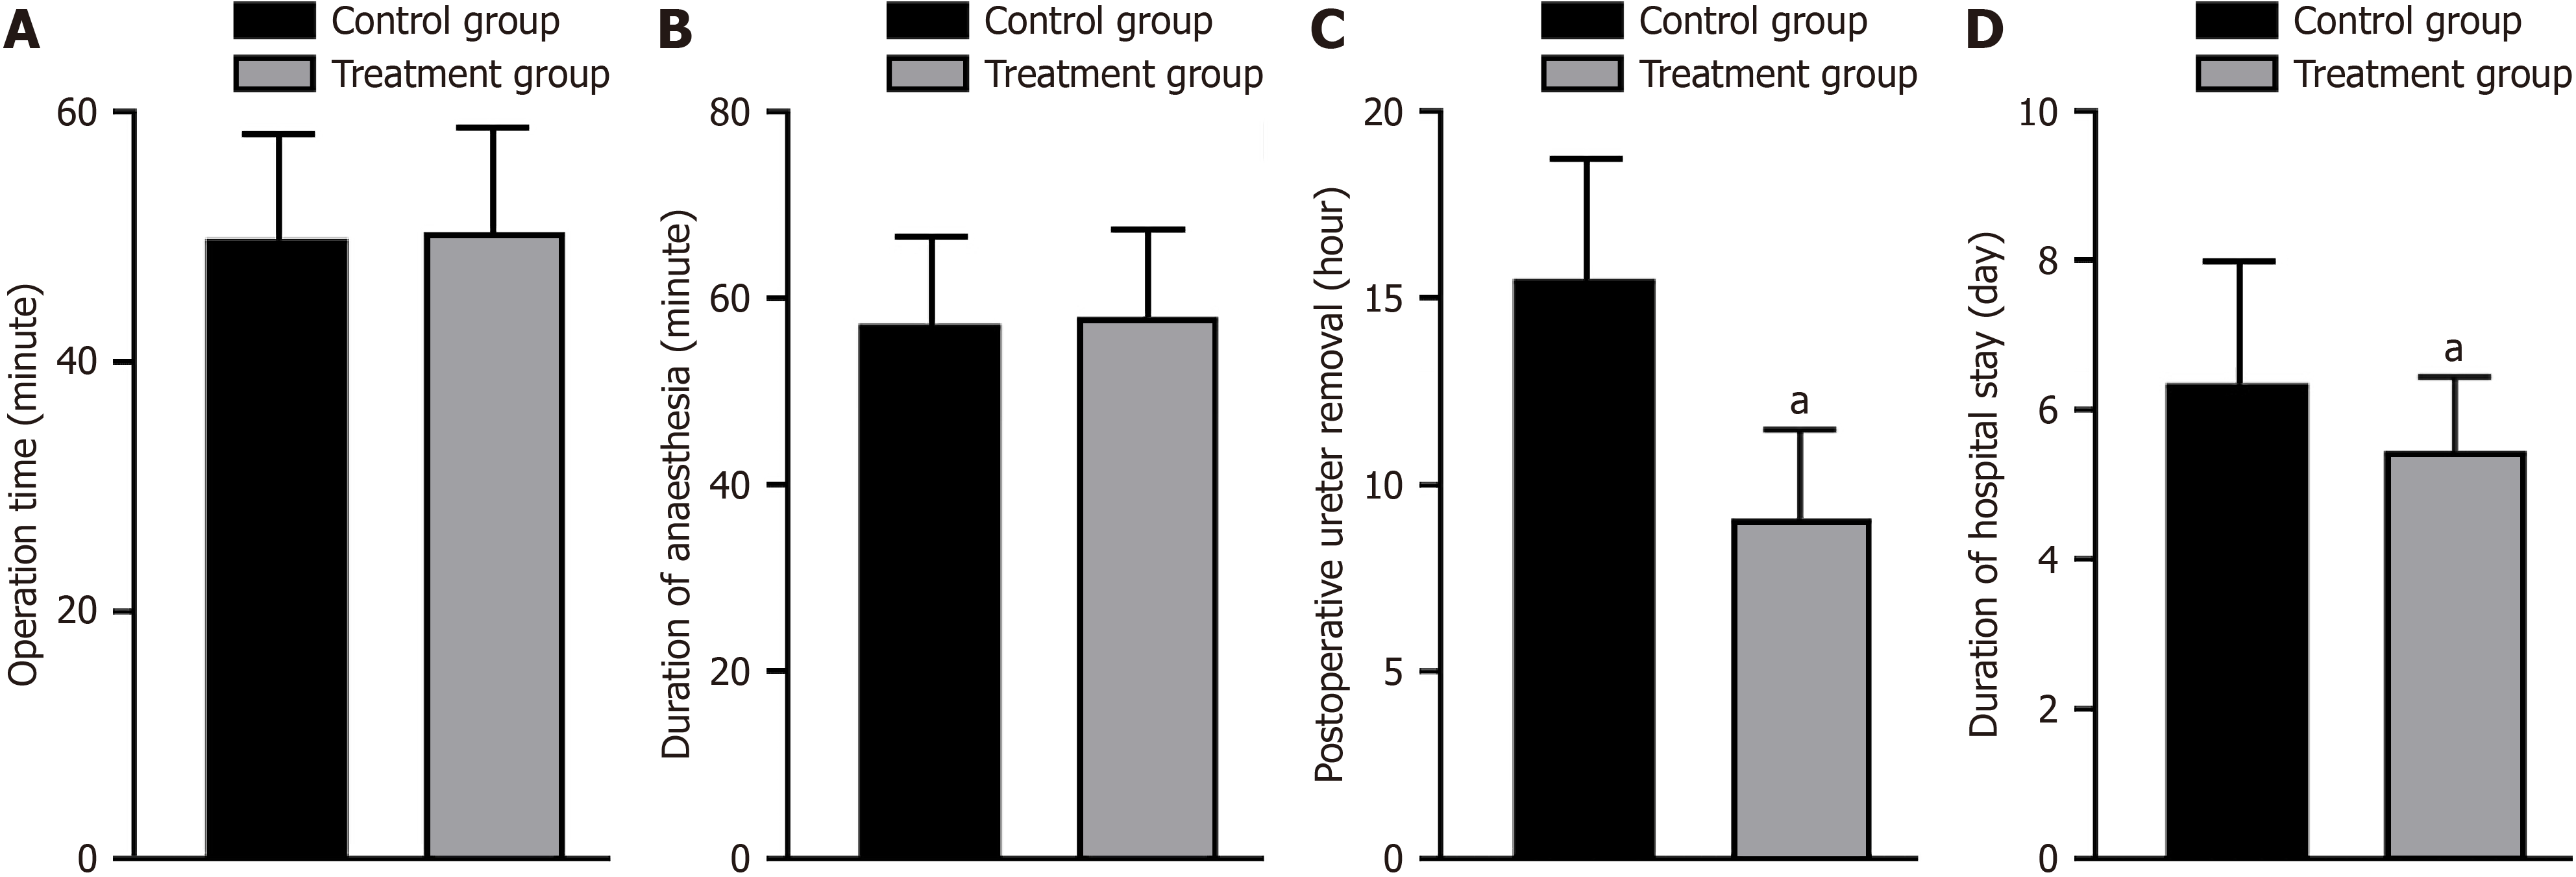
Figure 1 Comparison of perioperative indicators between the two groups of patients.
A: Operation time; B: Duration of anaesthesia; C: Duration of postoperative ureter removal; D: Duration of hospital stay. aP < 0.05 compared with control group.
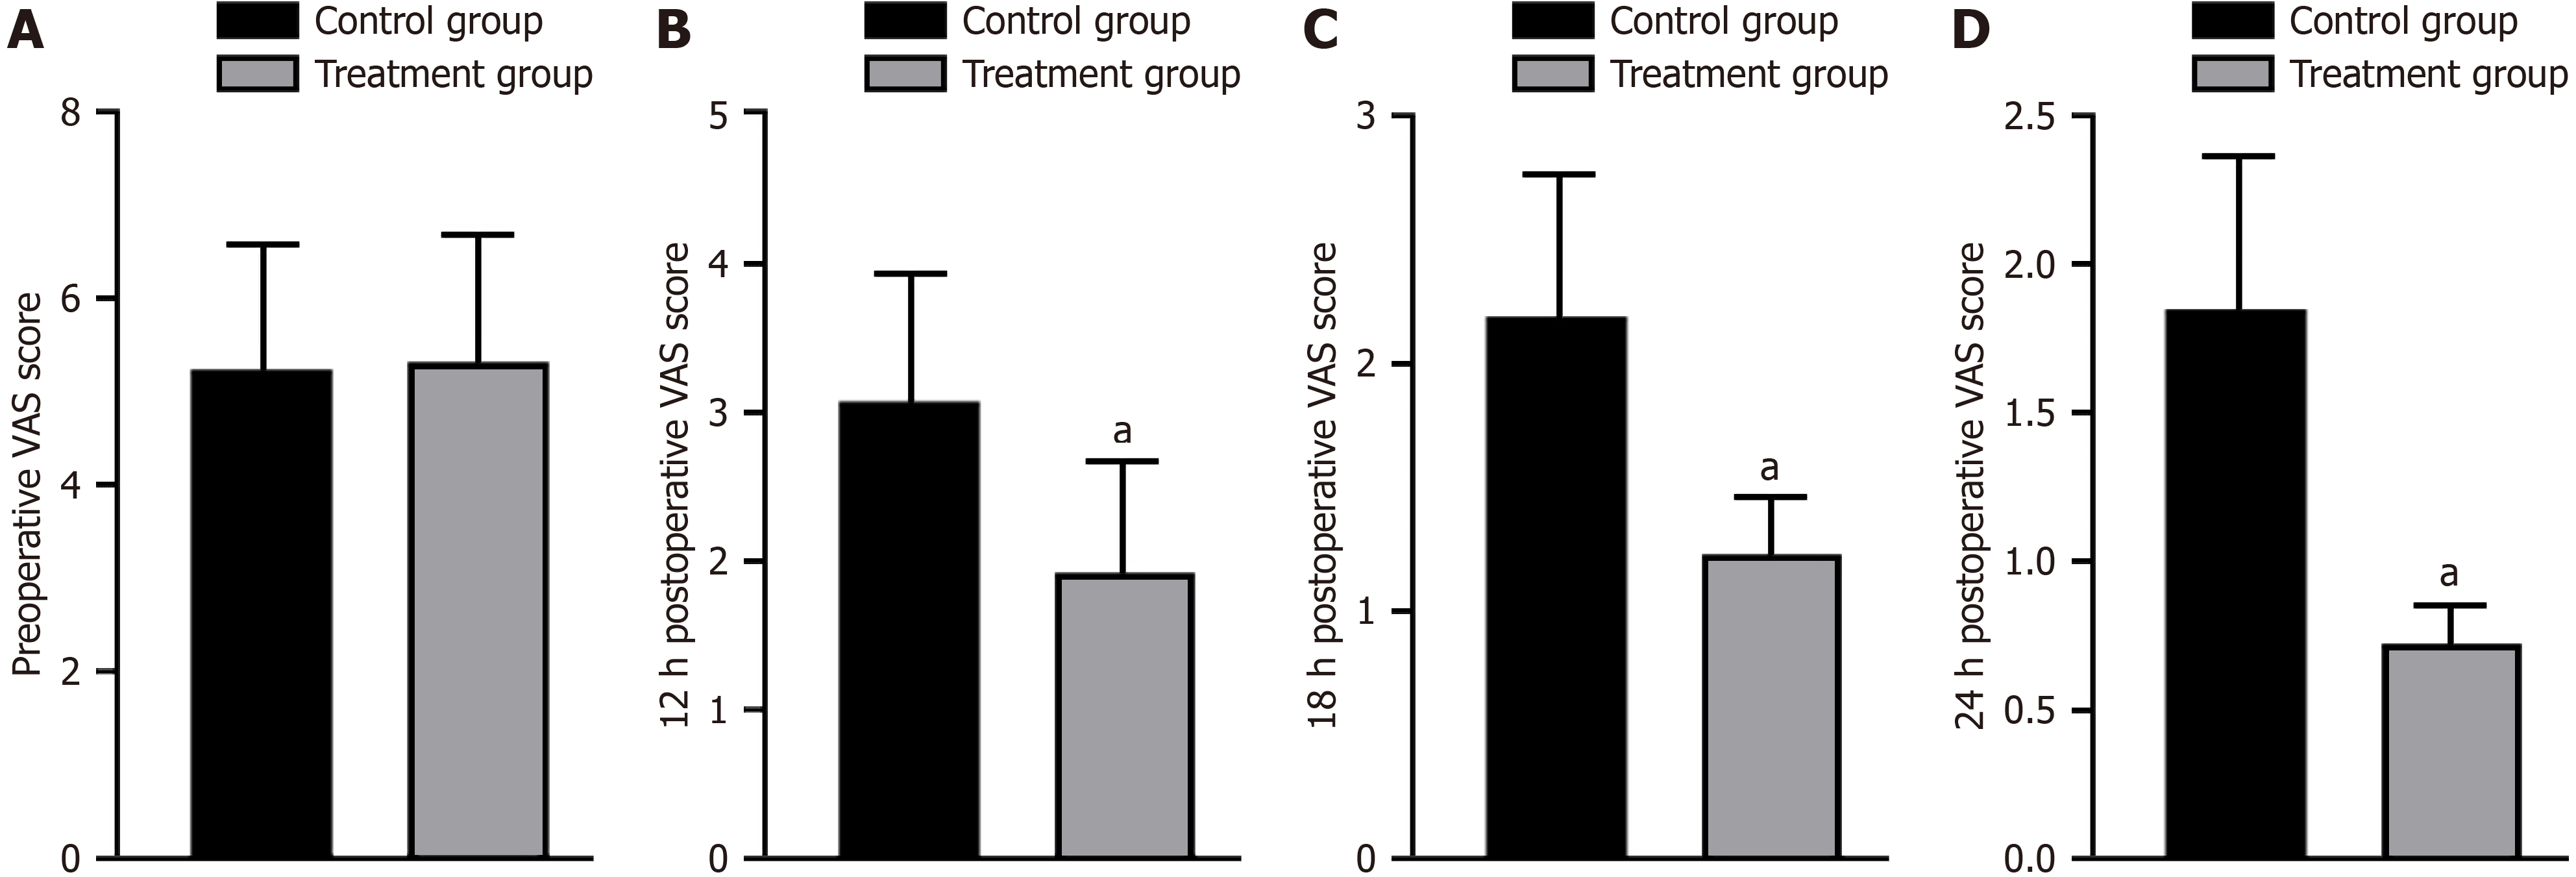
Figure 2 Comparison of perioperative visual analog scale scores between the two groups.
A: Preoperative visual analog scale (VAS) score; B: 12 hours postoperative VAS score; C: 18 hours postoperative VAS score; D: 24 hours postoperative VAS score. aP < 0.05 compared with control group. VAS: Visual analog scale.
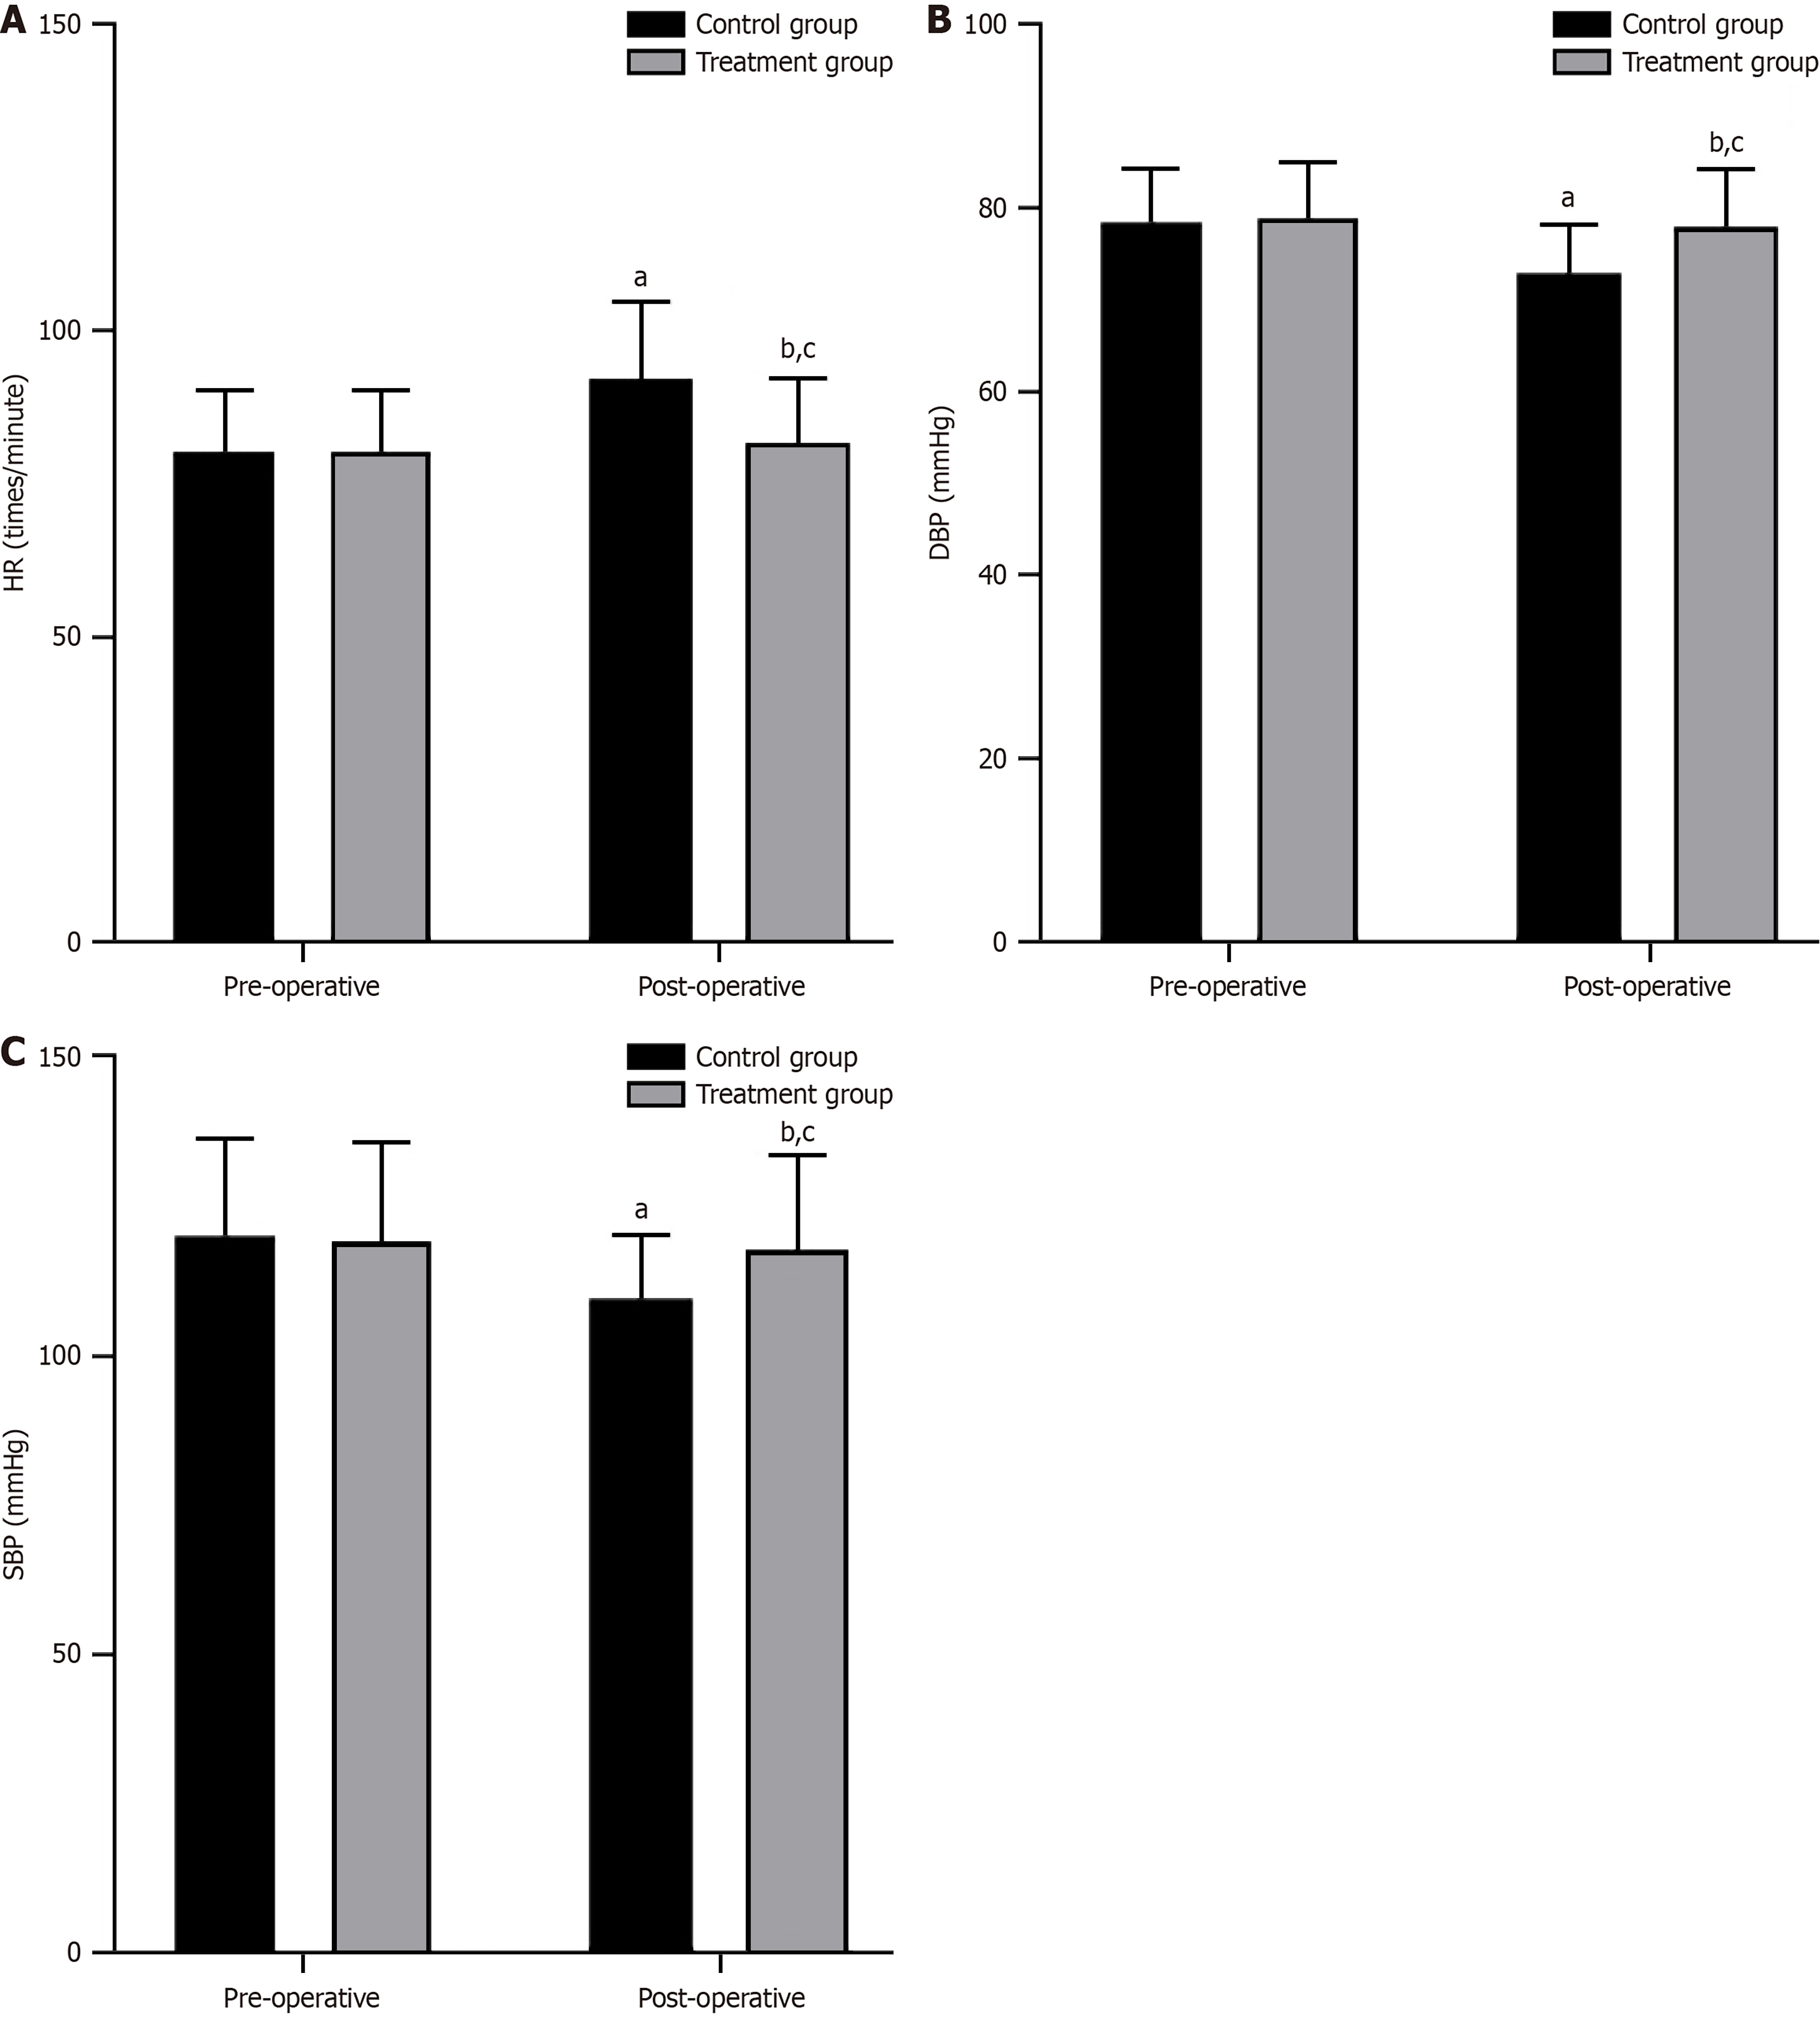
Figure 3 Comparison of pre- and post-operative haemodynamic parameters between the two groups.
A: Heart rate levels; B: Diastolic blood pressure levels; C: Systolic blood pressure levels. aP < 0.05 compared with control group before treatment; bP > 0.05 compared with treatment group after treatment; cP < 0.05 compared with control group after treatment. HR: Heart rate; DBP: Diastolic blood pressure; SBP: Systolic blood pressure.
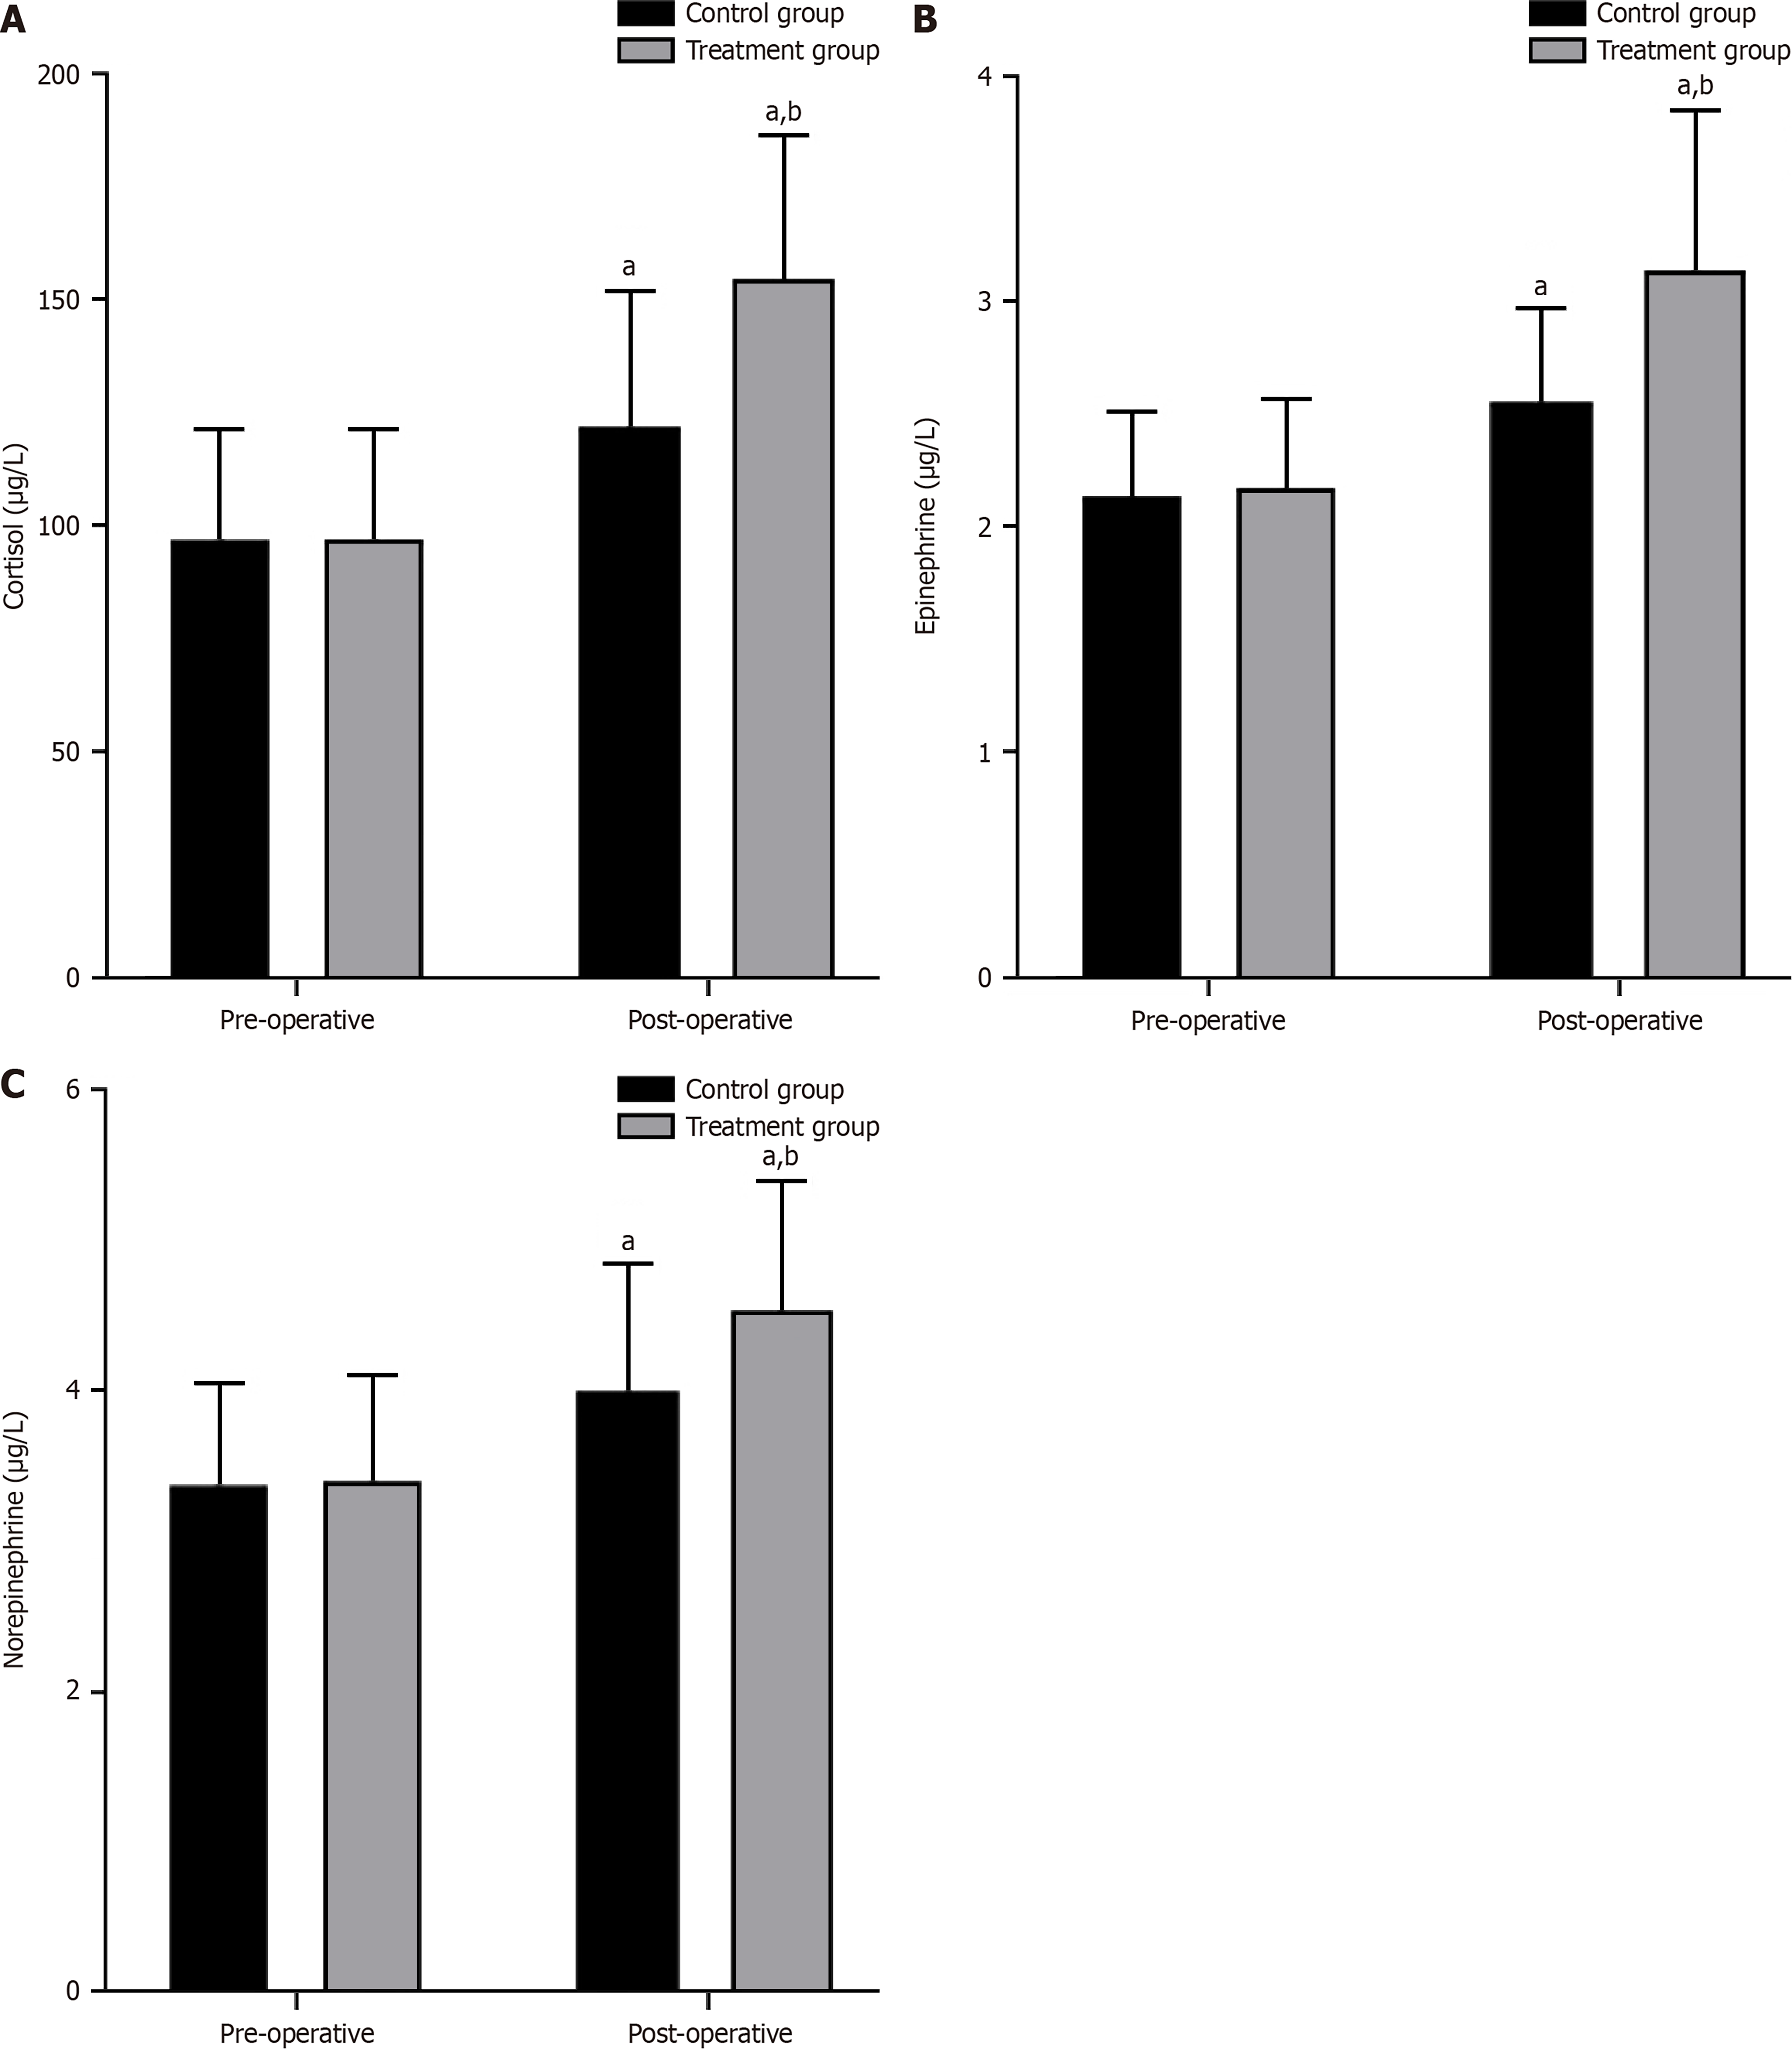
Figure 4 Comparison of pre- and post-operative stress levels between the two groups.
A: Cortisol levels; B: Epinephrine levels; C: Norepinephrine levels. aP < 0.05 compared with preoperative; bP < 0.05 compared with control group postoperatively.
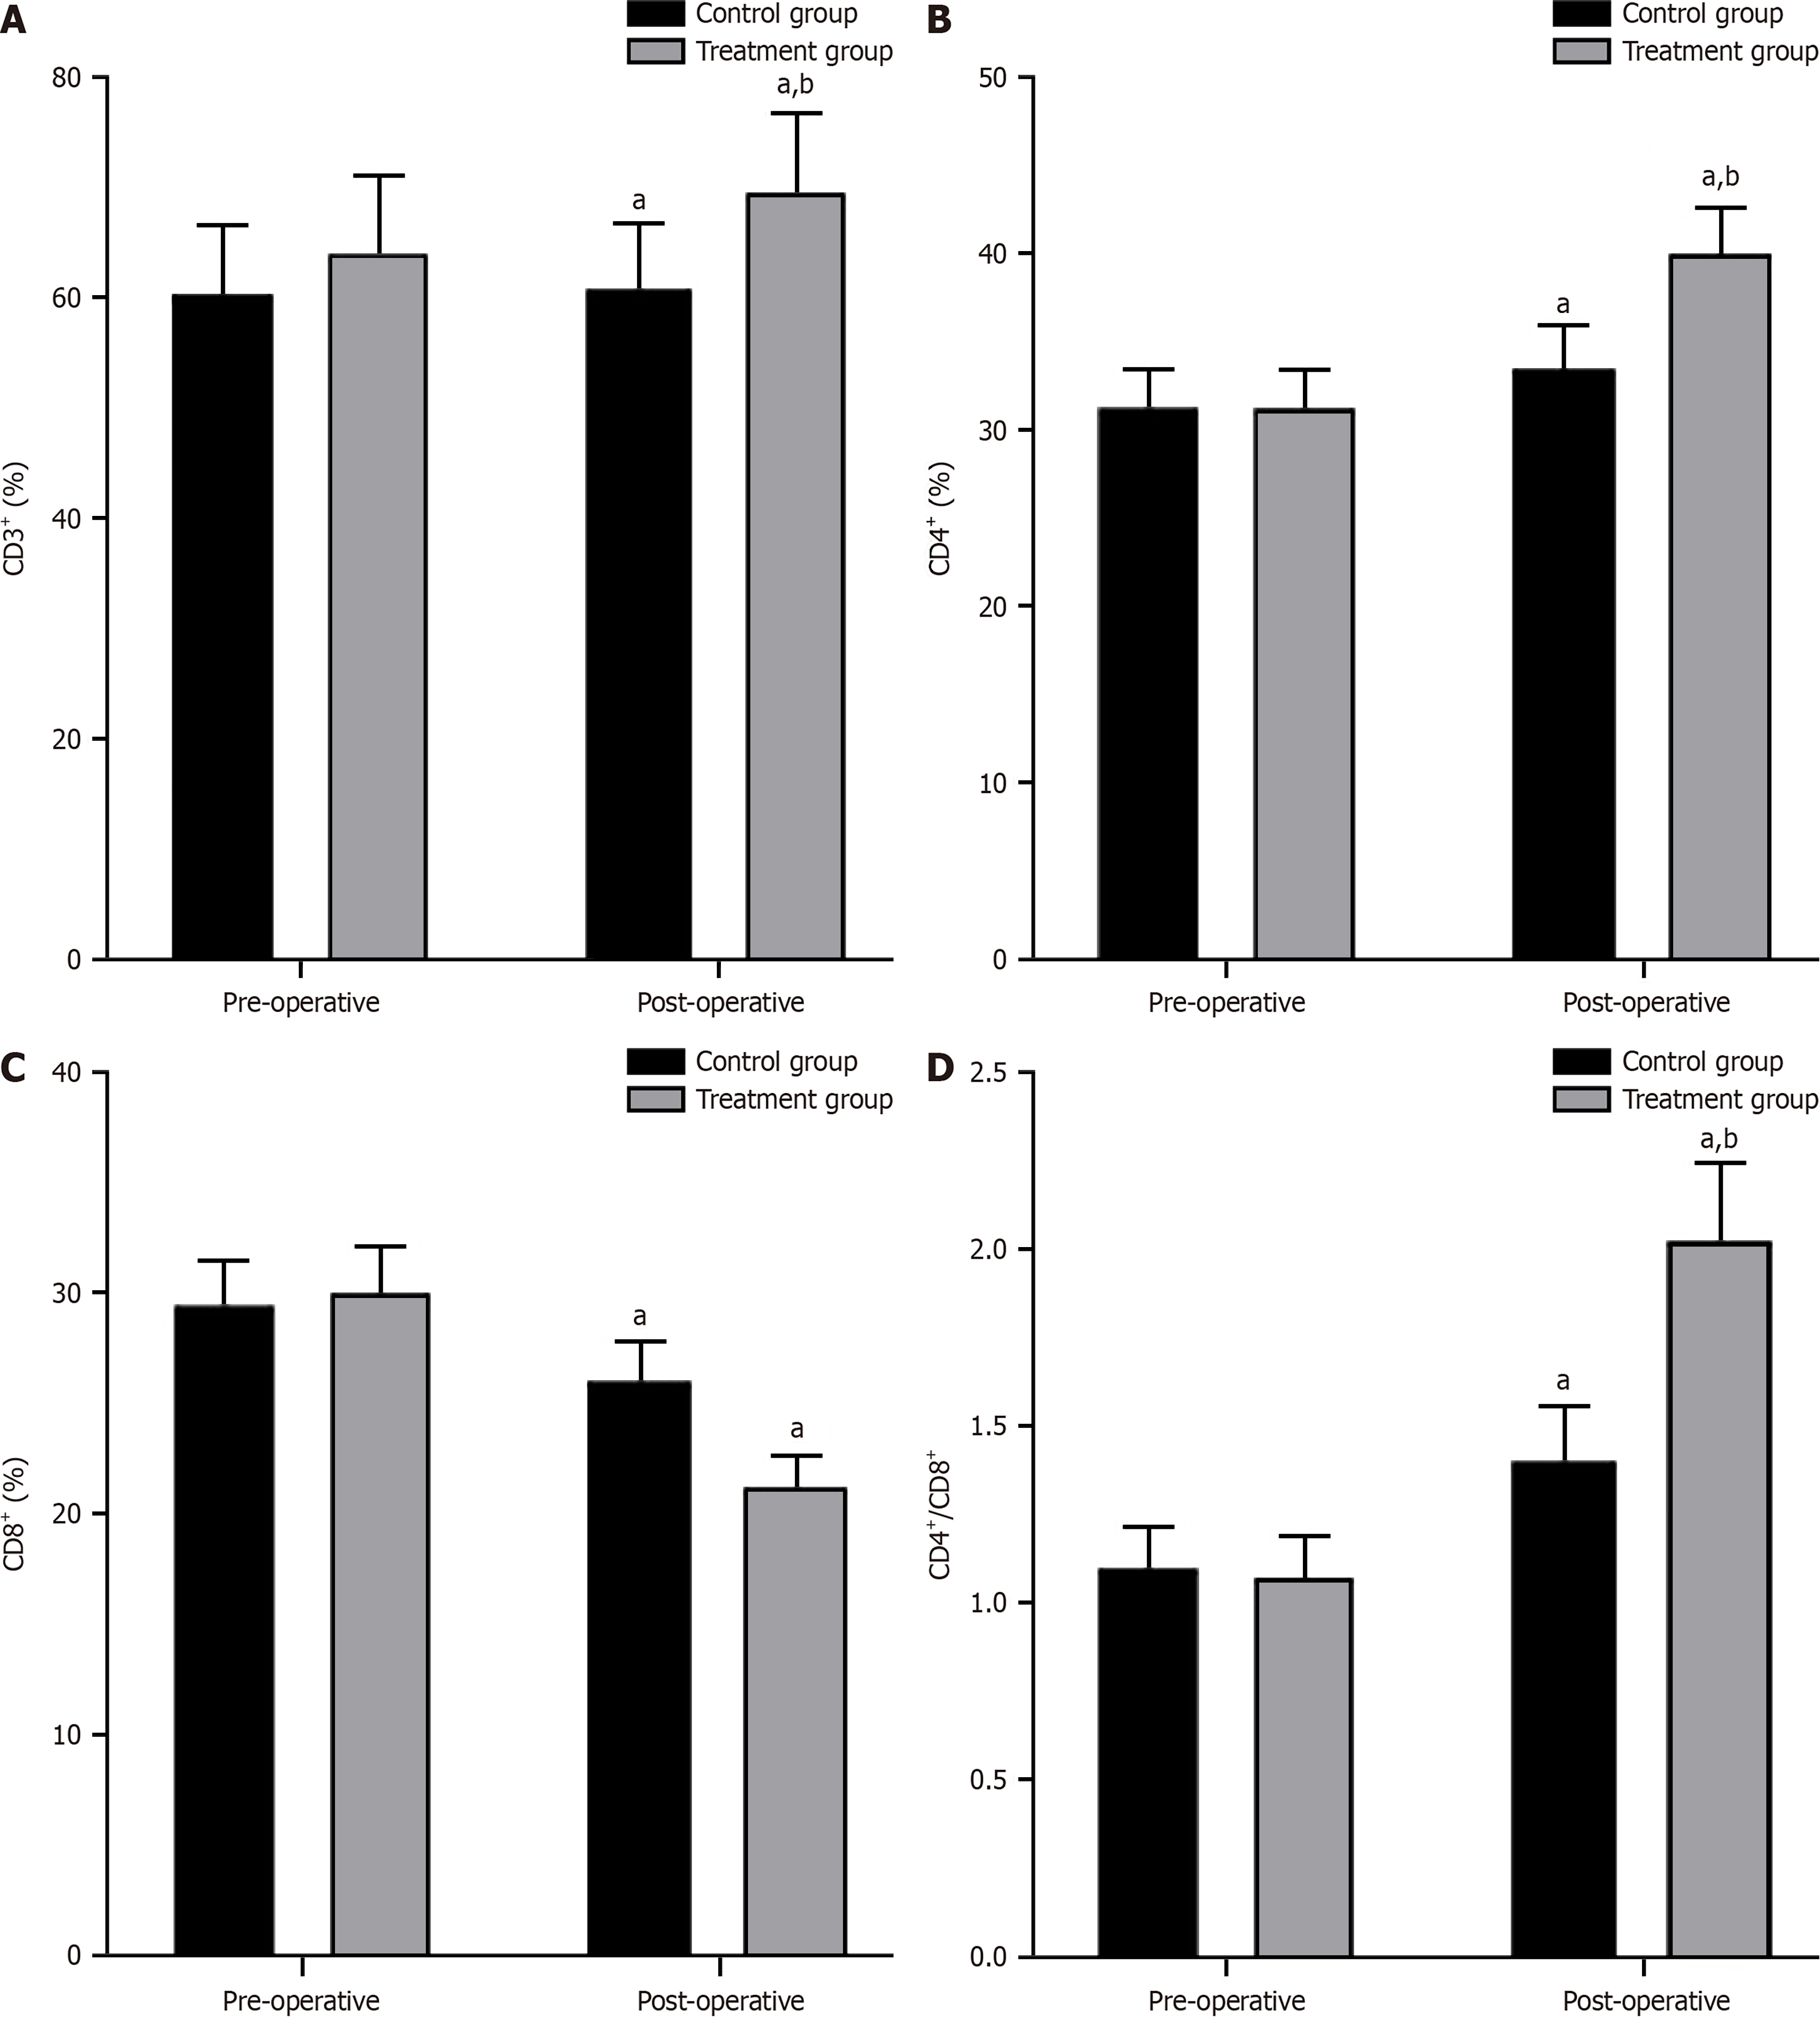
Figure 5 Comparison of immune function between the two groups before and after treatment.
A: CD3+ levels; B: CD4+ levels; C: CD8+ levels; D: CD4+/CD8+ levels. aP < 0.05 compared with preoperative; bP < 0.05 compared with control group postoperatively.
- Citation: Lou QX, Xu KP. Analgesic effect and safety of dexmedetomidine-assisted intravenous-inhalation combined general anesthesia in laparoscopic minimally invasive inguinal hernia surgery. World J Gastrointest Surg 2025; 17(3): 99597
- URL: https://www.wjgnet.com/1948-9366/full/v17/i3/99597.htm
- DOI: https://dx.doi.org/10.4240/wjgs.v17.i3.99597


